Air Monitoring Dashboard UX/UI Design
Cansaas Agency
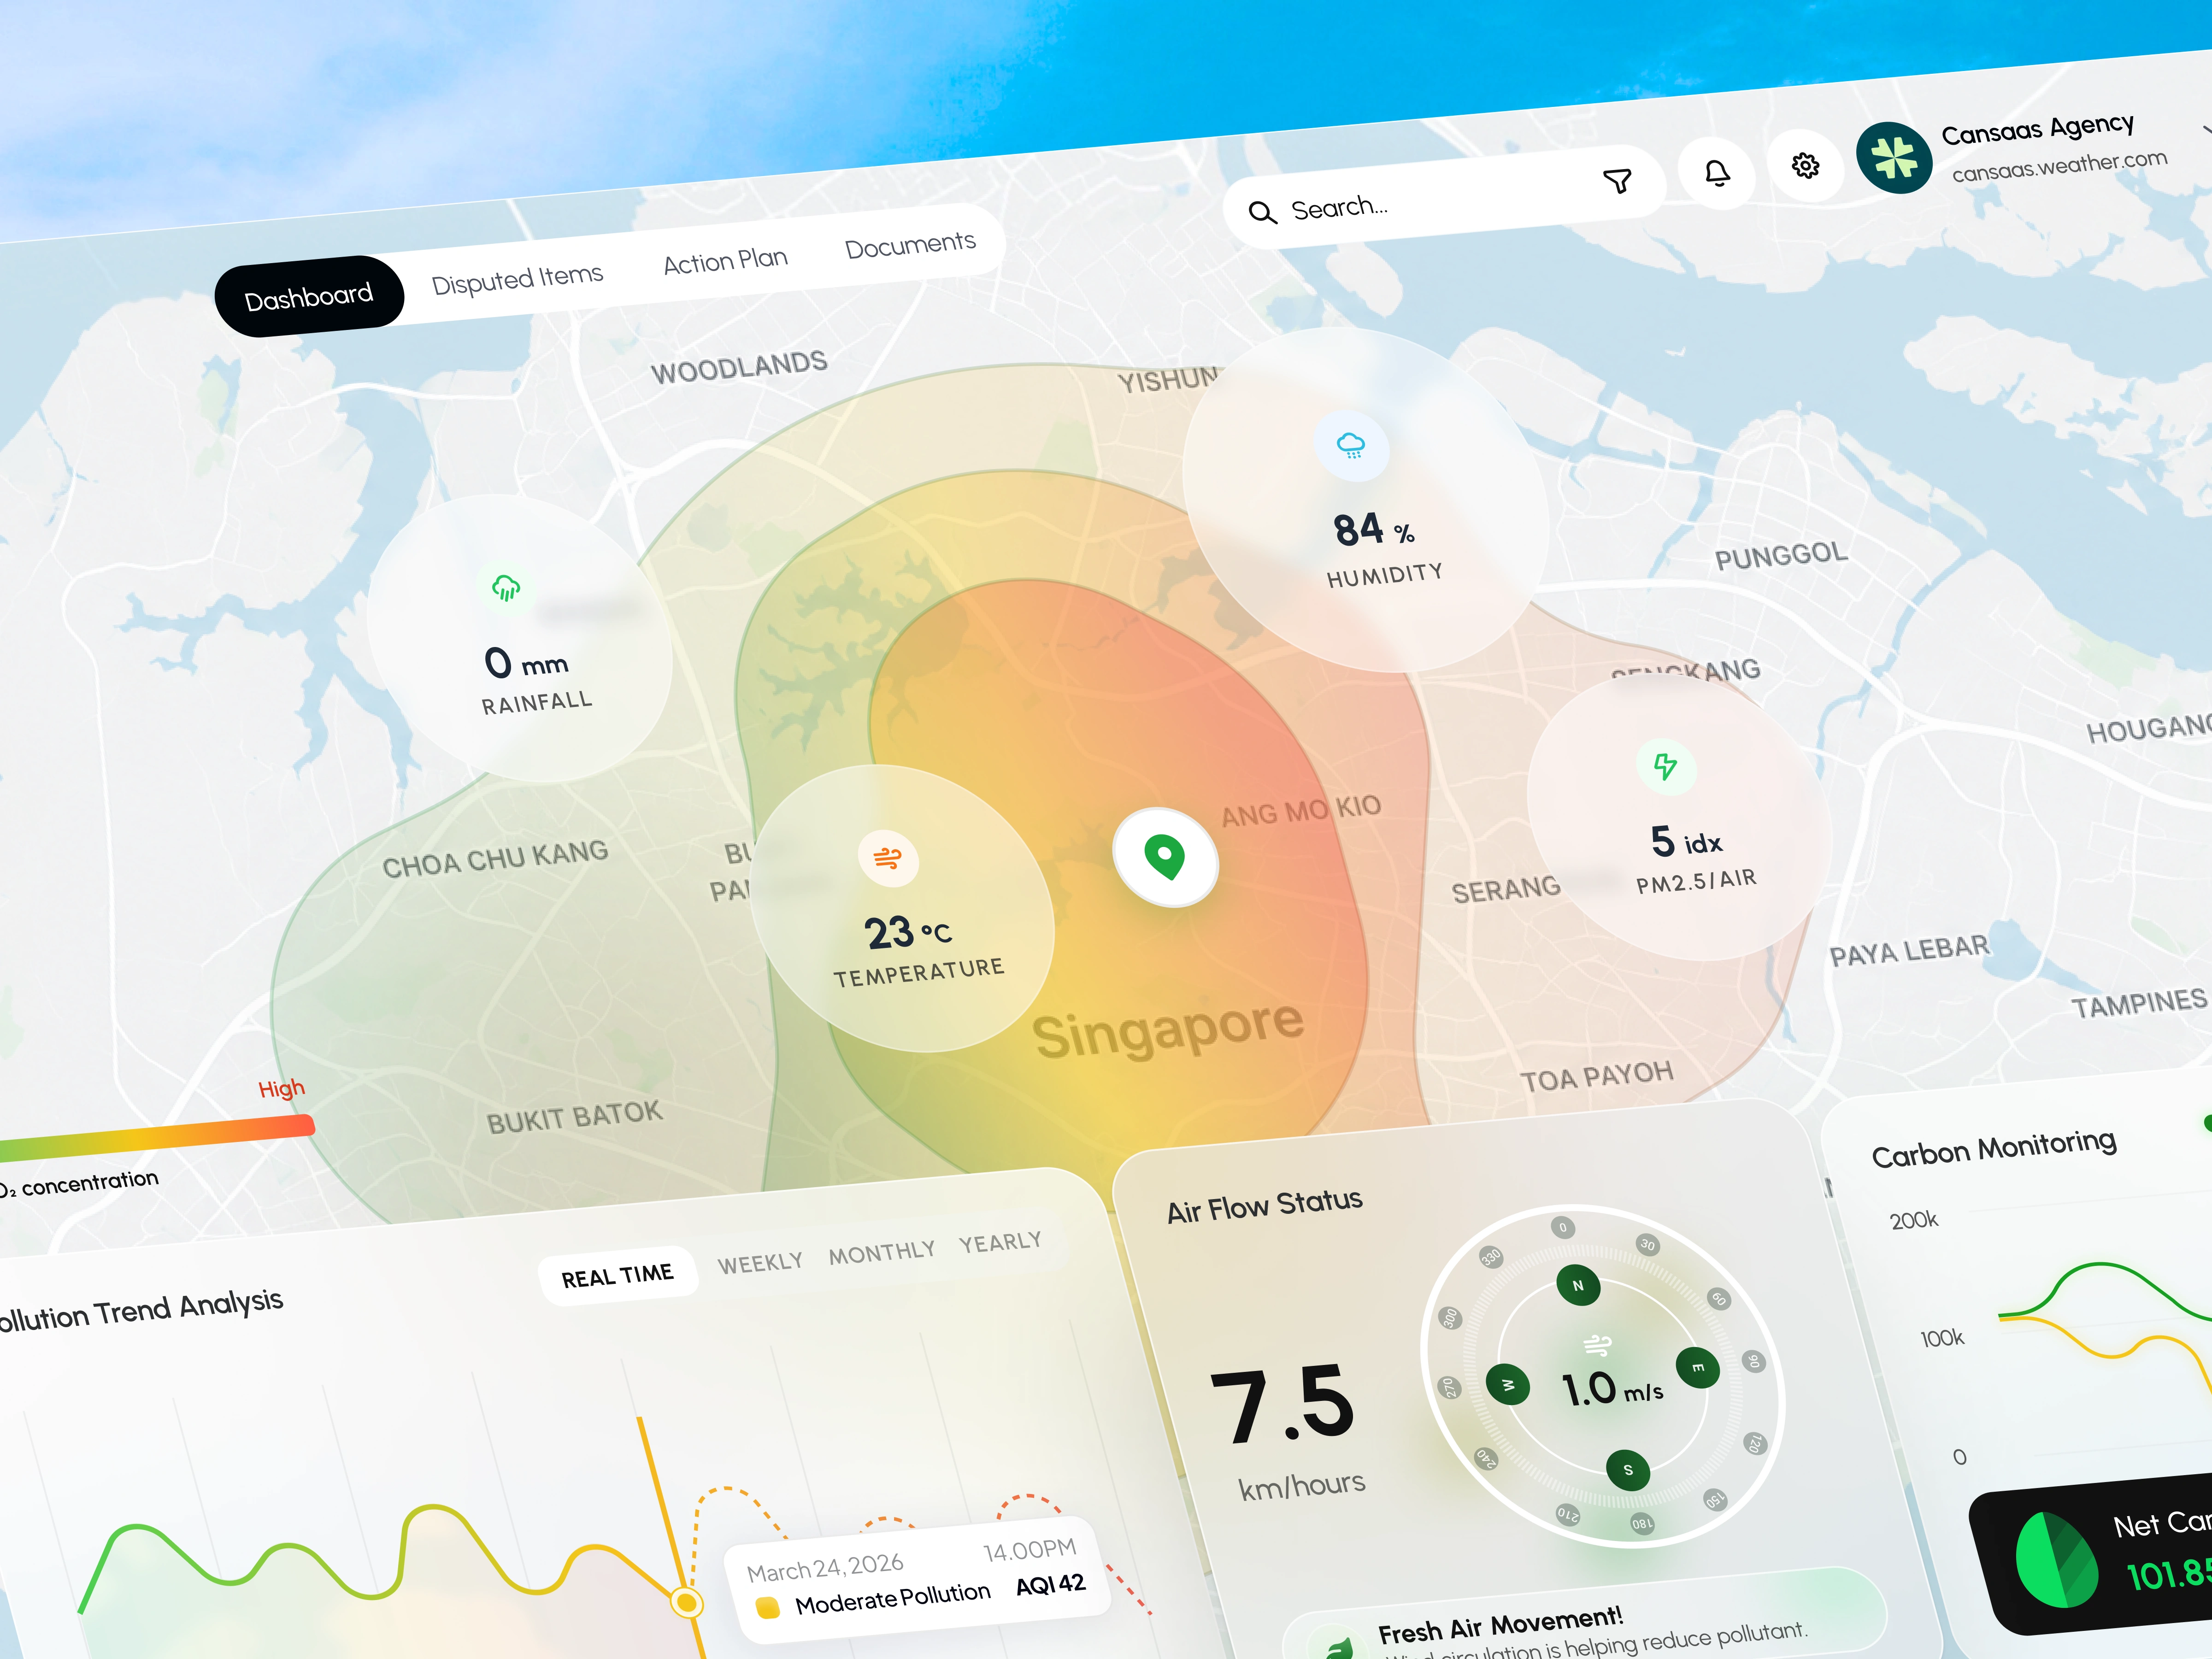
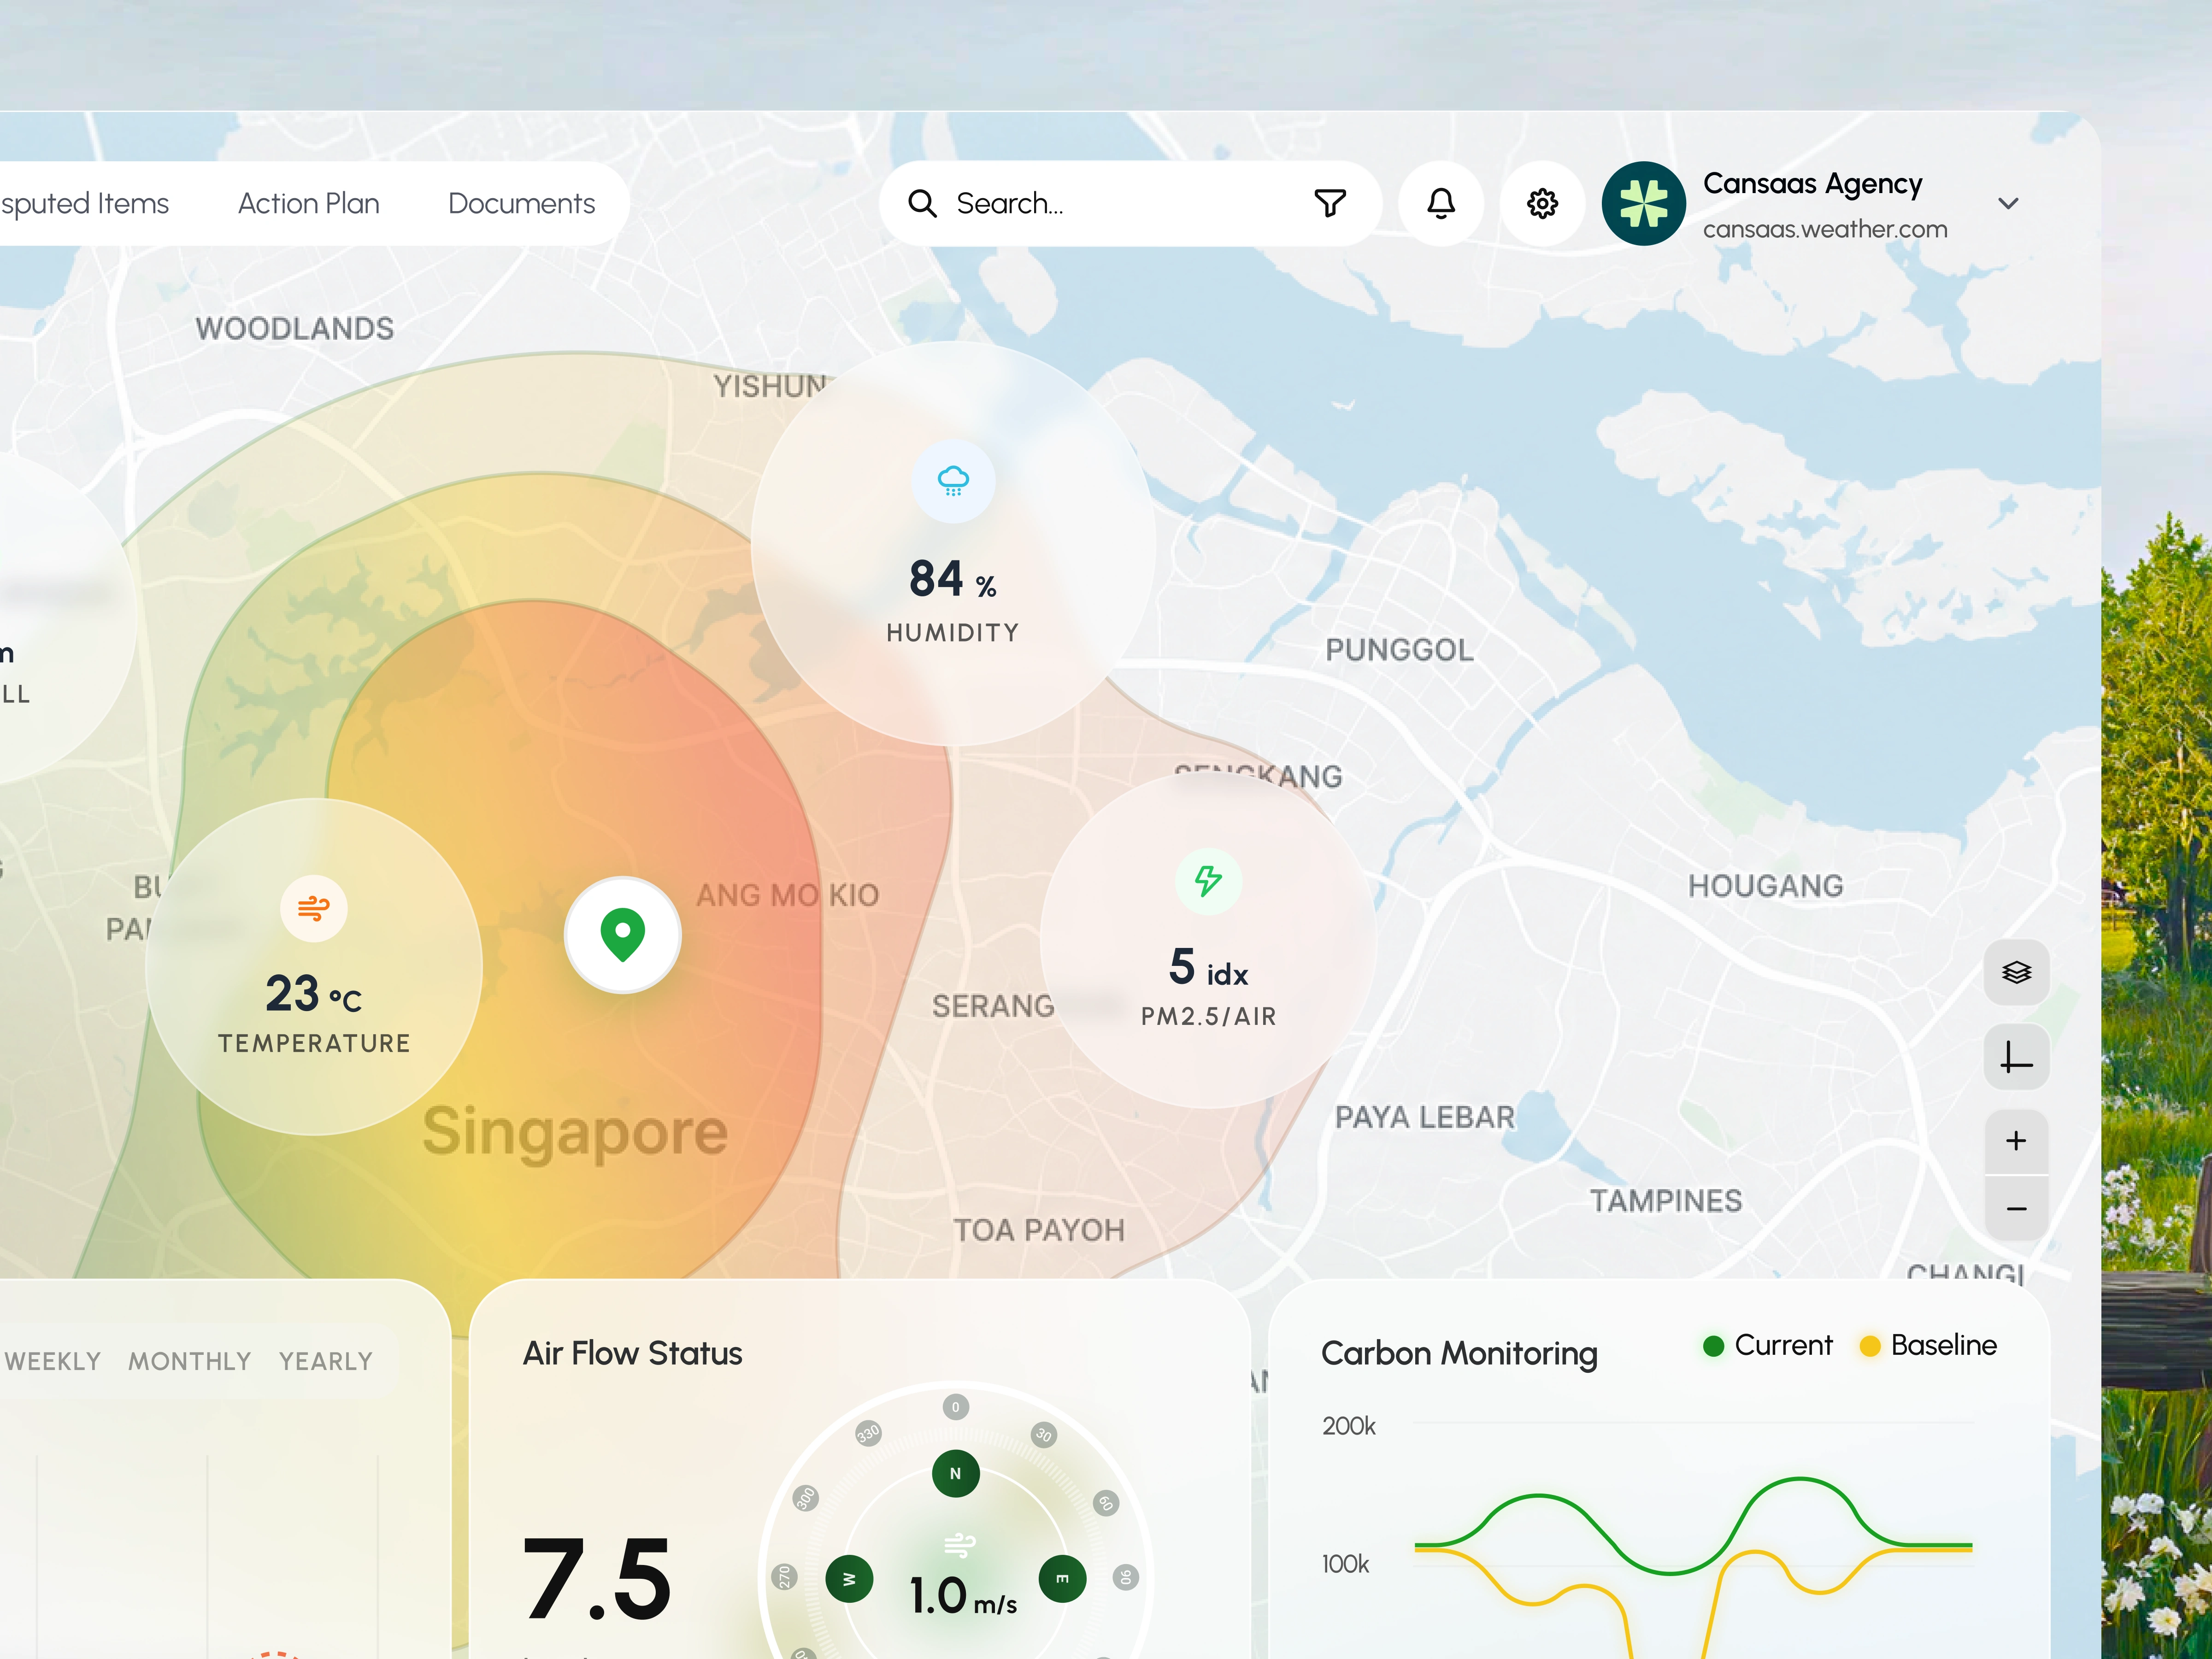
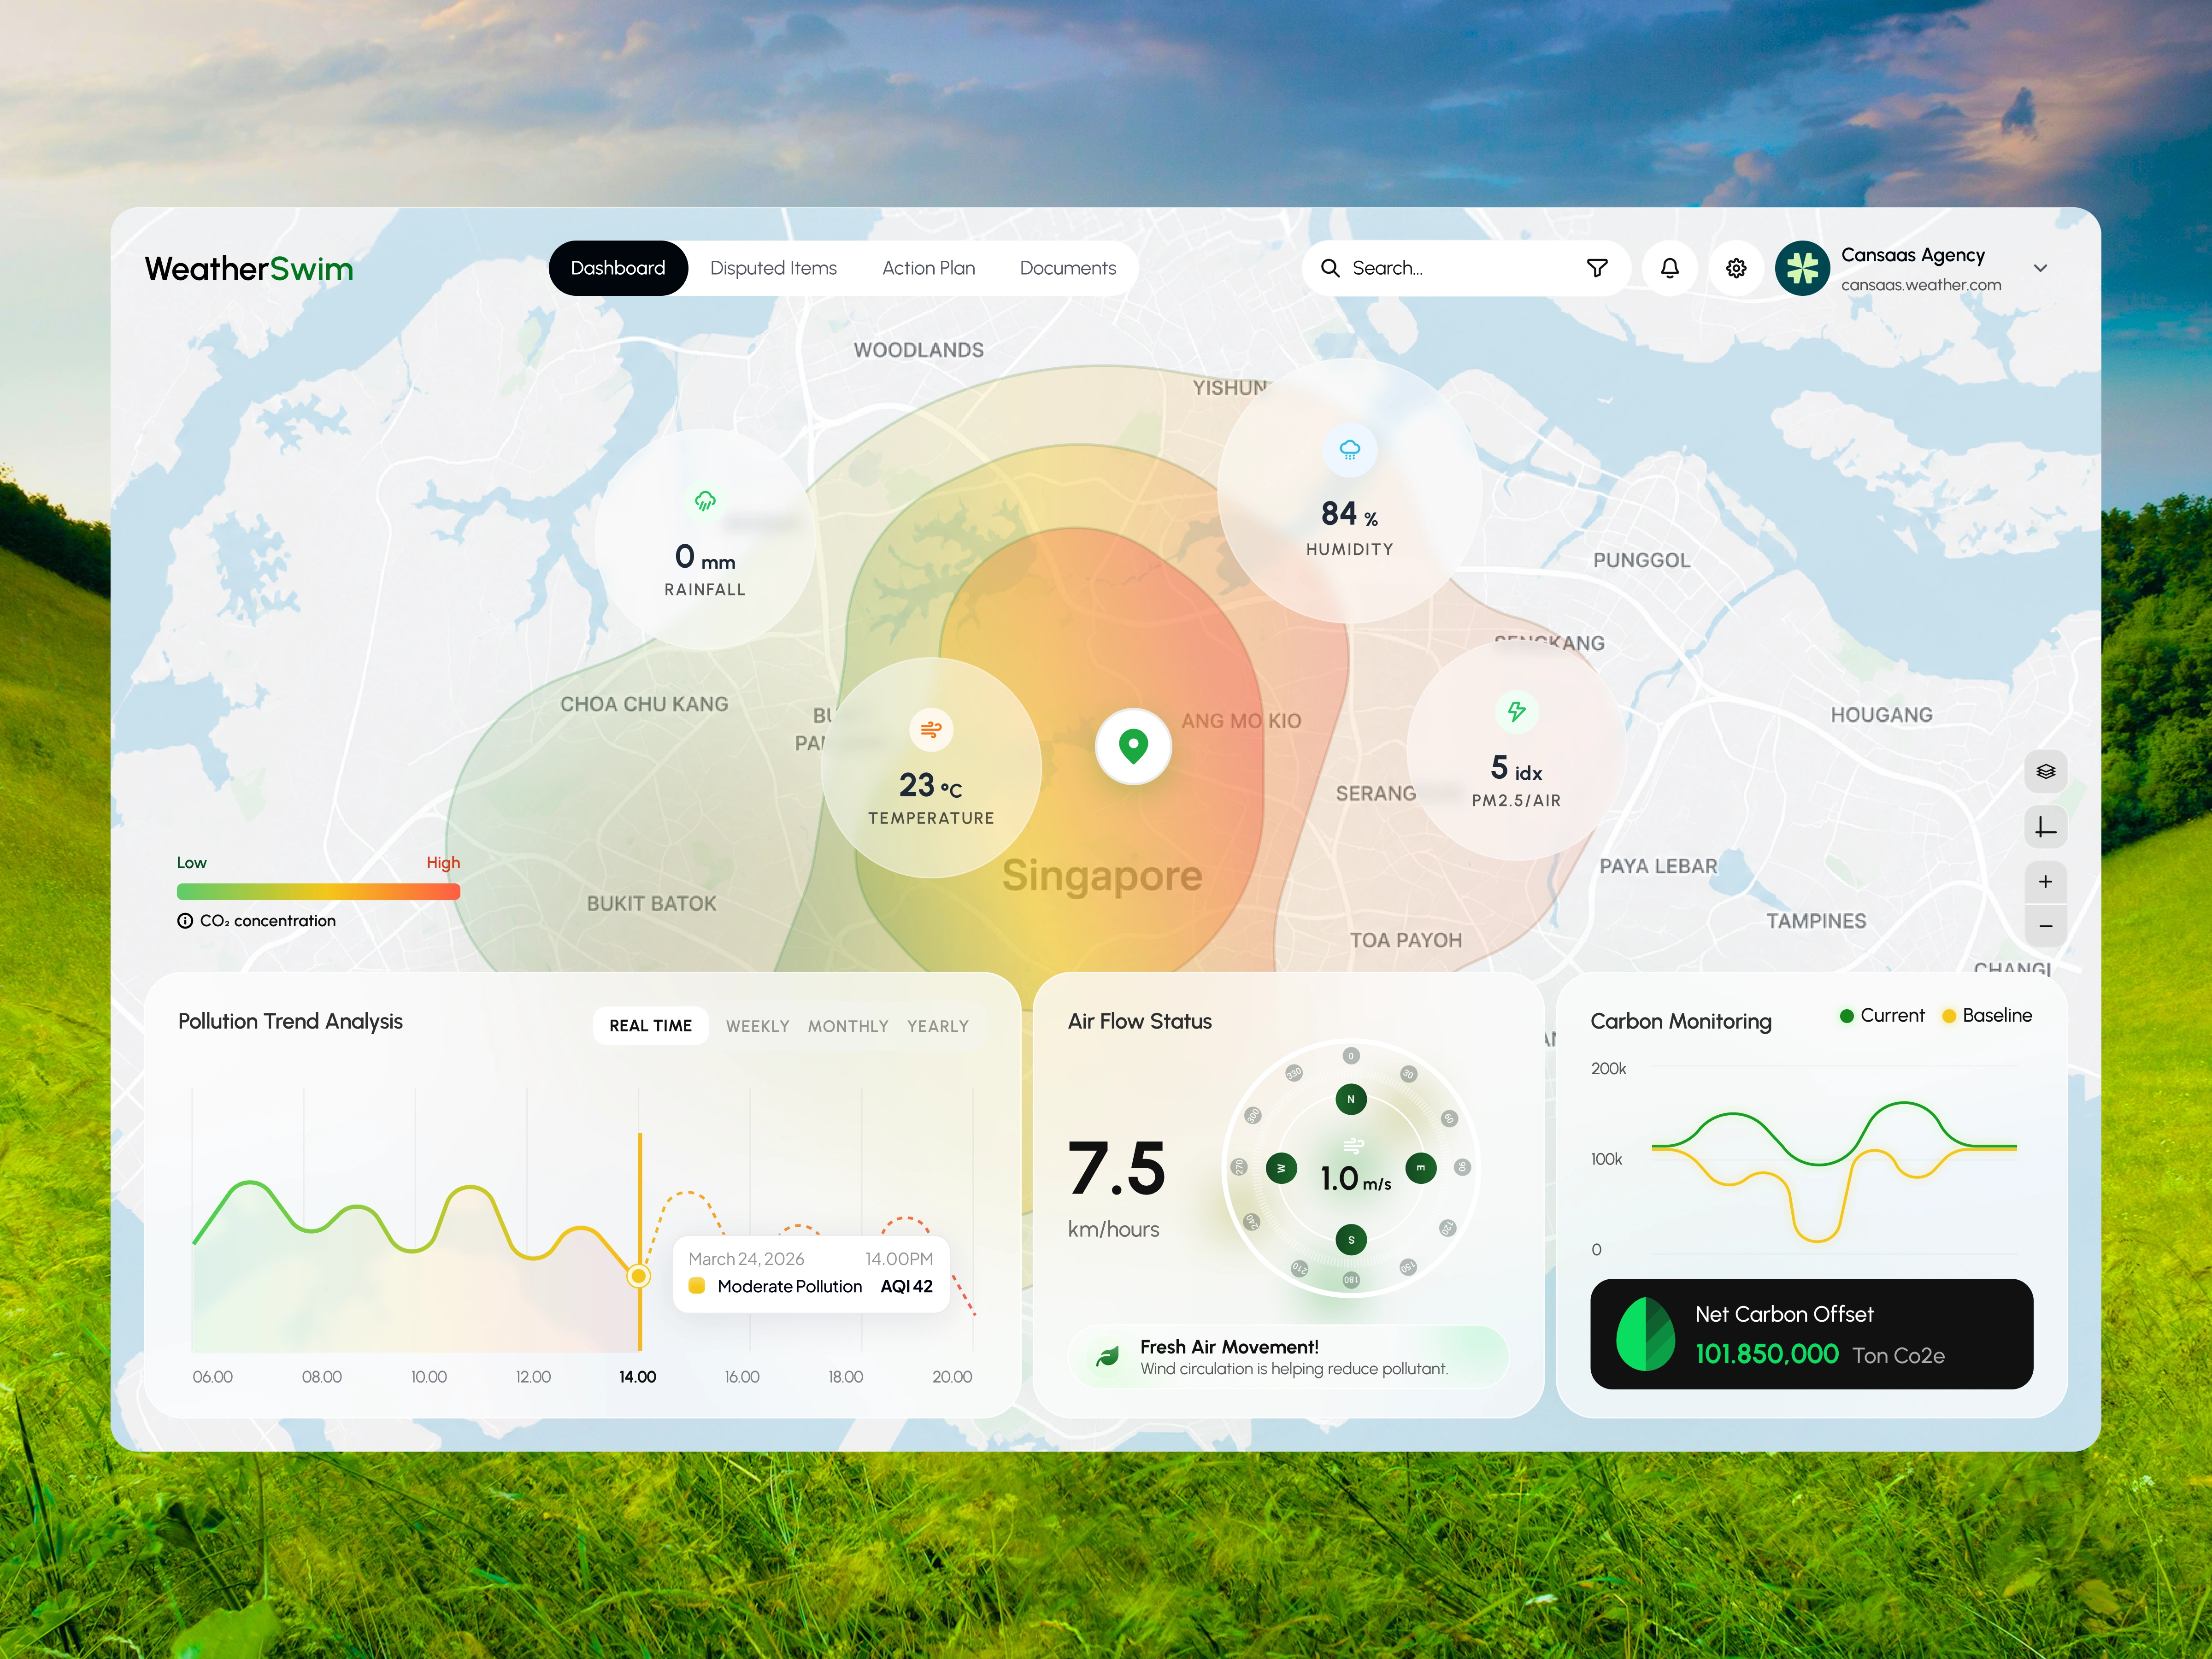
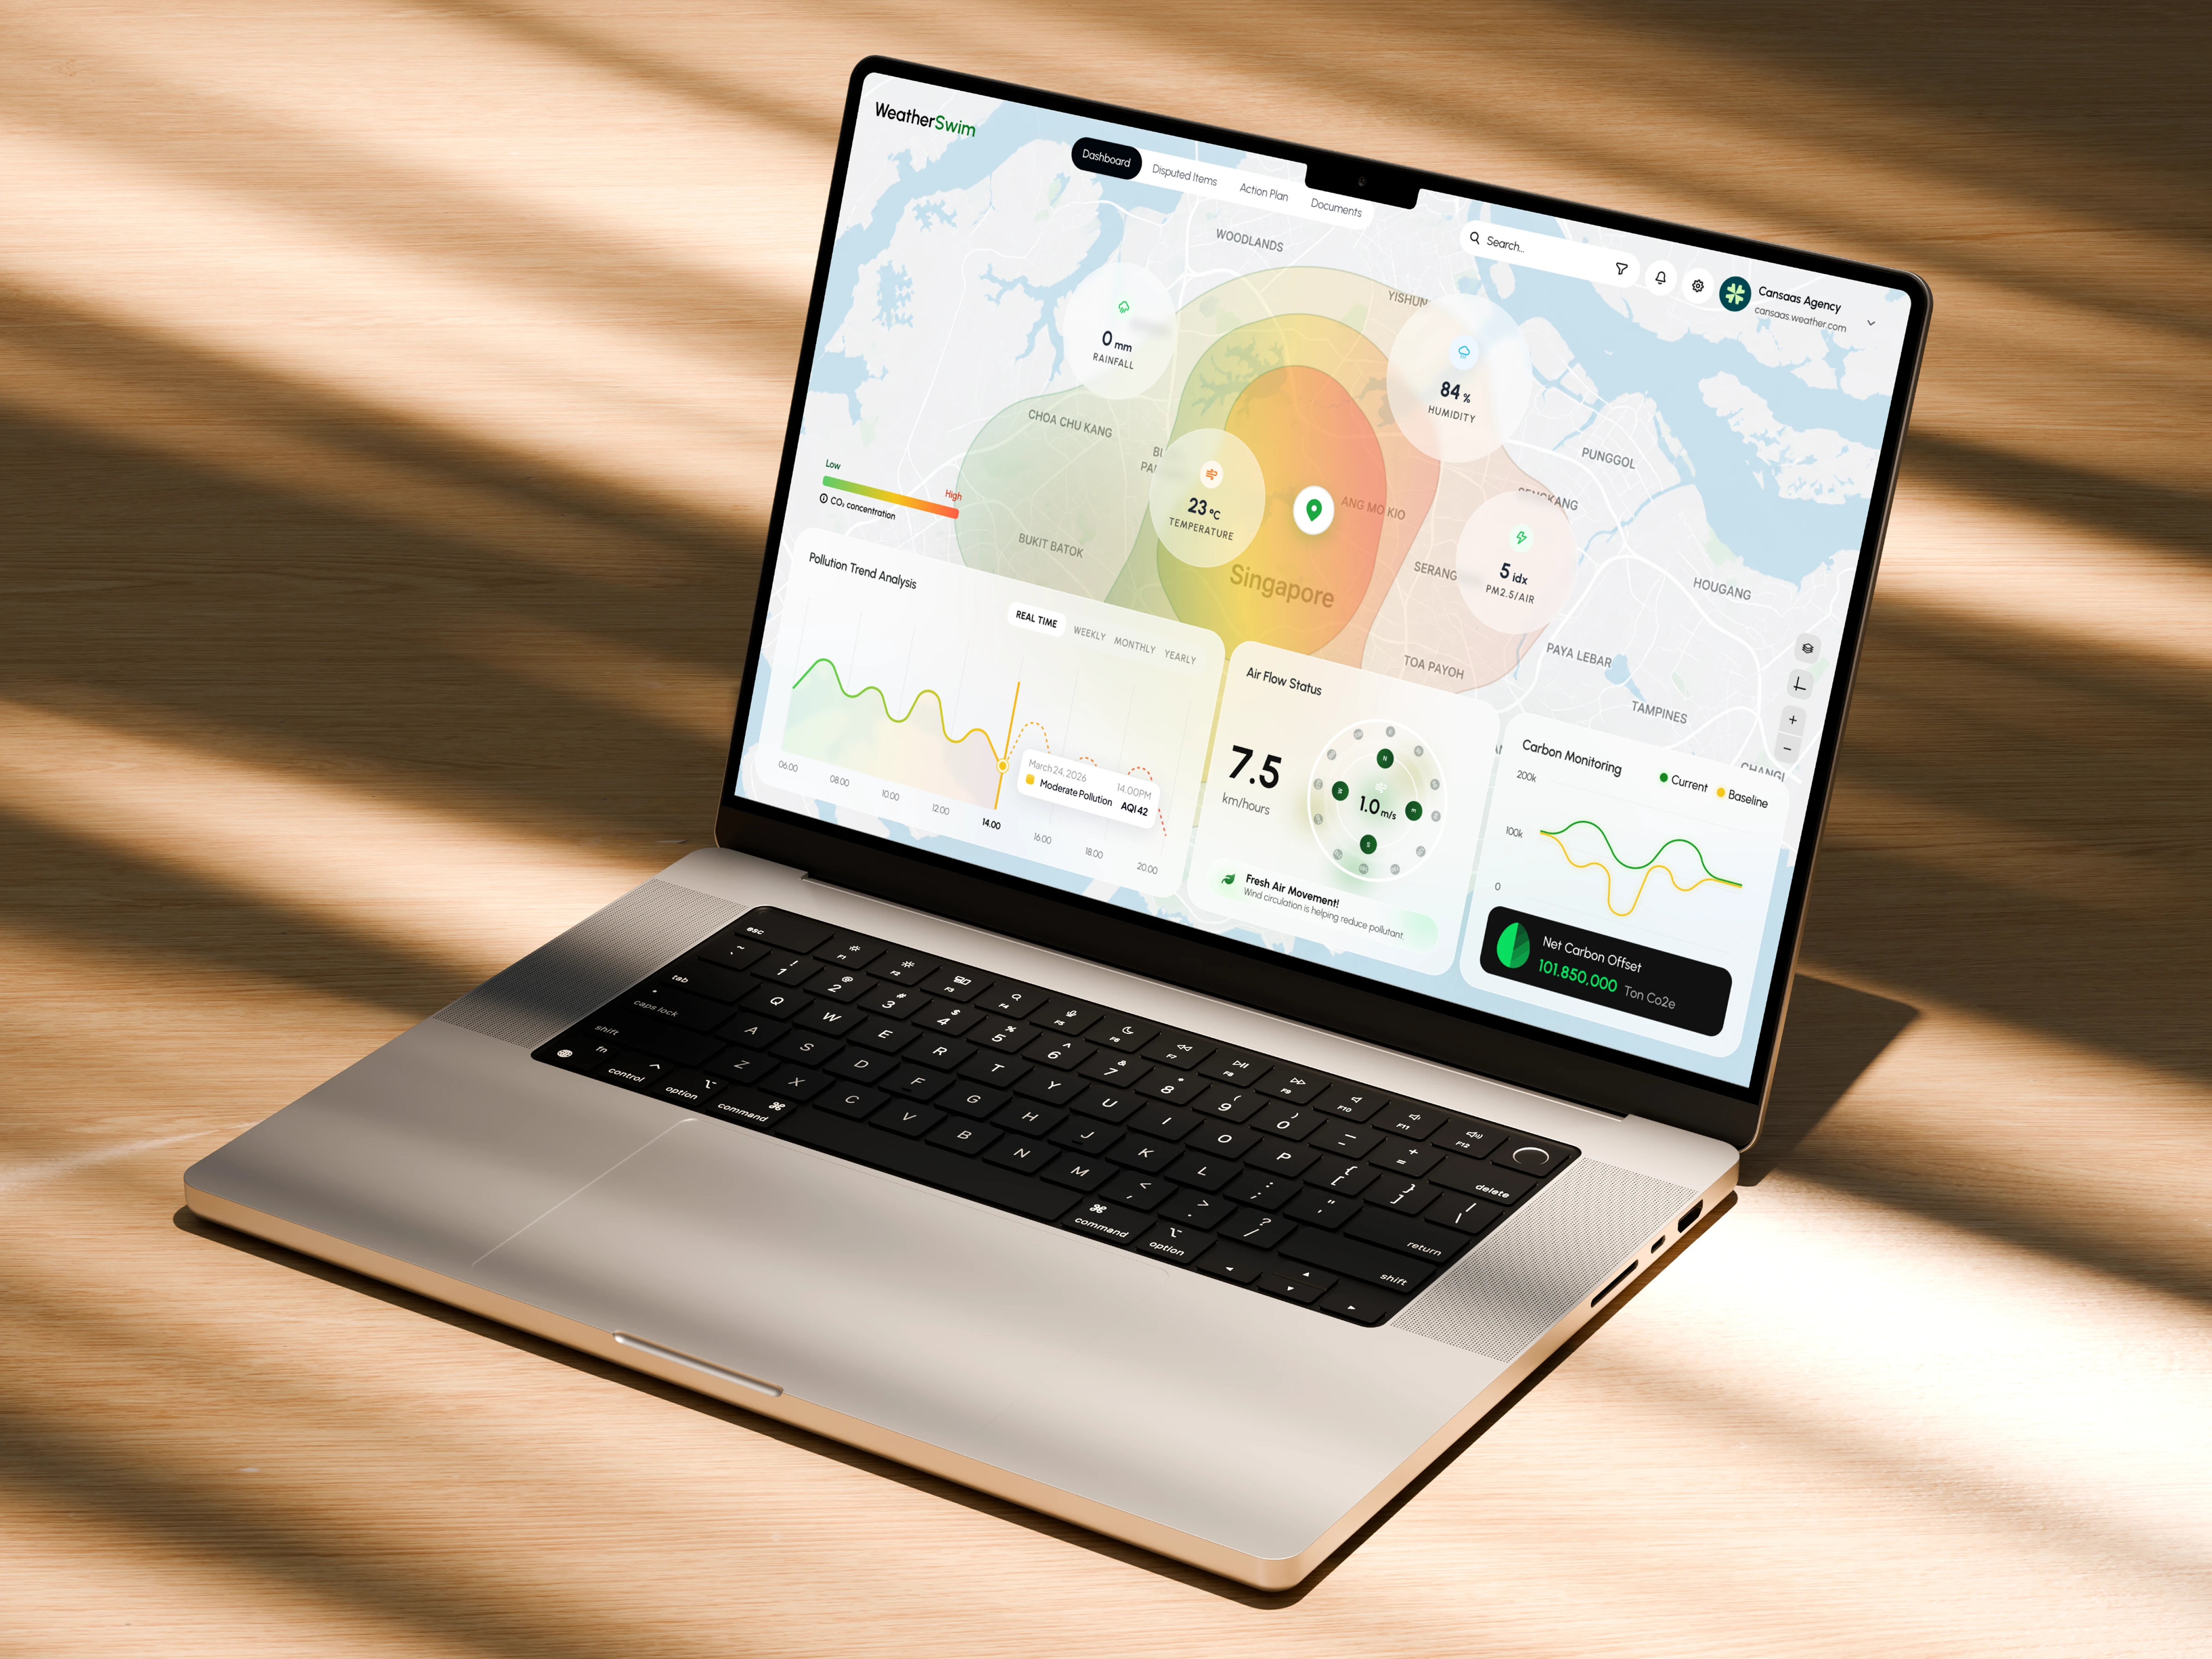
Overview
Environmental monitoring platforms often present large amounts of data that can be difficult to interpret quickly. For this concept, we designed a modern Air Monitoring Dashboard that transforms complex environmental information into clear, actionable insights. By combining geospatial visualization, real-time air quality metrics, carbon monitoring, pollution analysis, and weather-related indicators into a single interface, users can understand environmental conditions instantly and make informed decisions with confidence.
The Solution
We approached the design with a map-first experience, allowing users to immediately understand environmental conditions across different locations. Interactive heatmap overlays visually communicate pollution concentration levels, while contextual metric cards provide quick access to key indicators such as rainfall, humidity, temperature, PM2.5 levels, and airflow status.
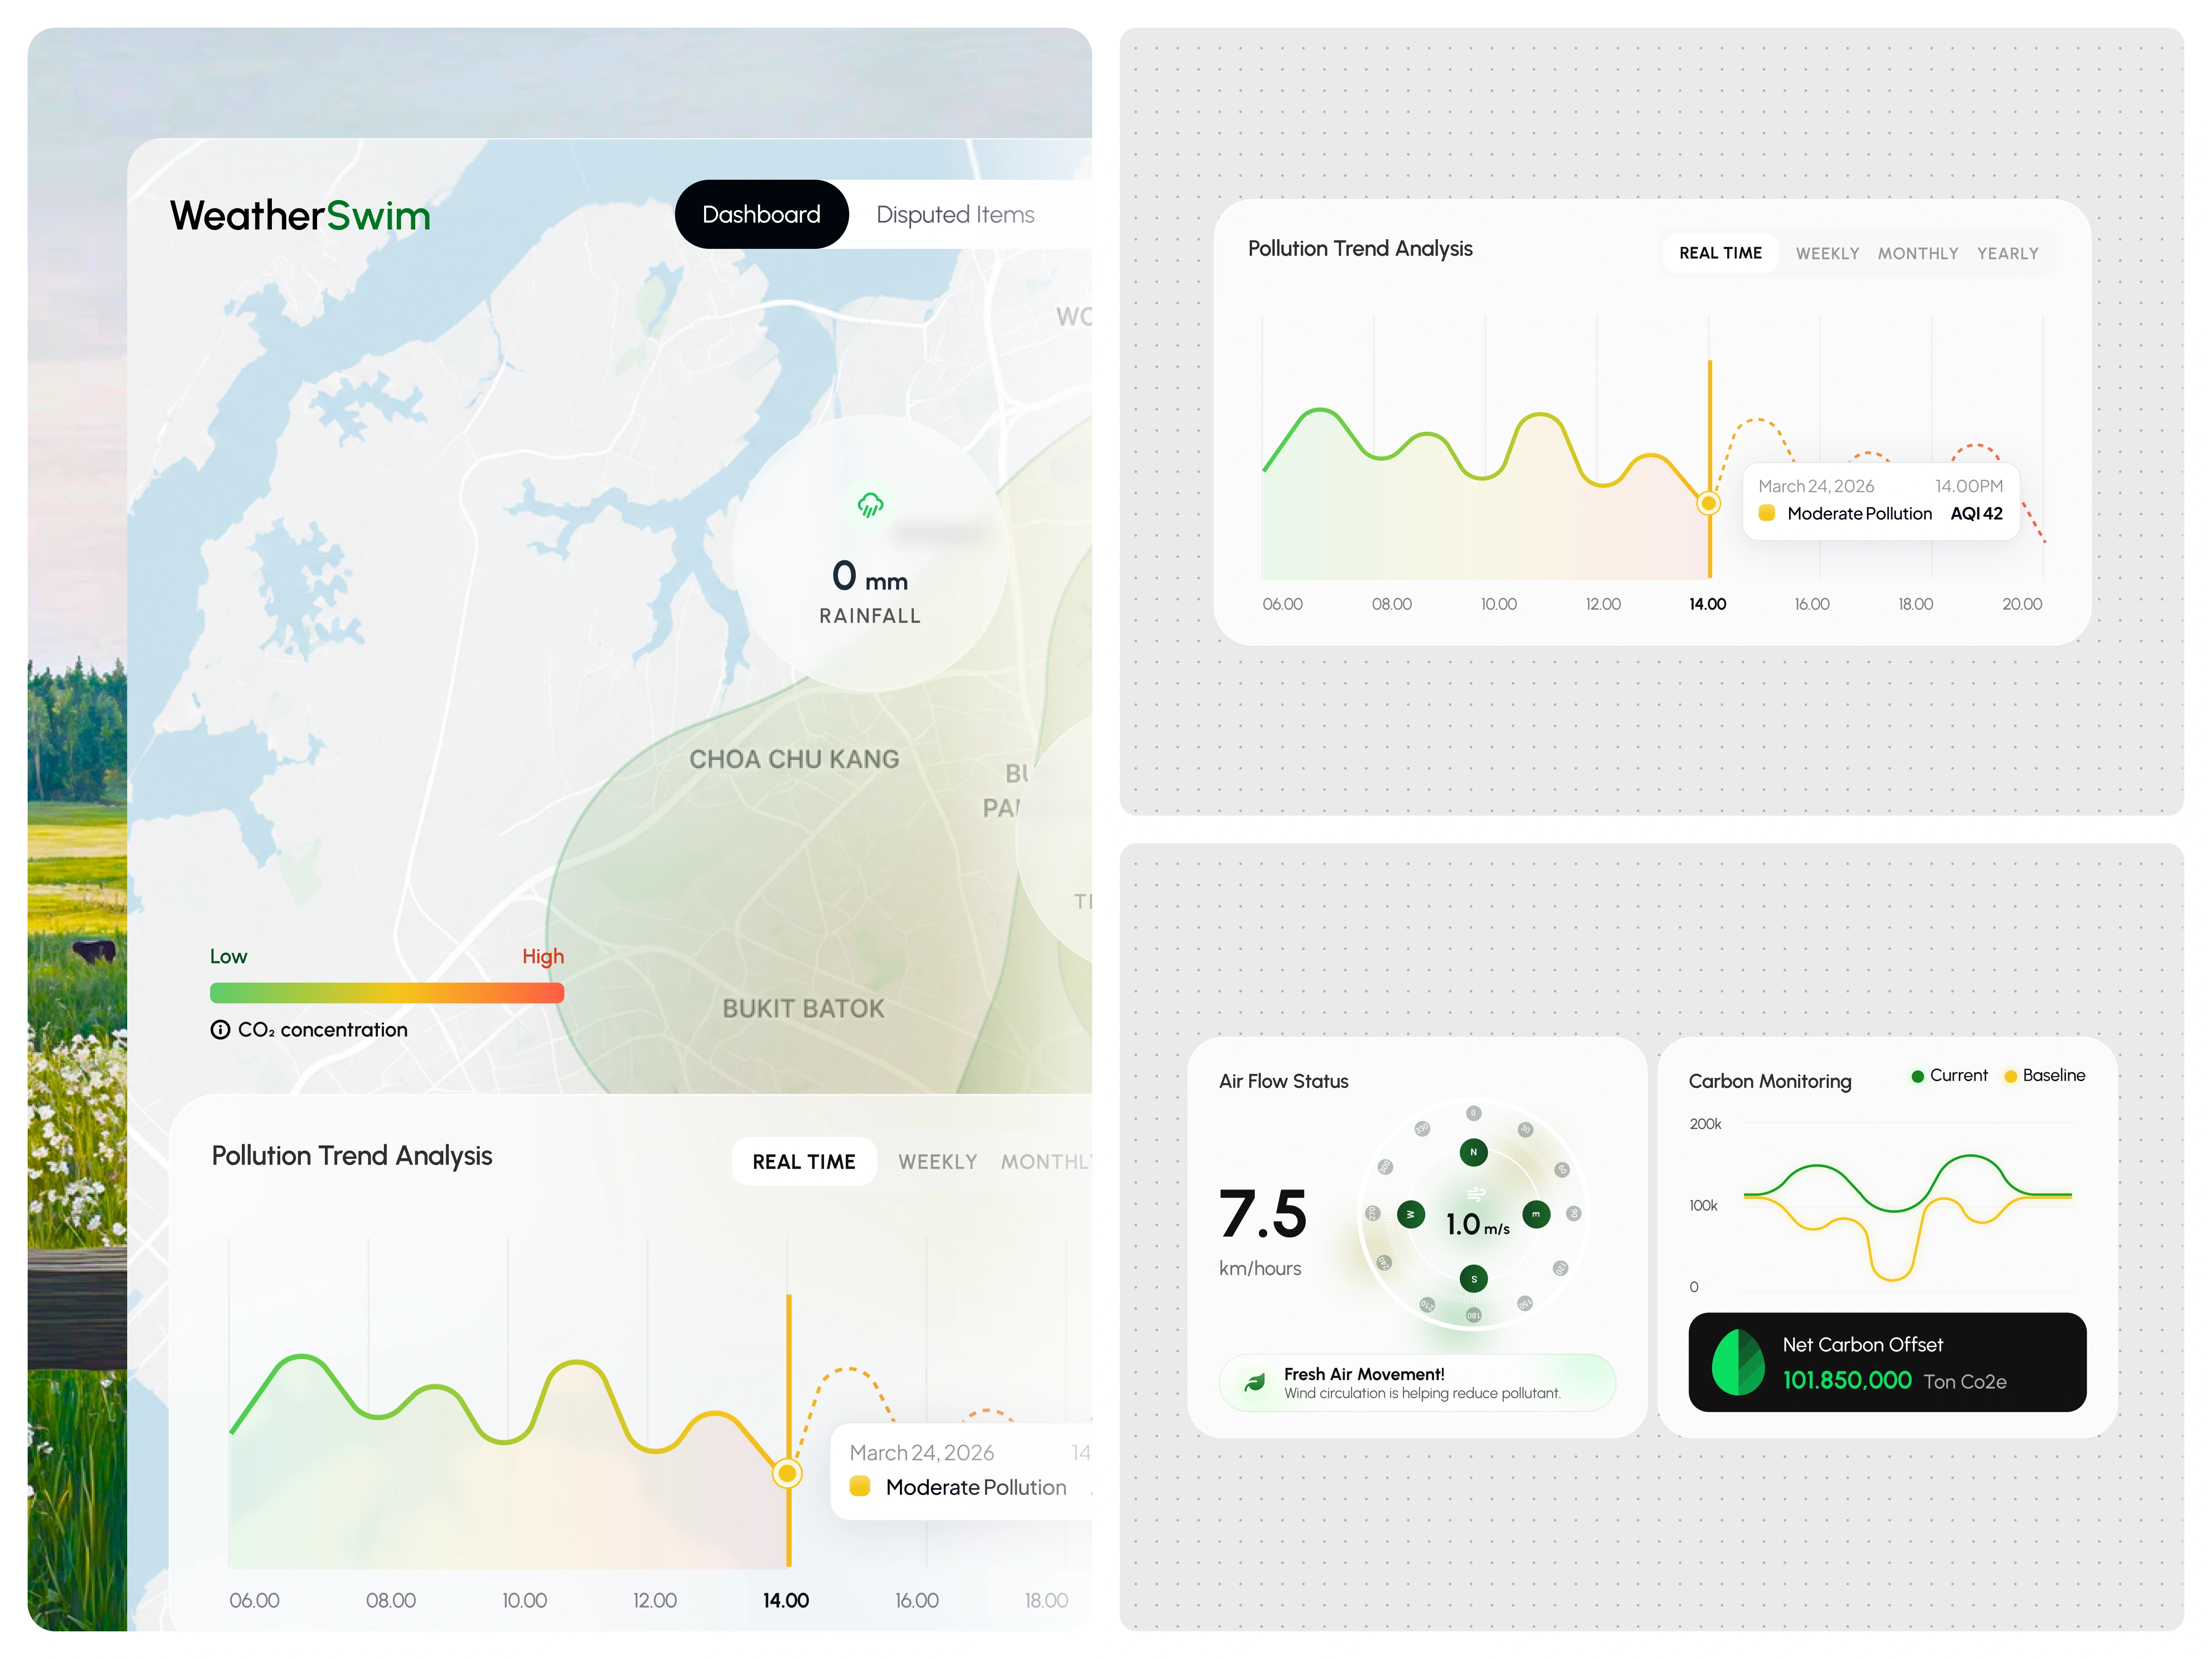
Supporting widgets like pollution trend analysis, carbon monitoring, and net carbon offset tracking help users move seamlessly from high-level monitoring to detailed environmental insights. This structure creates a balanced experience between exploration, analysis, and decision-making.
UX Strategy
The dashboard was designed around three core principles: clarity, context, and actionability.
Clarity is achieved through a clean layout, generous spacing, and a minimal visual language that reduces cognitive load. Context is provided through geospatial visualization and real-time environmental metrics that help users understand relationships between data points. Actionability comes from presenting insights in a format that supports faster environmental assessments, sustainability reporting, and operational decision-making.
Visual Design
The visual direction combines a soft neutral interface with environmental-inspired color accents. Green, yellow, and red gradients are used strategically to communicate air quality conditions and pollution intensity without relying heavily on text explanations.
Large metric cards, smooth data visualizations, and subtle depth effects create a modern dashboard experience while maintaining readability. The combination of maps, charts, gauges, and monitoring widgets helps establish a strong visual hierarchy that guides attention toward the most important information first.
Outcome
The result is a scalable Air Monitoring Dashboard UI that makes environmental intelligence more accessible, understandable, and actionable. By integrating real-time monitoring, carbon analytics, pollution tracking, and geospatial insights into a unified platform, the dashboard enables organizations to monitor environmental conditions more effectively while supporting sustainability initiatives and data-driven decision-making.
Like this project
Posted Jun 5, 2026
Designed an Air Monitoring Dashboard for clear environmental insights.
Likes
2
Views
13