
1 like · 9 views · Aug 3, 2025
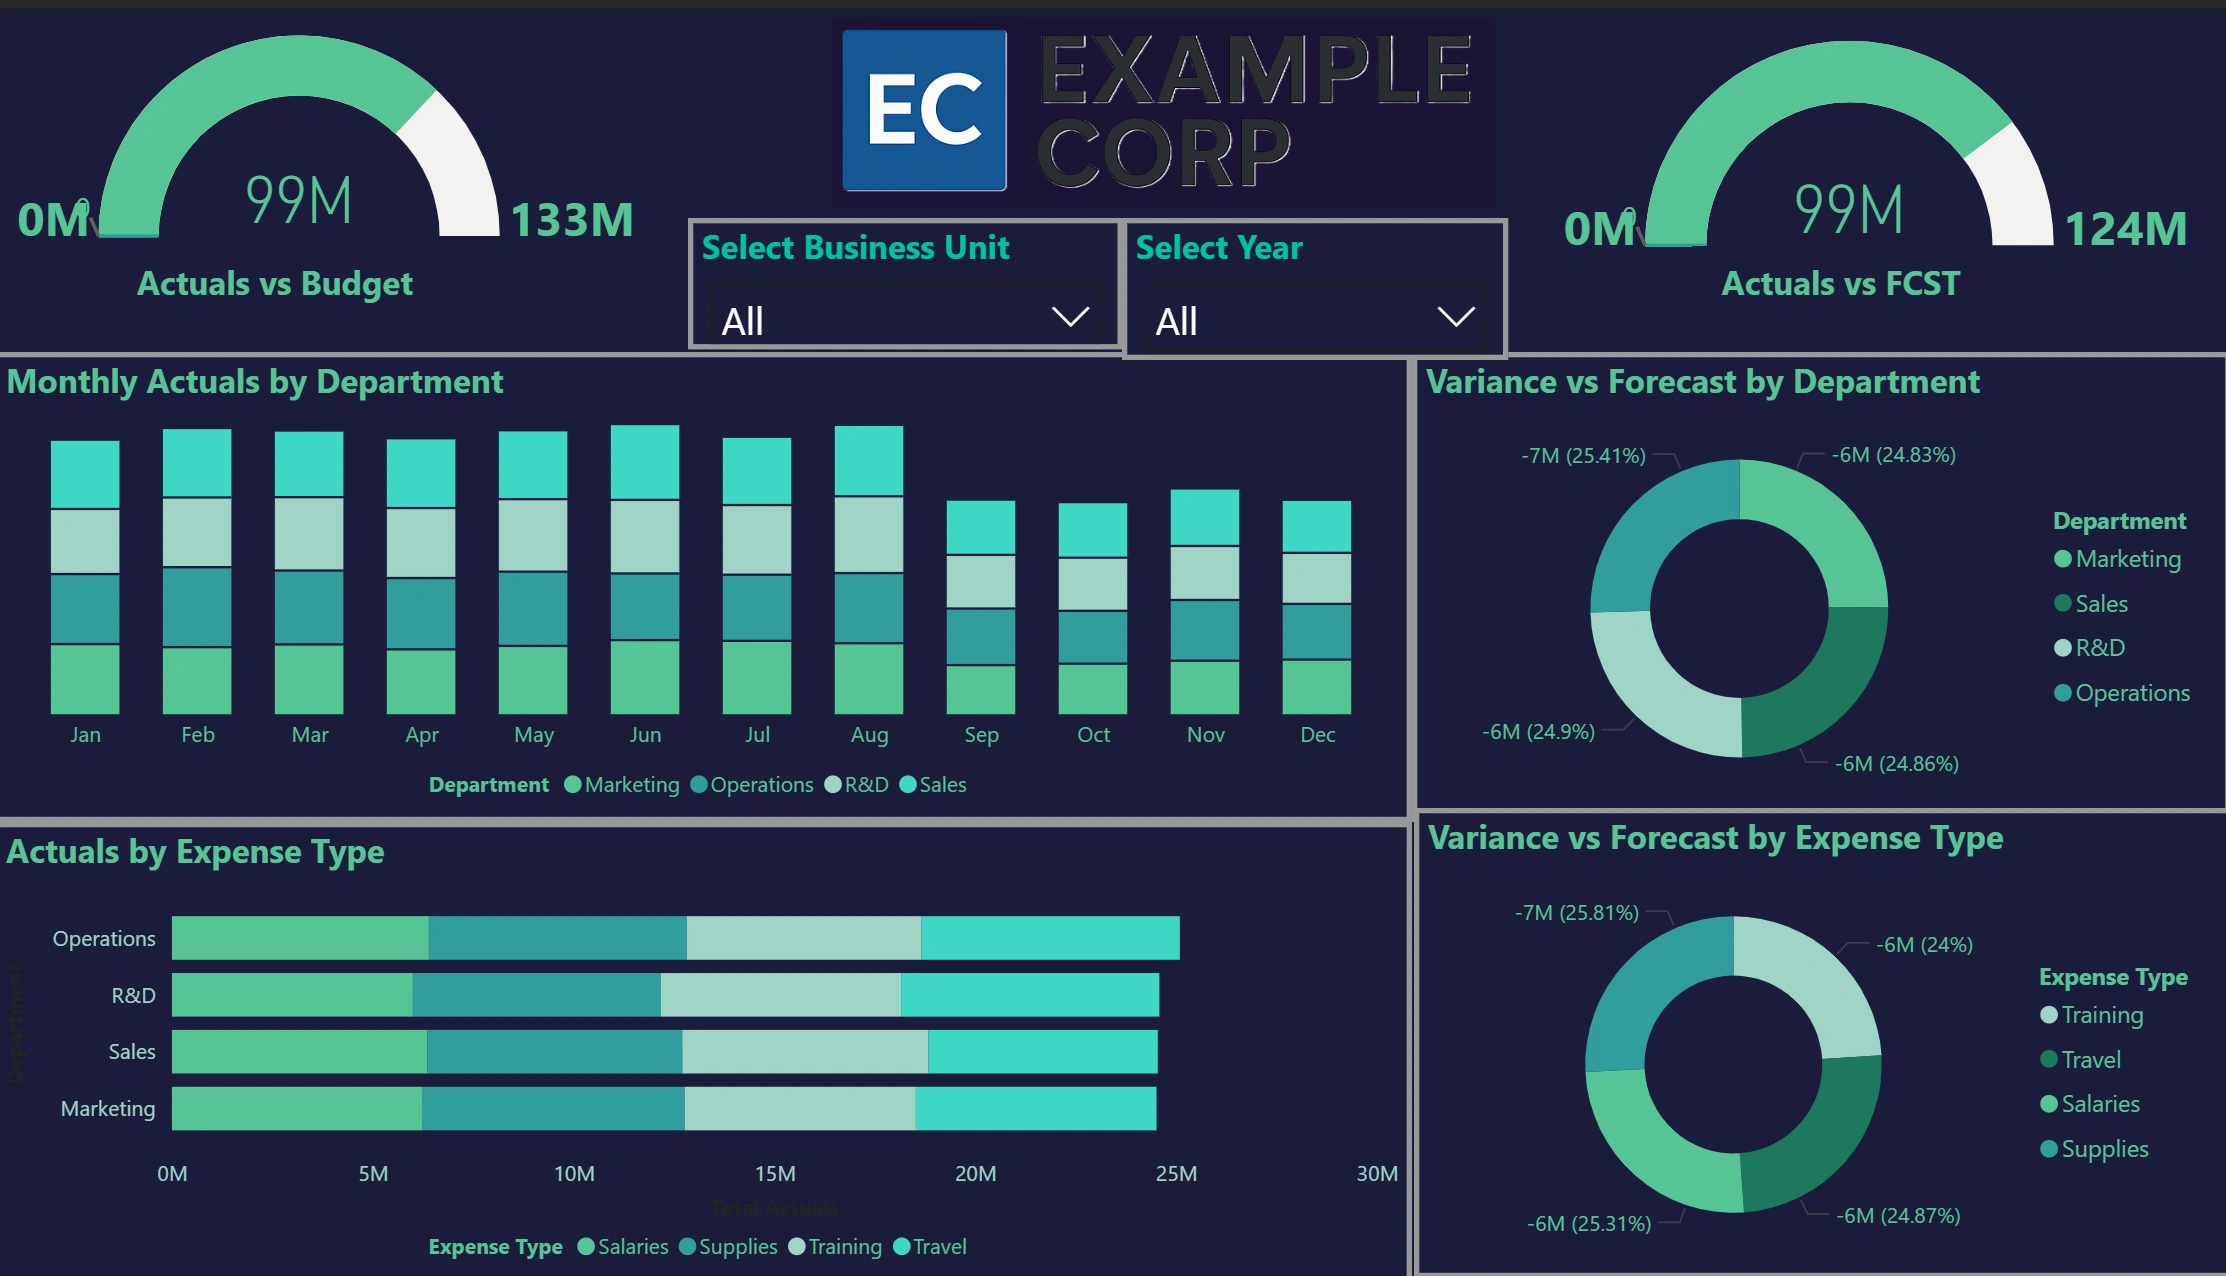
Designed an interactive Power BI report with slicers, gauges, and variance visuals to support leadership decision-making across business units.
Timeline
Aug 1, 2025 - Aug 3, 2025
1 like · 9 views · Aug 3, 2025
Designed an interactive Power BI report with slicers, gauges, and variance visuals to support leadership decision-making across business units.
Aug 1, 2025 - Aug 3, 2025


