Financial Dashboard
Sancharini Basak
Overview 🔎
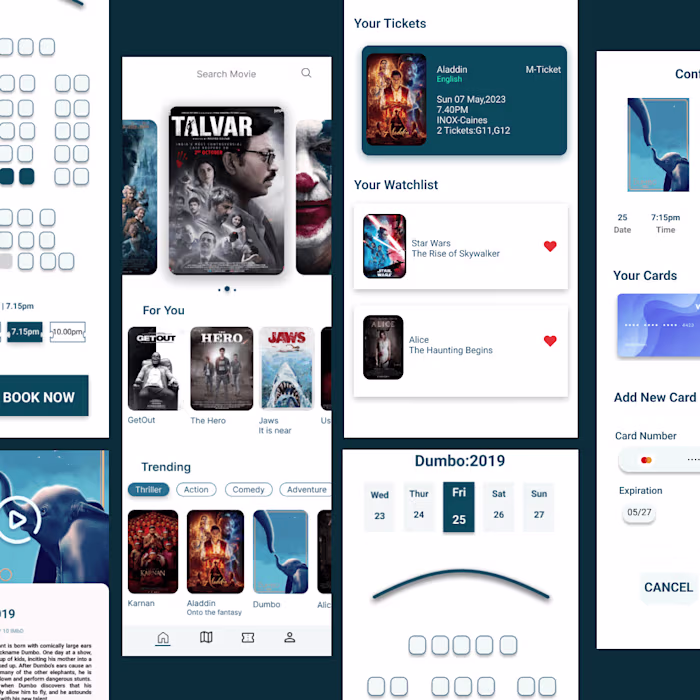
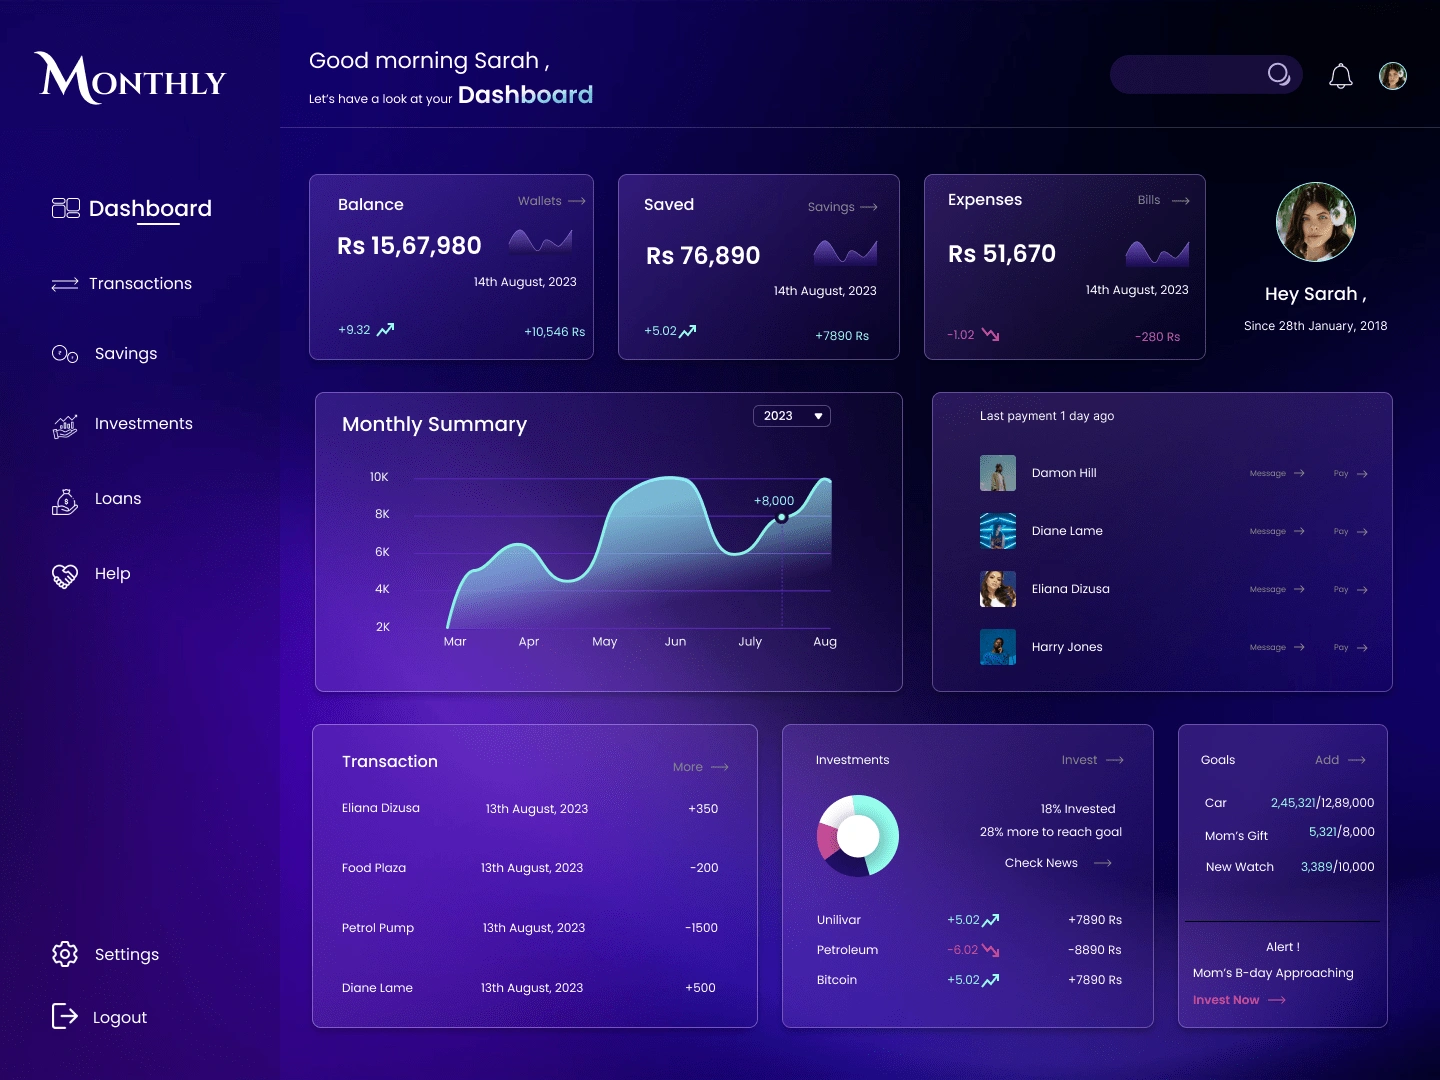
This is a data analytics dashboard for a financial application.
Problem & Solution 🤝
In today's fast-paced world, people look out for a proper management system for their financial statement. This dashboard designs targets these audiences and provide an interactive design to help then get a brief summary of the financial positions and goals.
Goals/Requirements:
• Provide a successful summary of the financial statements of the users.
• Reminder of financial goals.
• Visualization through graphs and eye-catching colours.
Process 🛣
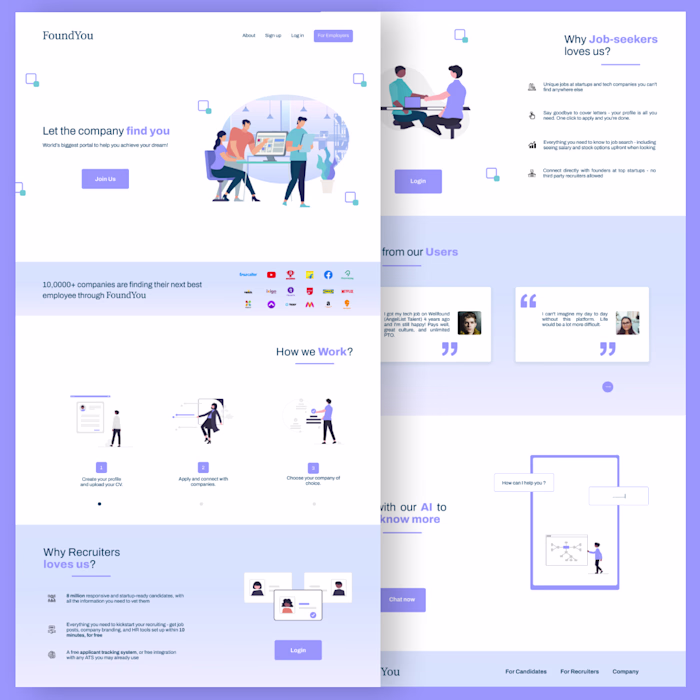
To make this project successfully, I researched about the various users and made a low-fidelity prototype. After doing the proper user reseach and understanding their pain-points I went on with the design and created the dashboard.
Results 🎁
Successfully completed the project.
Really convenient to understand the user flow. 🗣
Name
Sayantina
Takeaways 📣
Learned a lot about colours and proper arrangements of designs.
Like this project
Posted Aug 18, 2023
Sancharini Basak | I am a fast-learner with an interest in the field of Graphic Designing and UI-UX design. I am skilled in Figma,Adobe Photoshop , Adobe XD an…
Likes
0
Views
20