Foodstuffs Grocery Sales Analysis Dashboard
Devinder Kaur
Foodstuffs Grocery Sales Analysis
Power BI Dashboard | Power Query | DAX | Data Visualisation
Project Objective
To analyze grocery sales data from multiple outlets to uncover patterns in product performance, outlet efficiency, and consumer preferences. The goal is to deliver actionable insights for inventory planning, pricing optimization, and outlet-level strategy ultimately improving profitability and customer satisfaction for Foodstuff.
Business Questions Answered
Which product types and fat content categories generate the most sales?
How does outlet type and location tier affect revenue?
Does outlet age correlate with sales performance?
What is the impact of item visibility on sales?
Does a higher price (MRP) guarantee higher sales?
Key Metrics
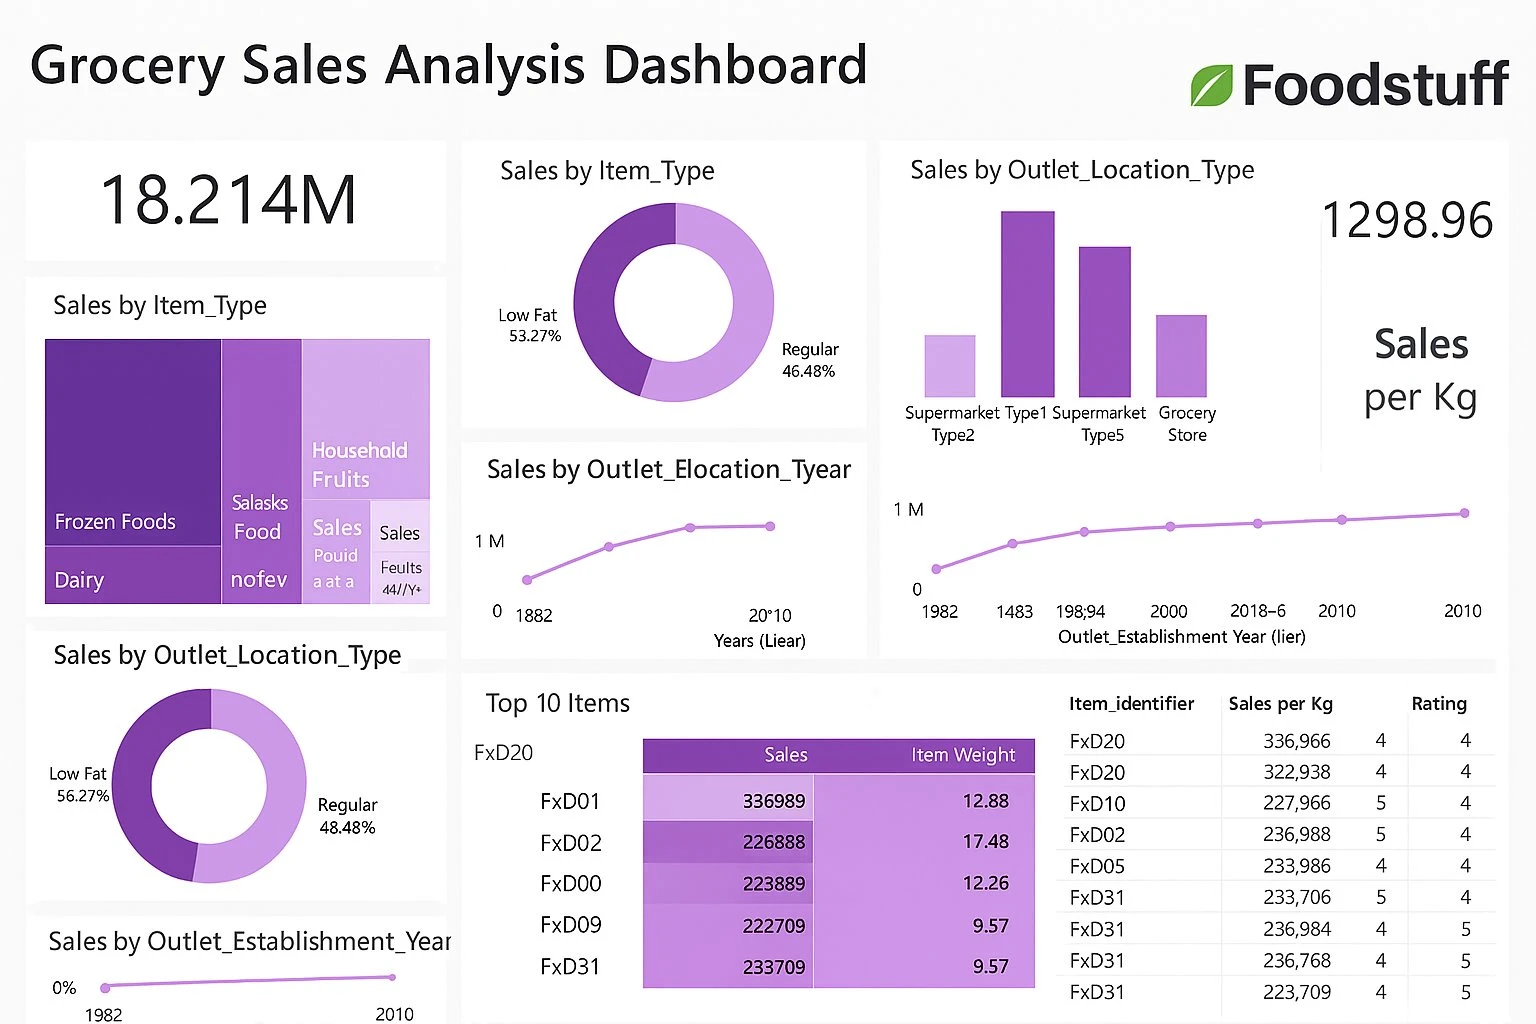
Metric Value Total Sales $18.214M Sales per Kg 1,298.96 Low Fat Sales Share 53.27% Top Performing Item FxD01 ($336,989)
Key Findings
Low Fat products dominate sales (53.27%), especially in Tier 1 locations
Supermarket Type 1 outlets generate the highest revenue, but Type 3 has better sales per item
Outlet age positively correlates with sales older outlets consistently perform better
Item visibility has a strong impact on sales; products with more than 10% visibility outperform others
High MRP does not guarantee high sales price sensitivity varies by item type and outlet location
Strategic Value
This dashboard empowers Foodstuffs to:
Optimize product placement and visibility across outlets
Tailor pricing strategies by outlet type and region
Identify underperforming items for promotion or removal
Prioritize investment in high-performing outlet formats
Methodology
1. Data Extraction & Cleaning
Tools: Microsoft Excel, Power BI Power Query Editor
Imported raw CSV from Kaggle into Power BI
Removed nulls in Item Weight
Standardized Item Fat Content (unified "Low Fat", "low fat", "LF" into one category)
Trimmed and cleaned all text fields
Changed data types (e.g. Outlet Establishment Date to whole number)
Created new column:
Outlet Age = 2025 - [Outlet Establishment Year]2. Data Modeling
Built a star schema for optimized performance
Created relationships between:
Item attributes and outlet attributes
Fact table (sales) and dimension tables (item, outlet)
3. DAX Measures & Calculated Columns
Key Measures:
Calculated Columns:
4. Visualization
Visual What It Shows KPI Cards Total Sales, Sales per Kg Tree Map Sales by Item Type Donut Chart Sales by Fat Content Bar Chart Sales by Outlet Type Line Chart Sales by Outlet Establishment Year Bubble Chart Sales vs Visibility Table Top 10 Items with Weight and Rating
Tools & Technologies
Tool Purpose Power BI Desktop Dashboard design and visualisation Power Query Data cleaning and transformation DAX Calculated measures and columns Microsoft Excel Initial data inspection and formatting Kaggle Data source
Like this project
Posted Jun 25, 2026
Created a Power BI dashboard for analyzing grocery sales data for Foodstuff.