
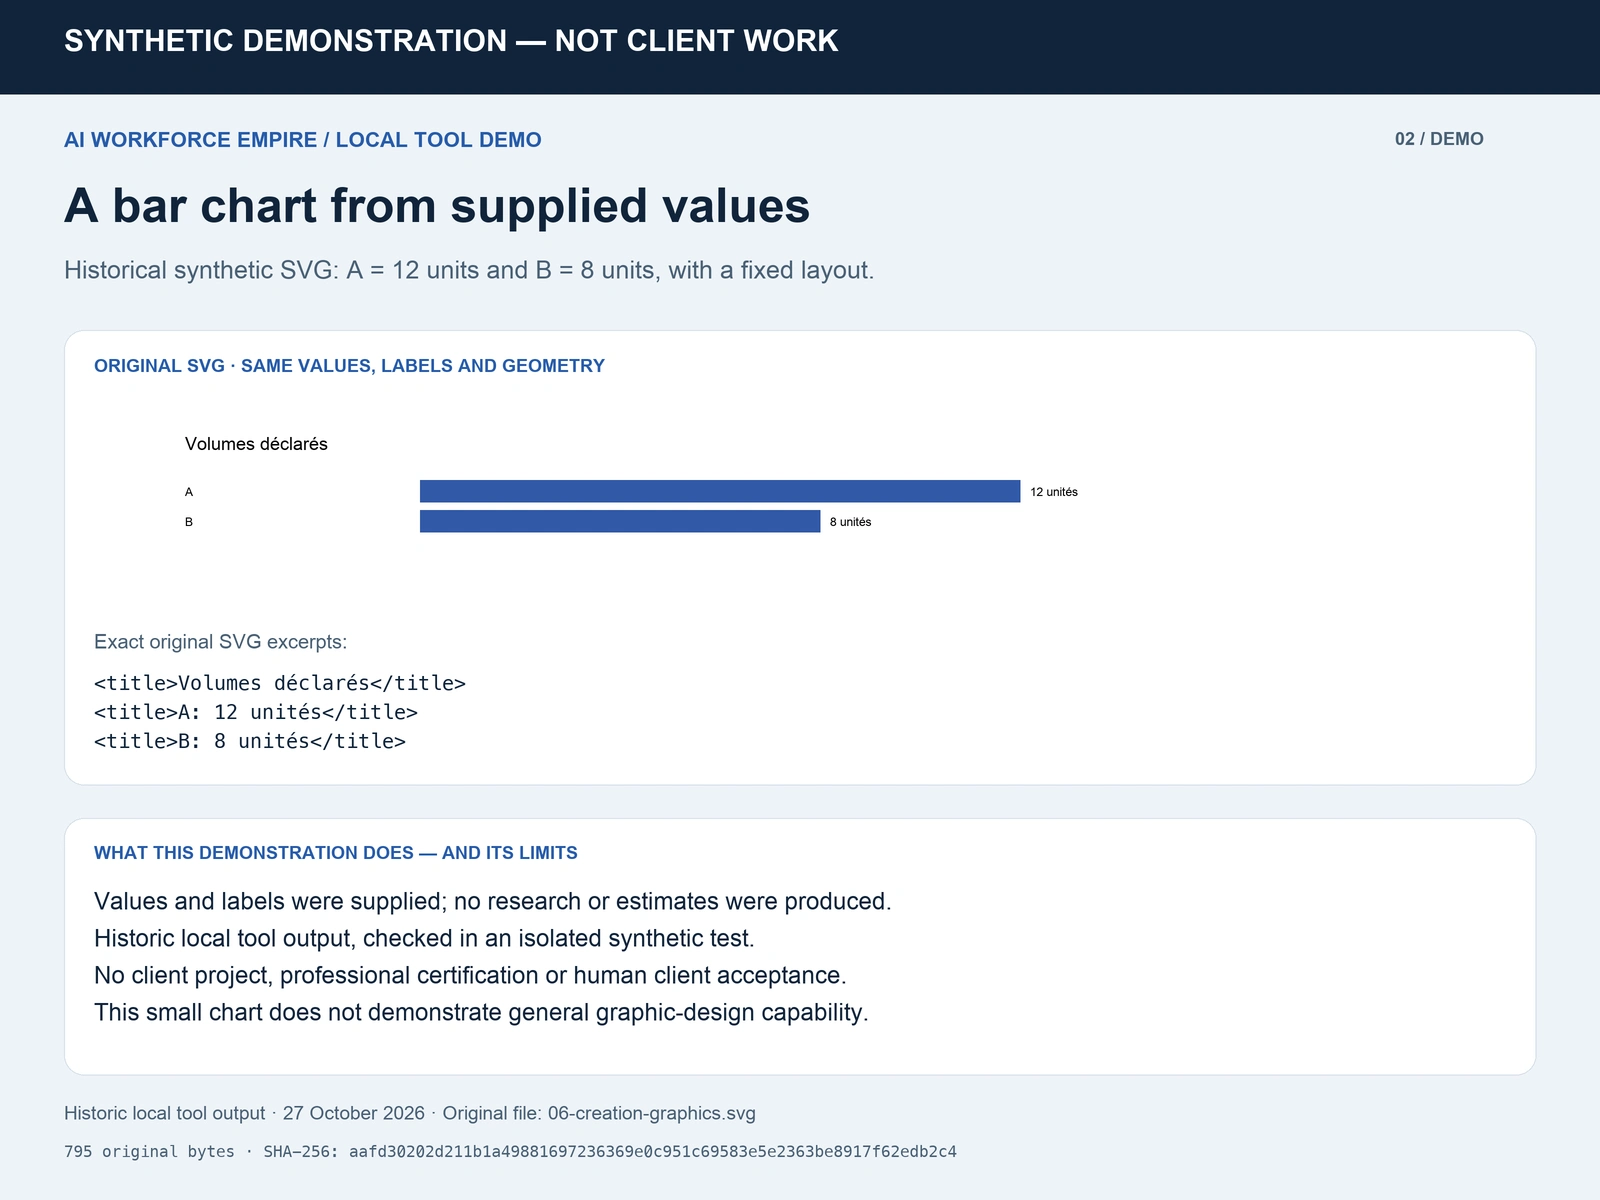
Synthetic demonstration of a local bar-chart tool. The supplied values A=12 and B=8 are rendered as SVG. This is a historical isolated tool output, not client work, data collection or a general design service.
0 likes · 1 view · Nov 3, 2026
Synthetic demonstration of a local bar-chart tool. The supplied values A=12 and B=8 are rendered as SVG. This is a historical isolated tool output, not clien...
