Financial Data Visualization

Dhika Endi Astowo

0

UI Designer

UX Designer

Visual System Designer

Figma

FinTech

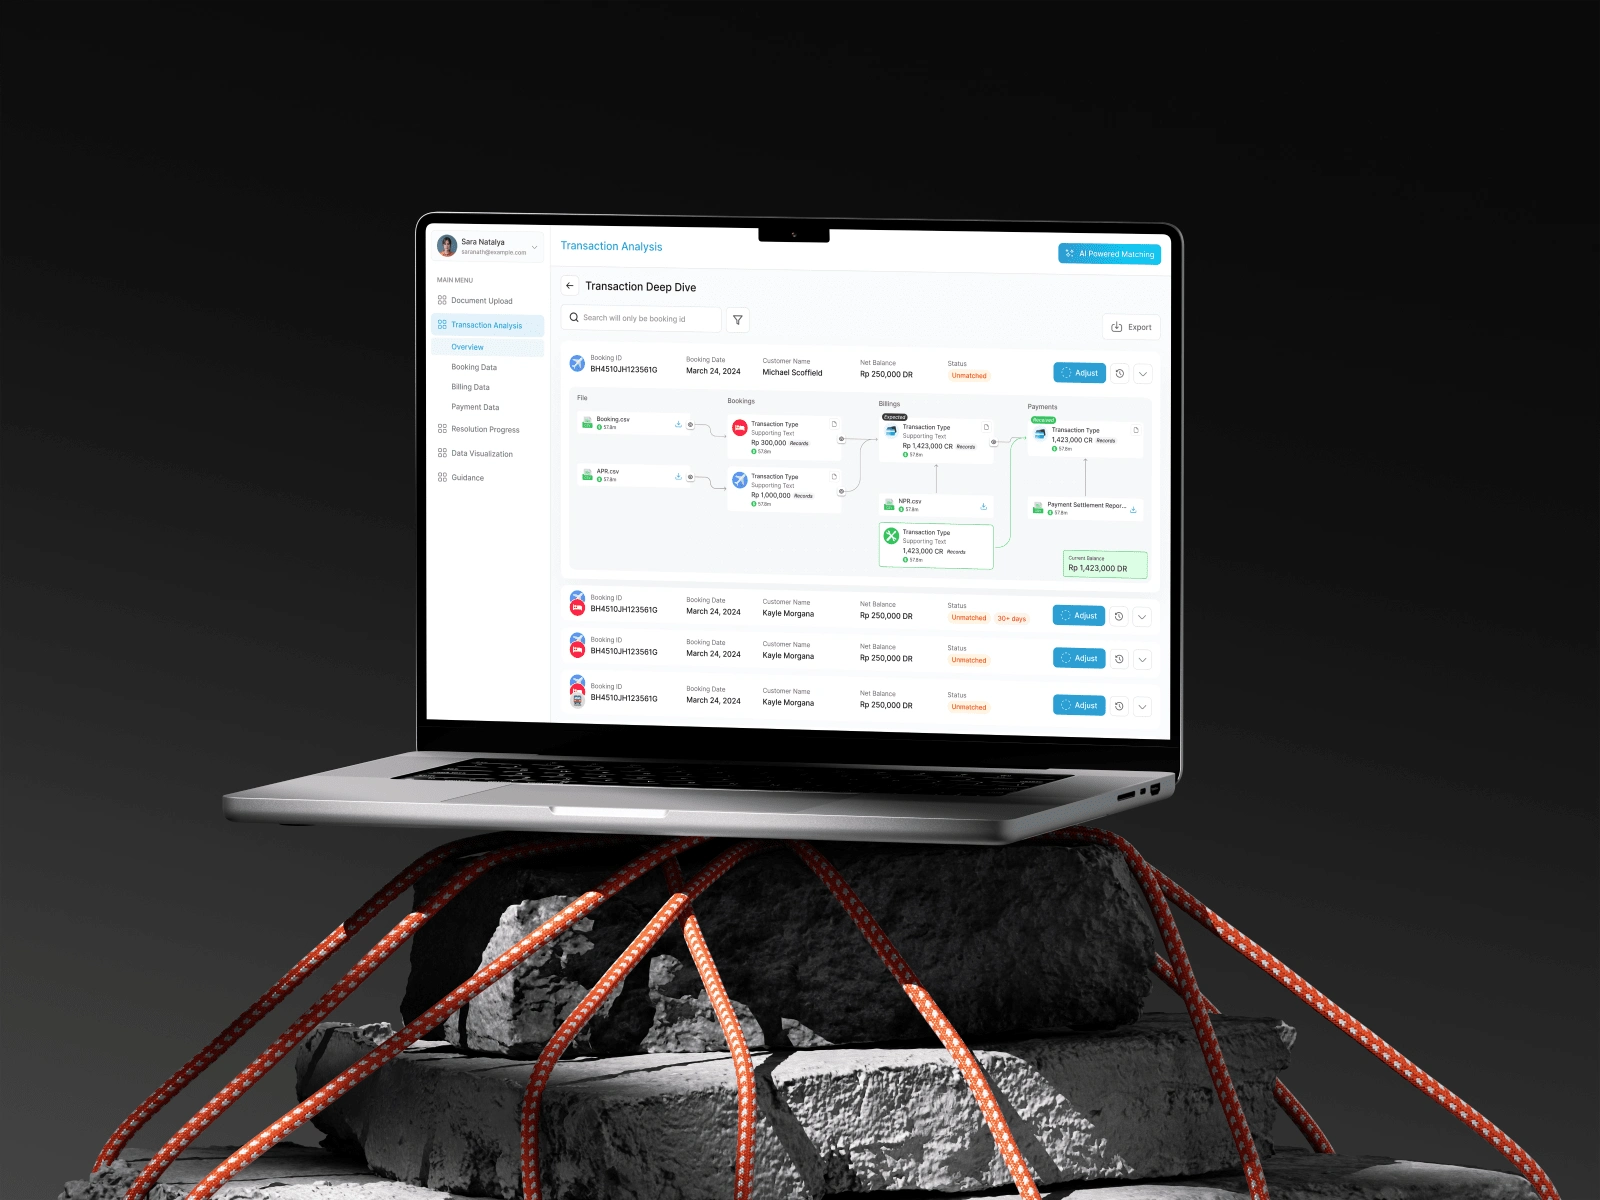
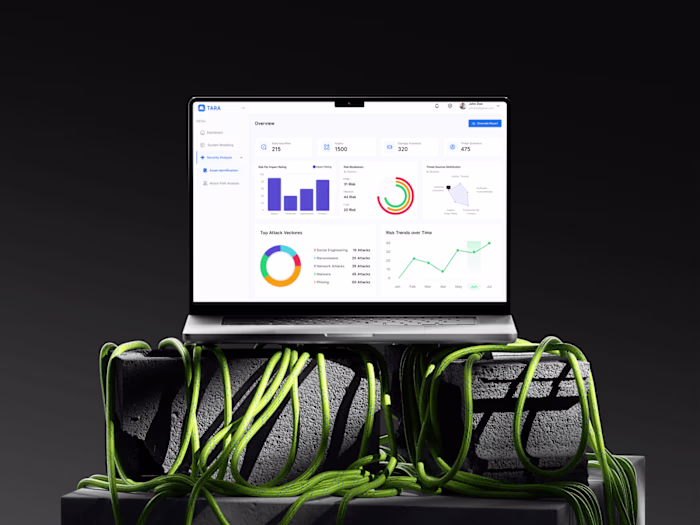
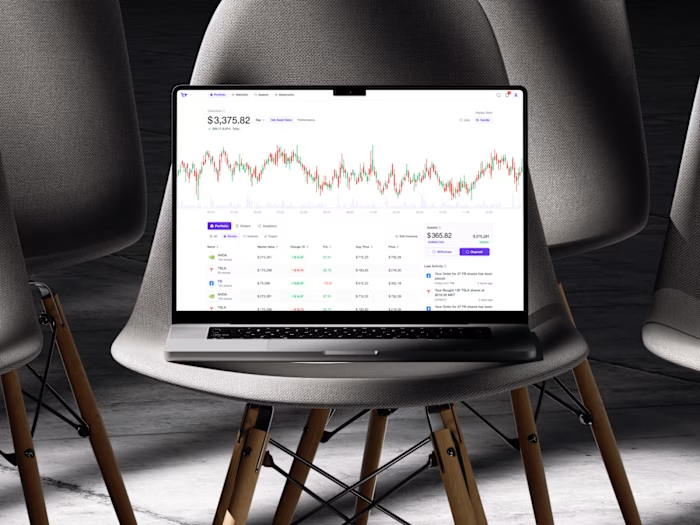
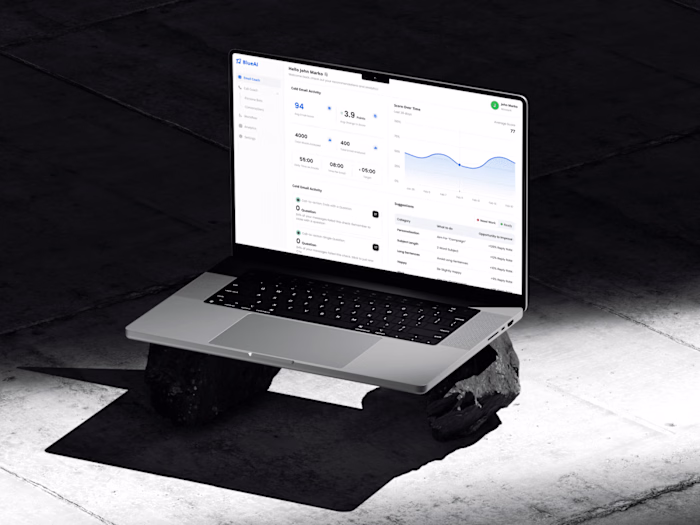
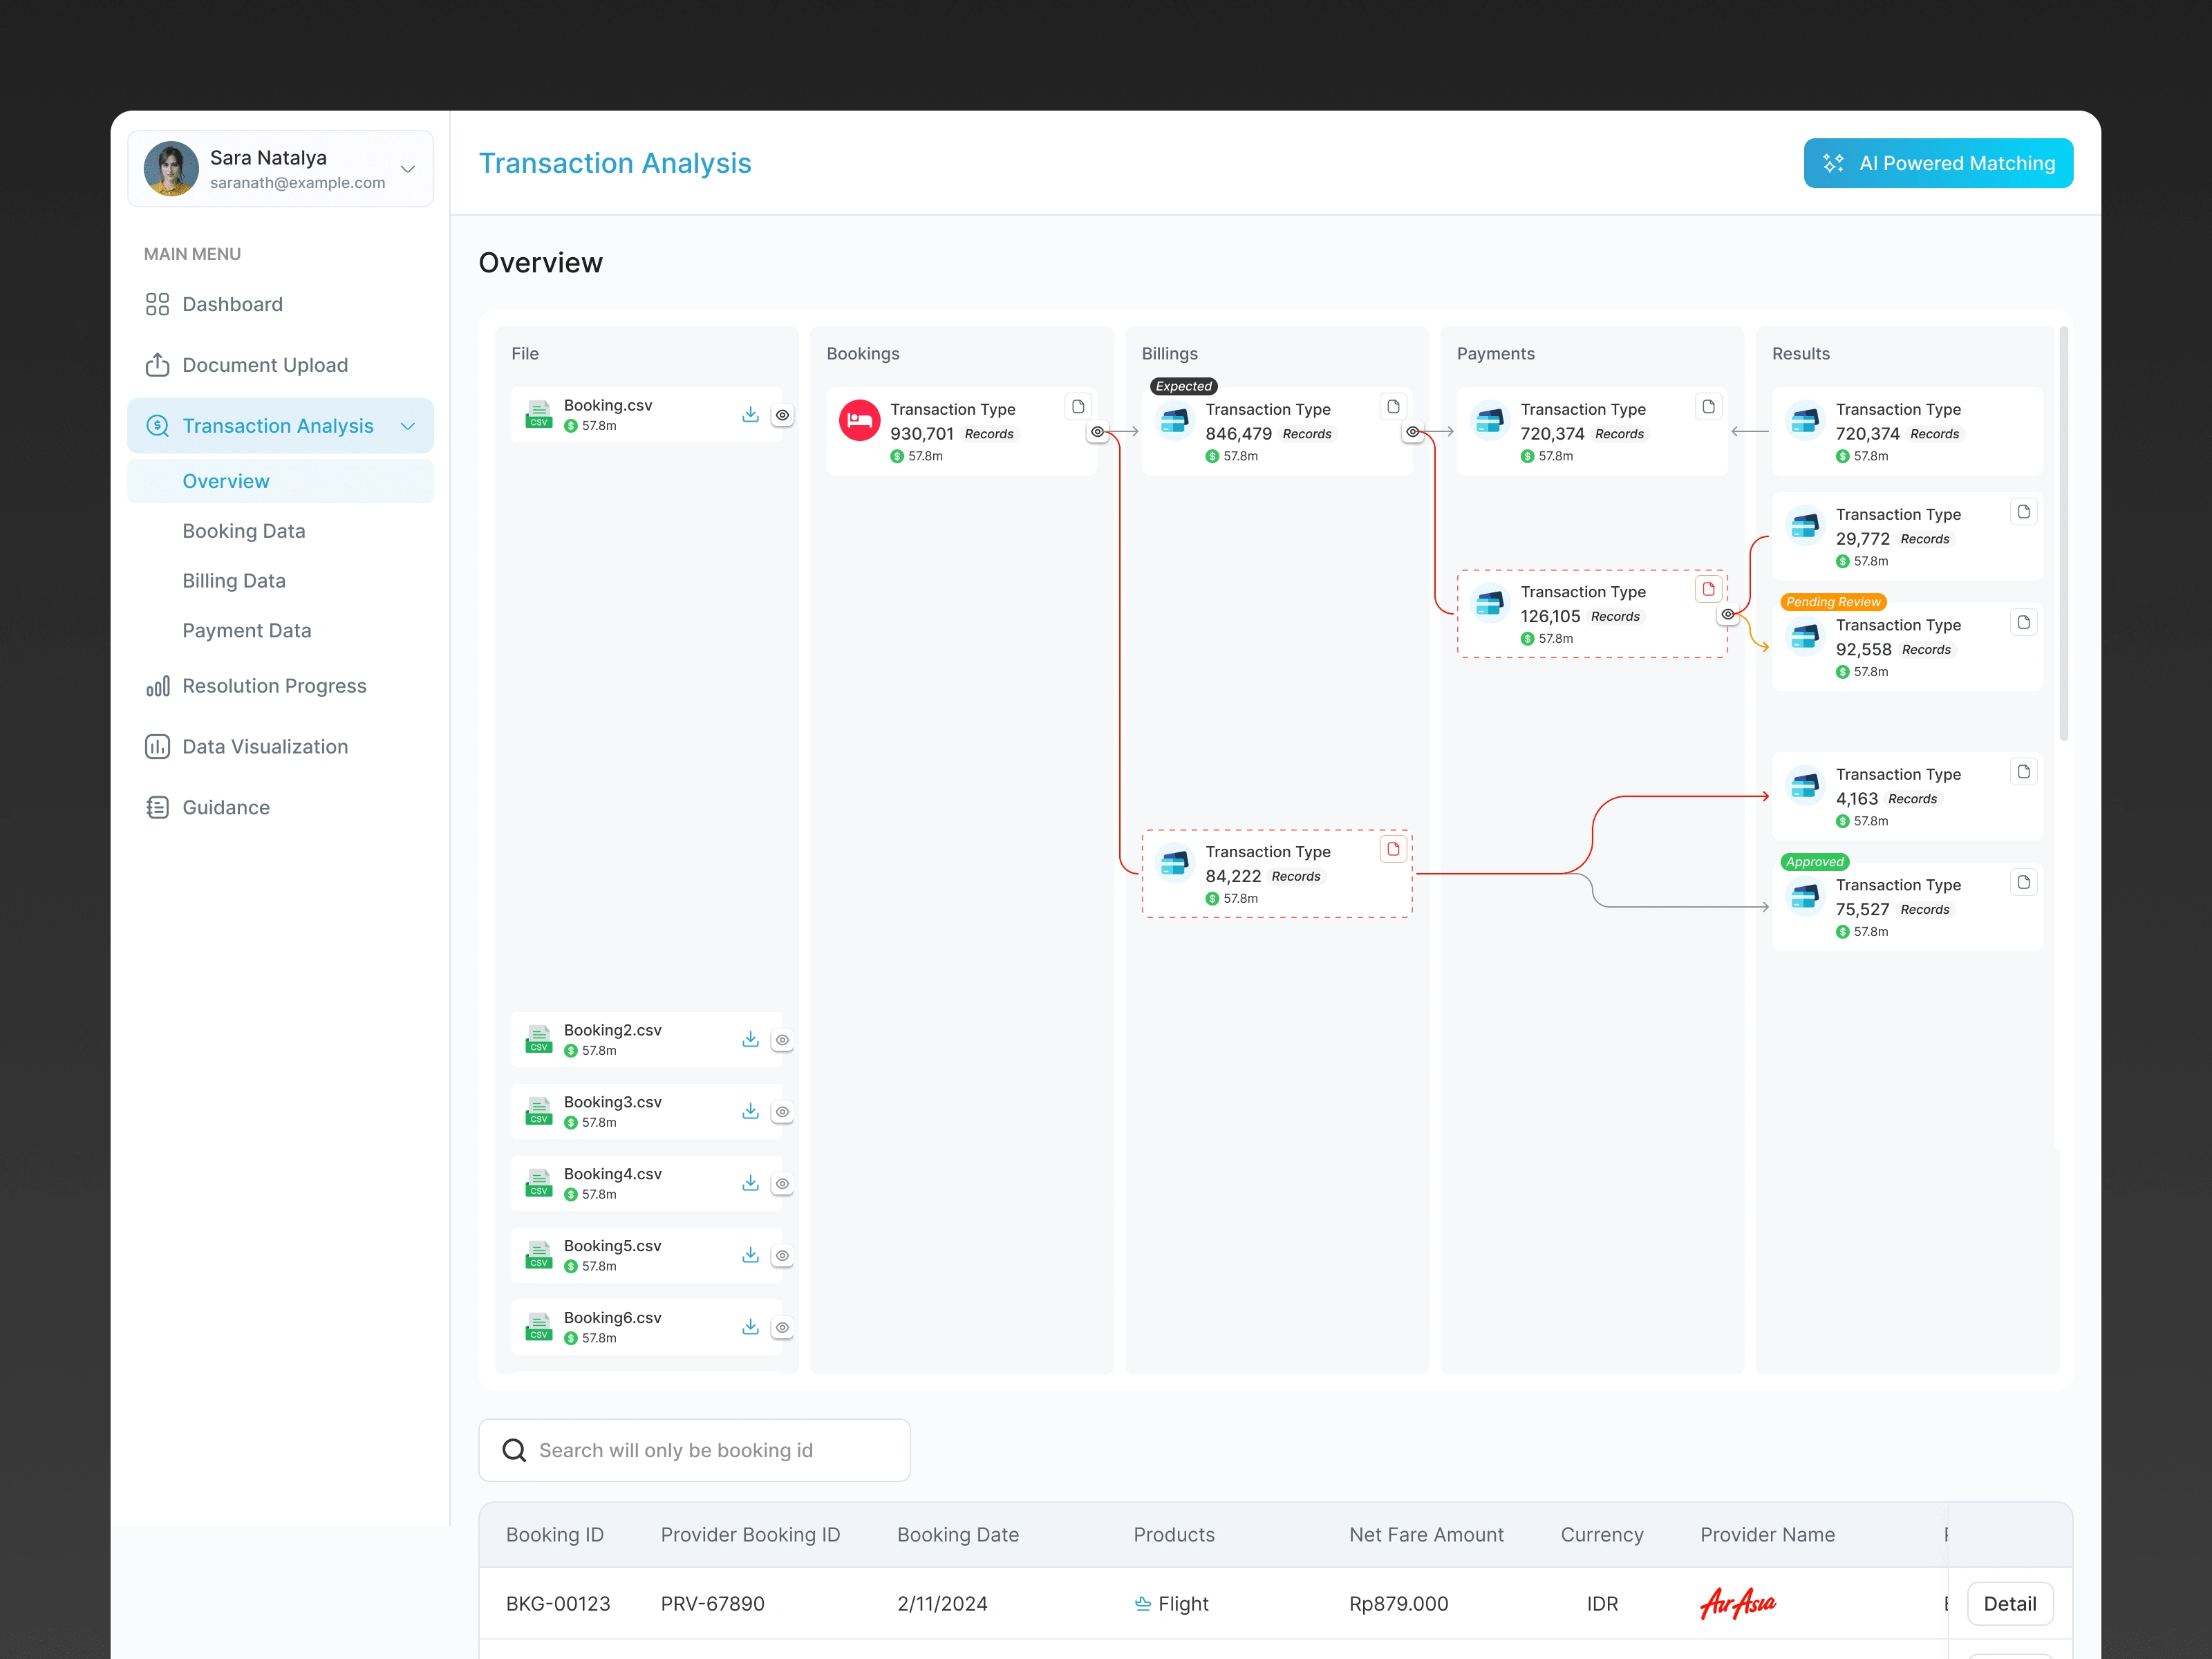
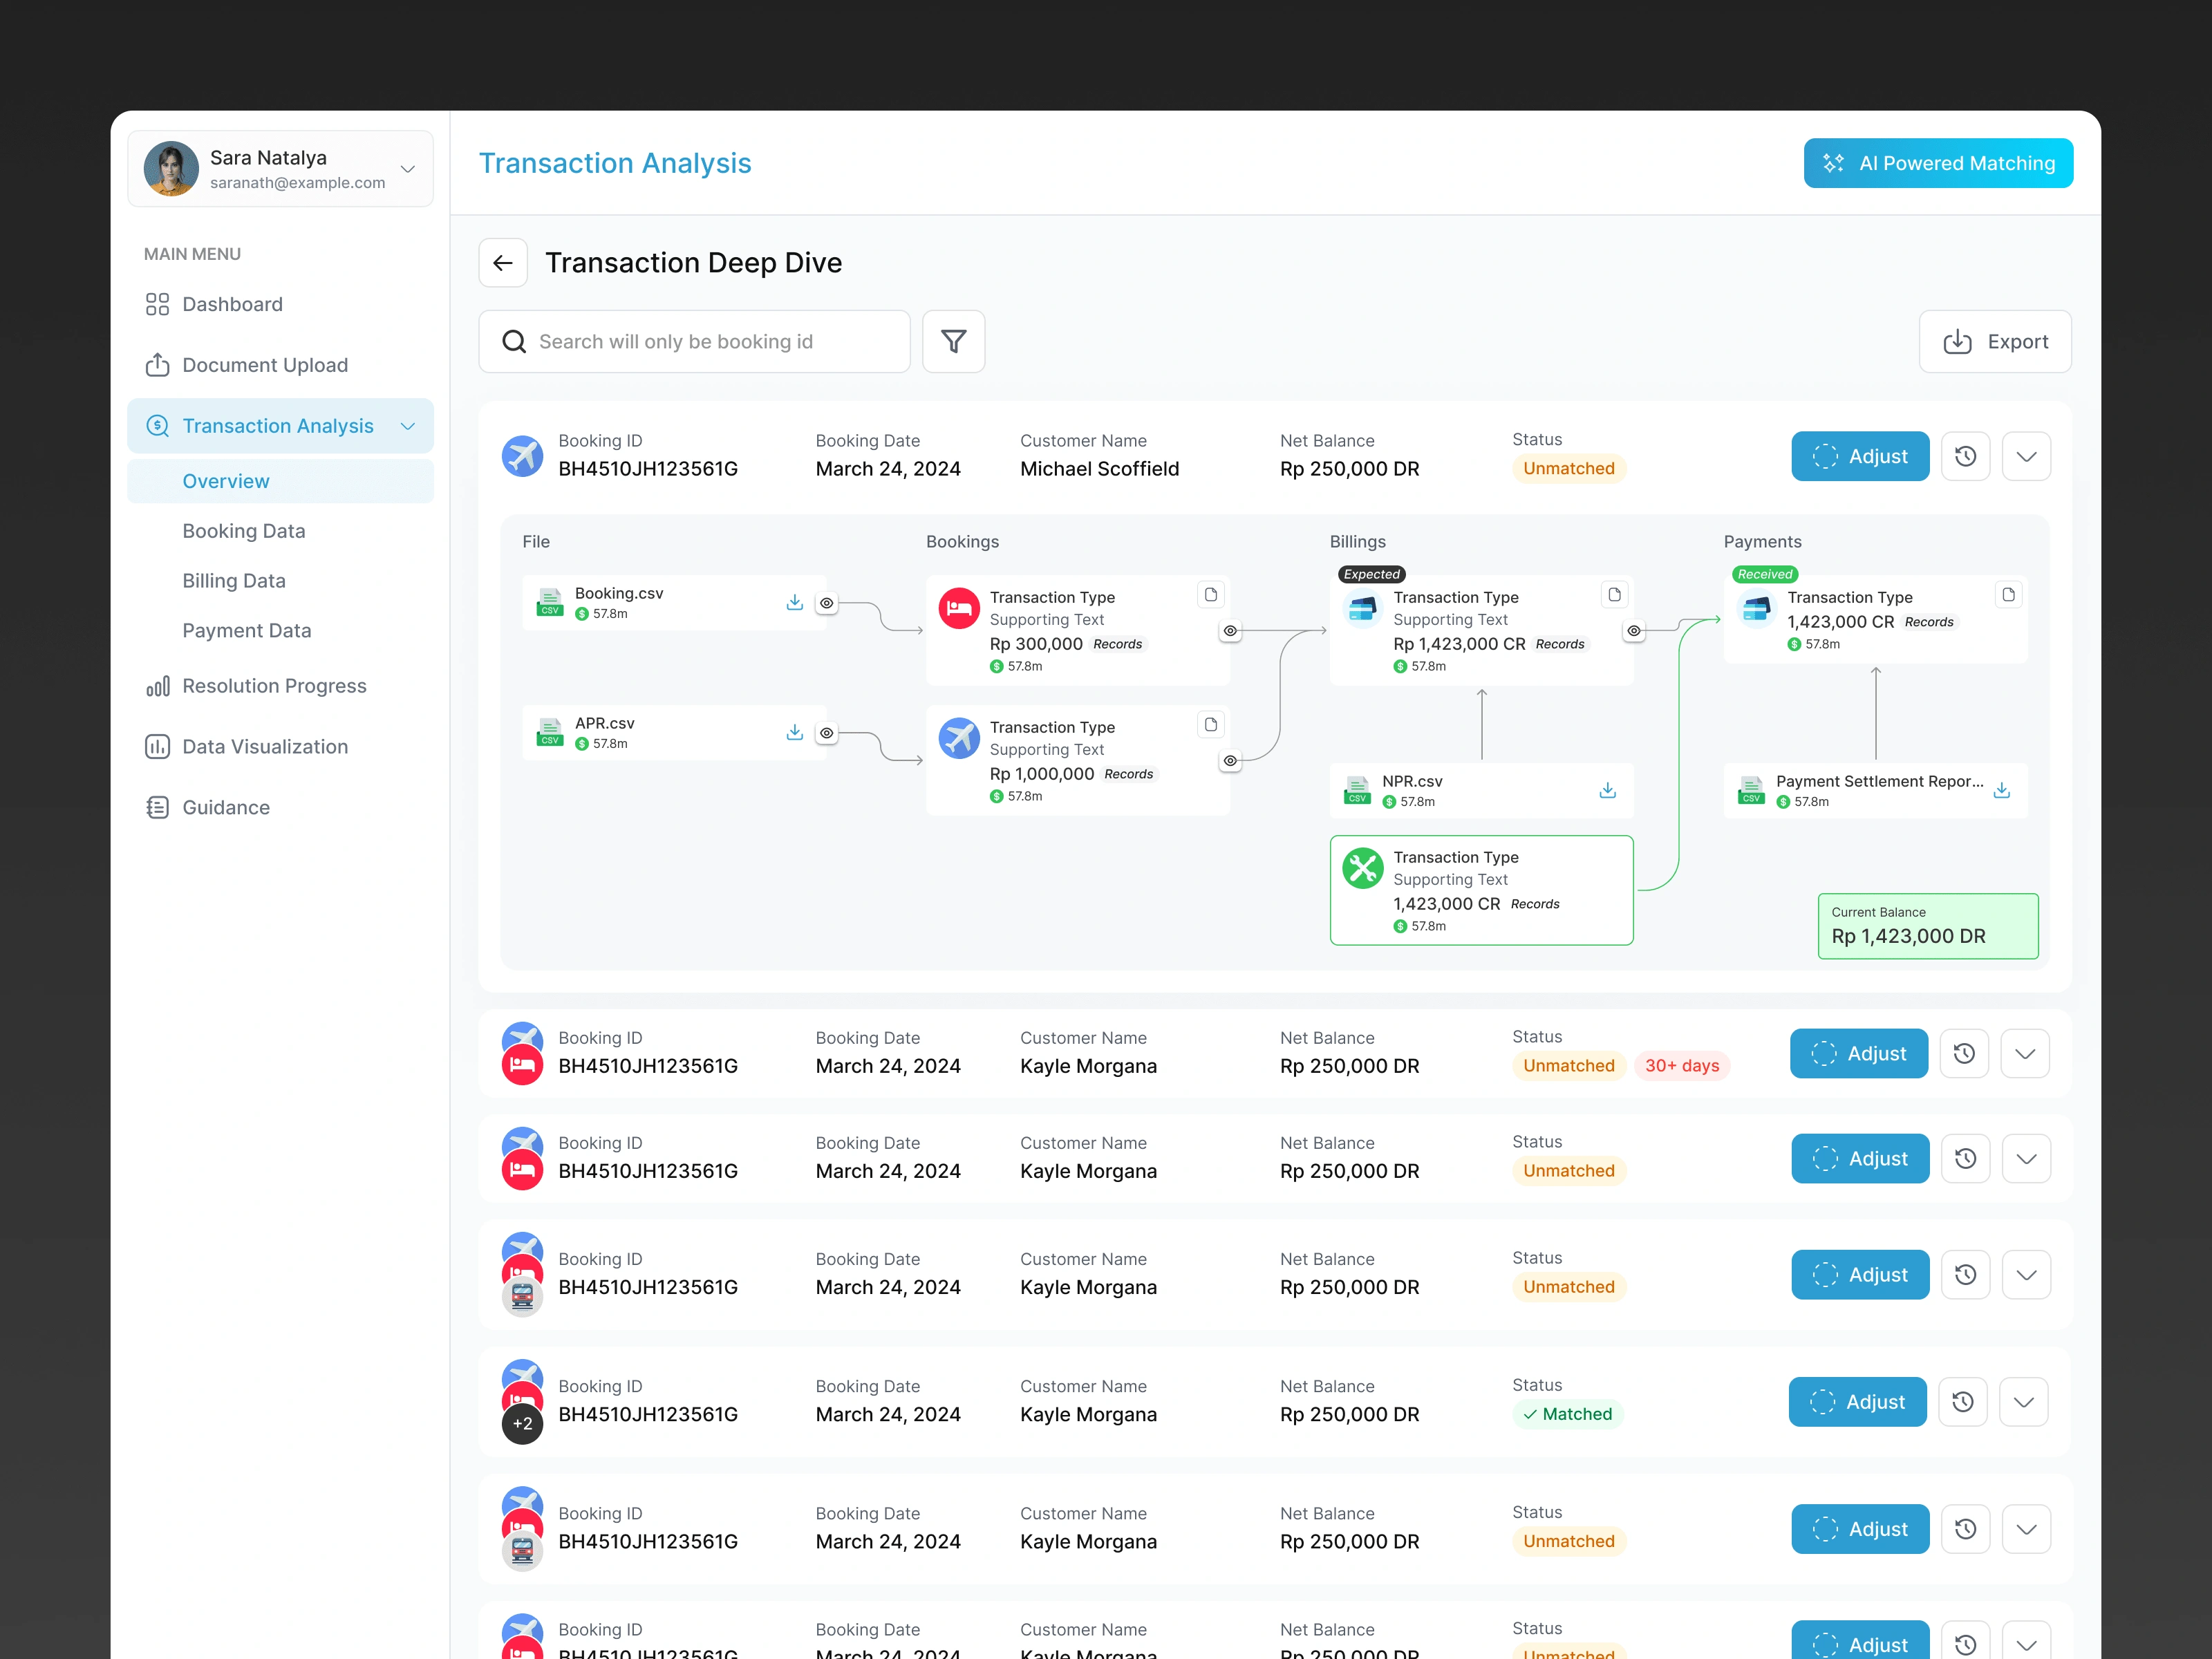
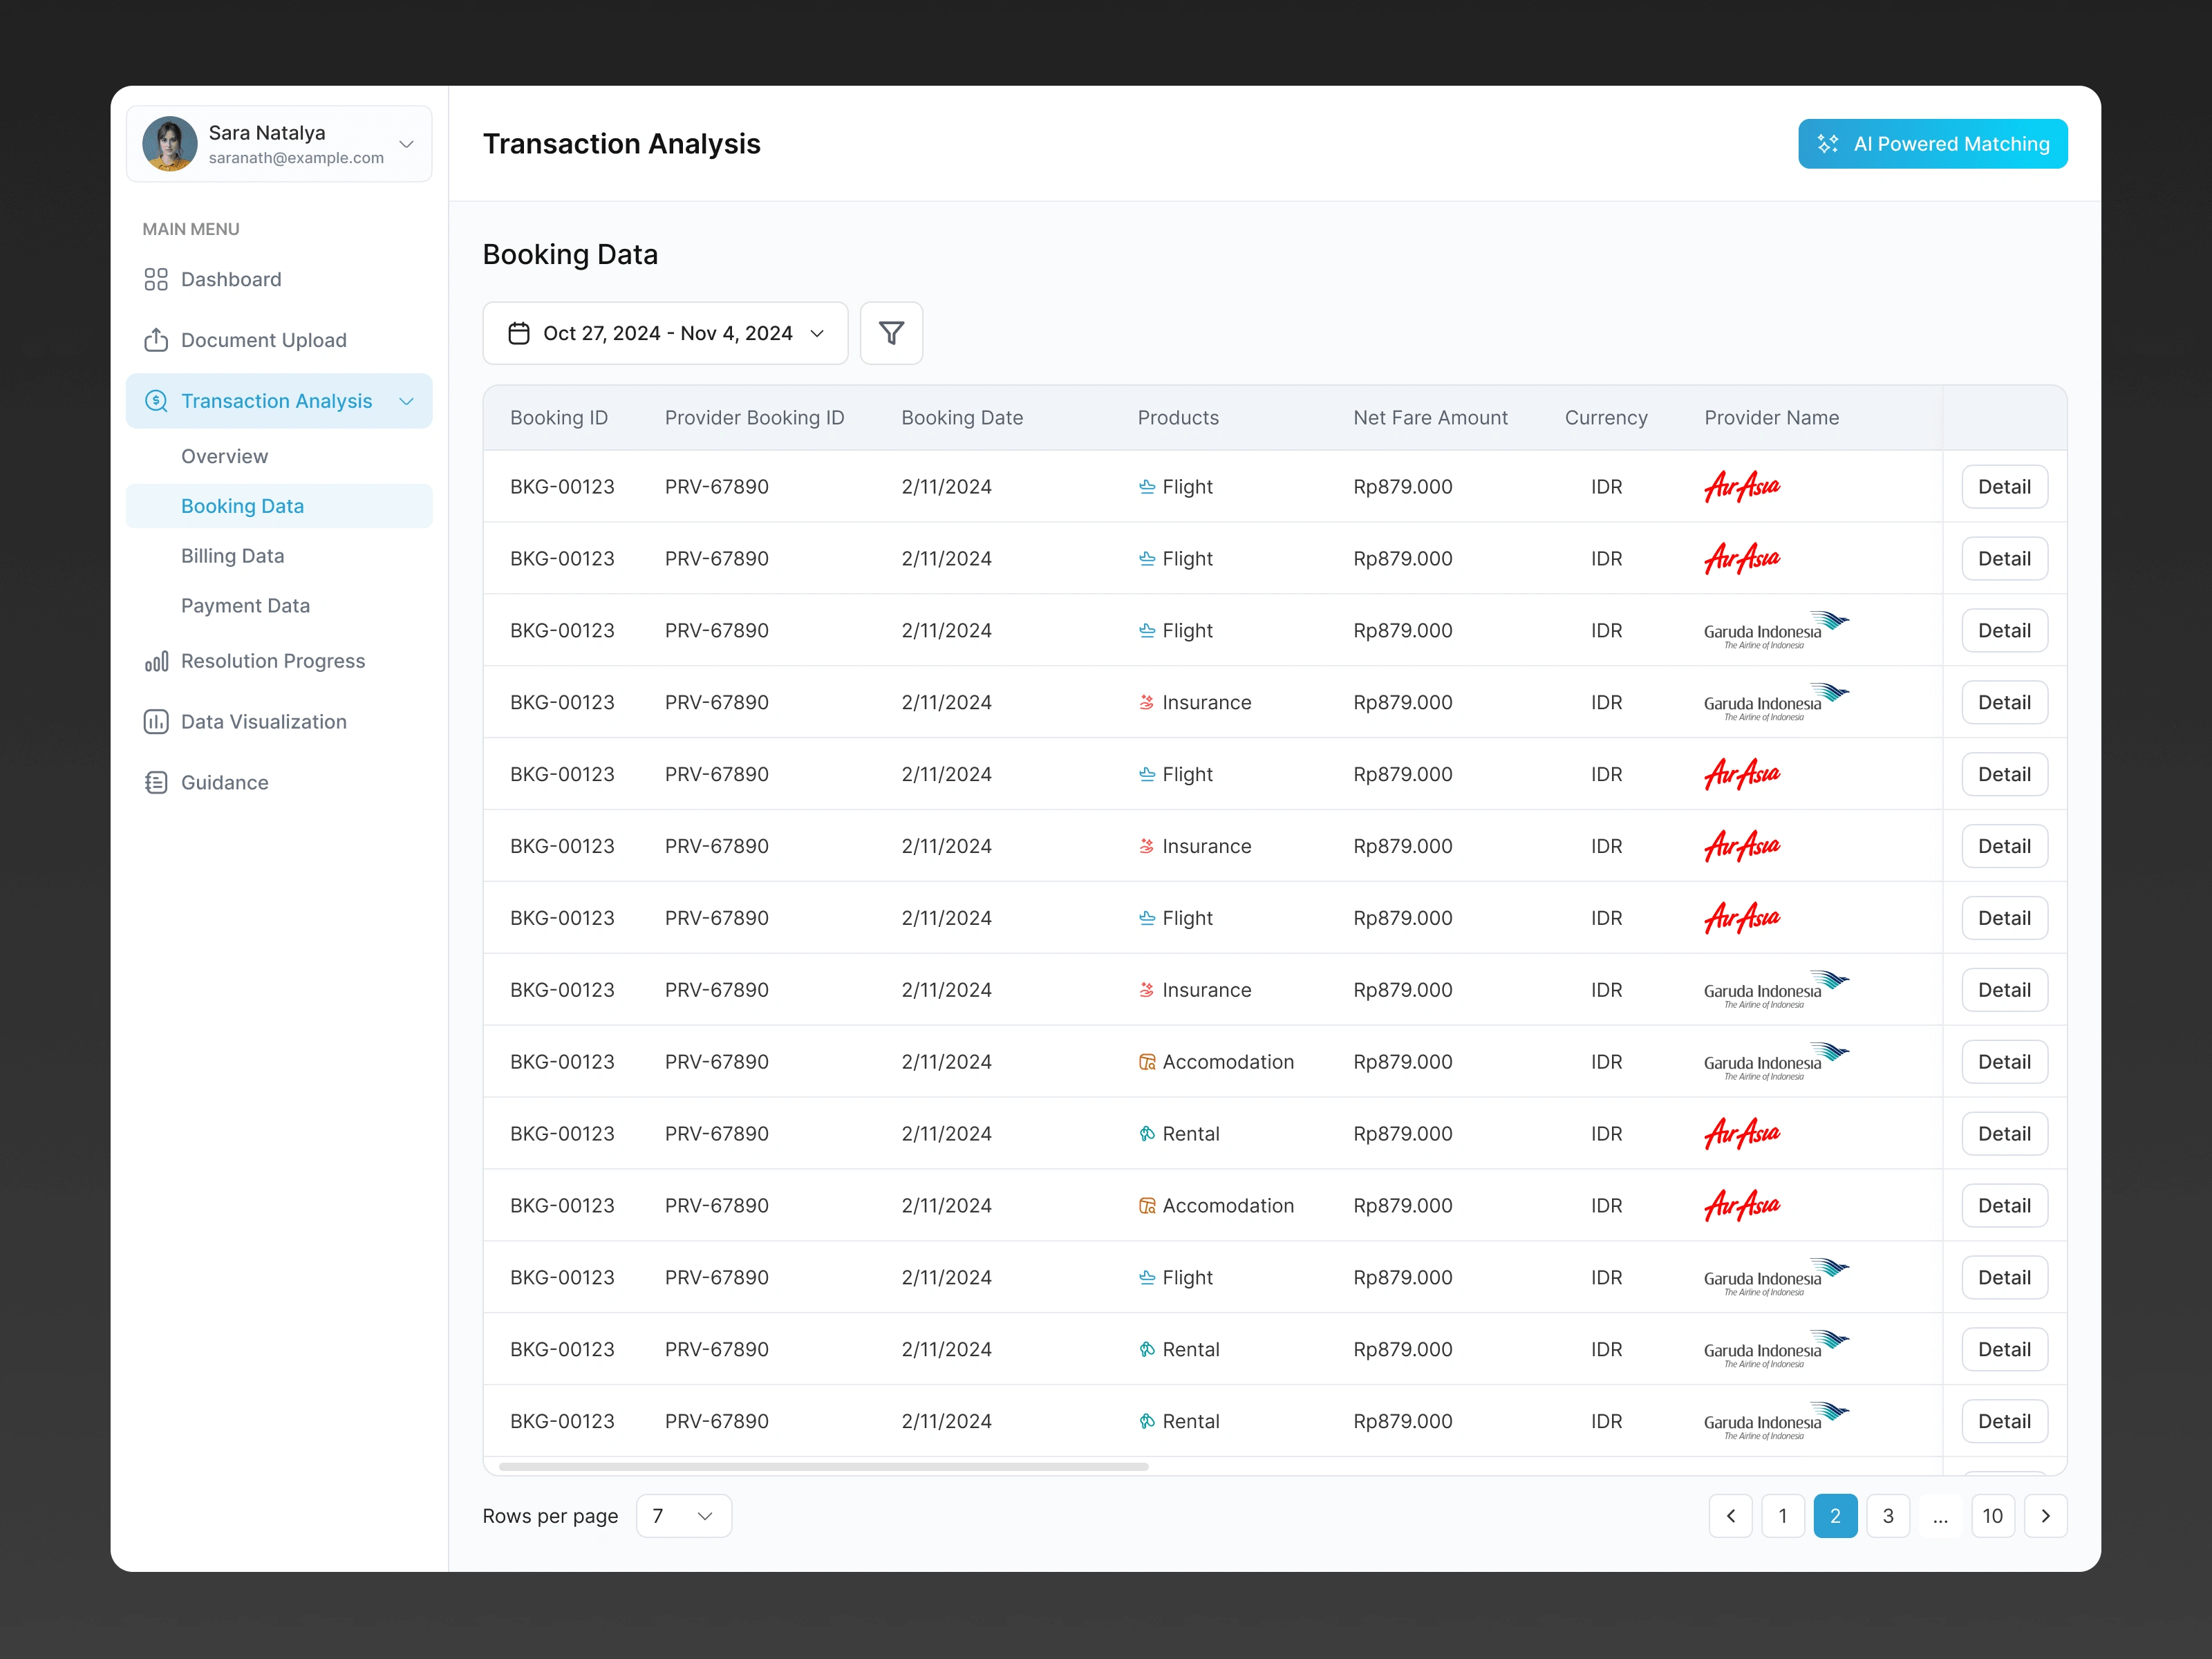
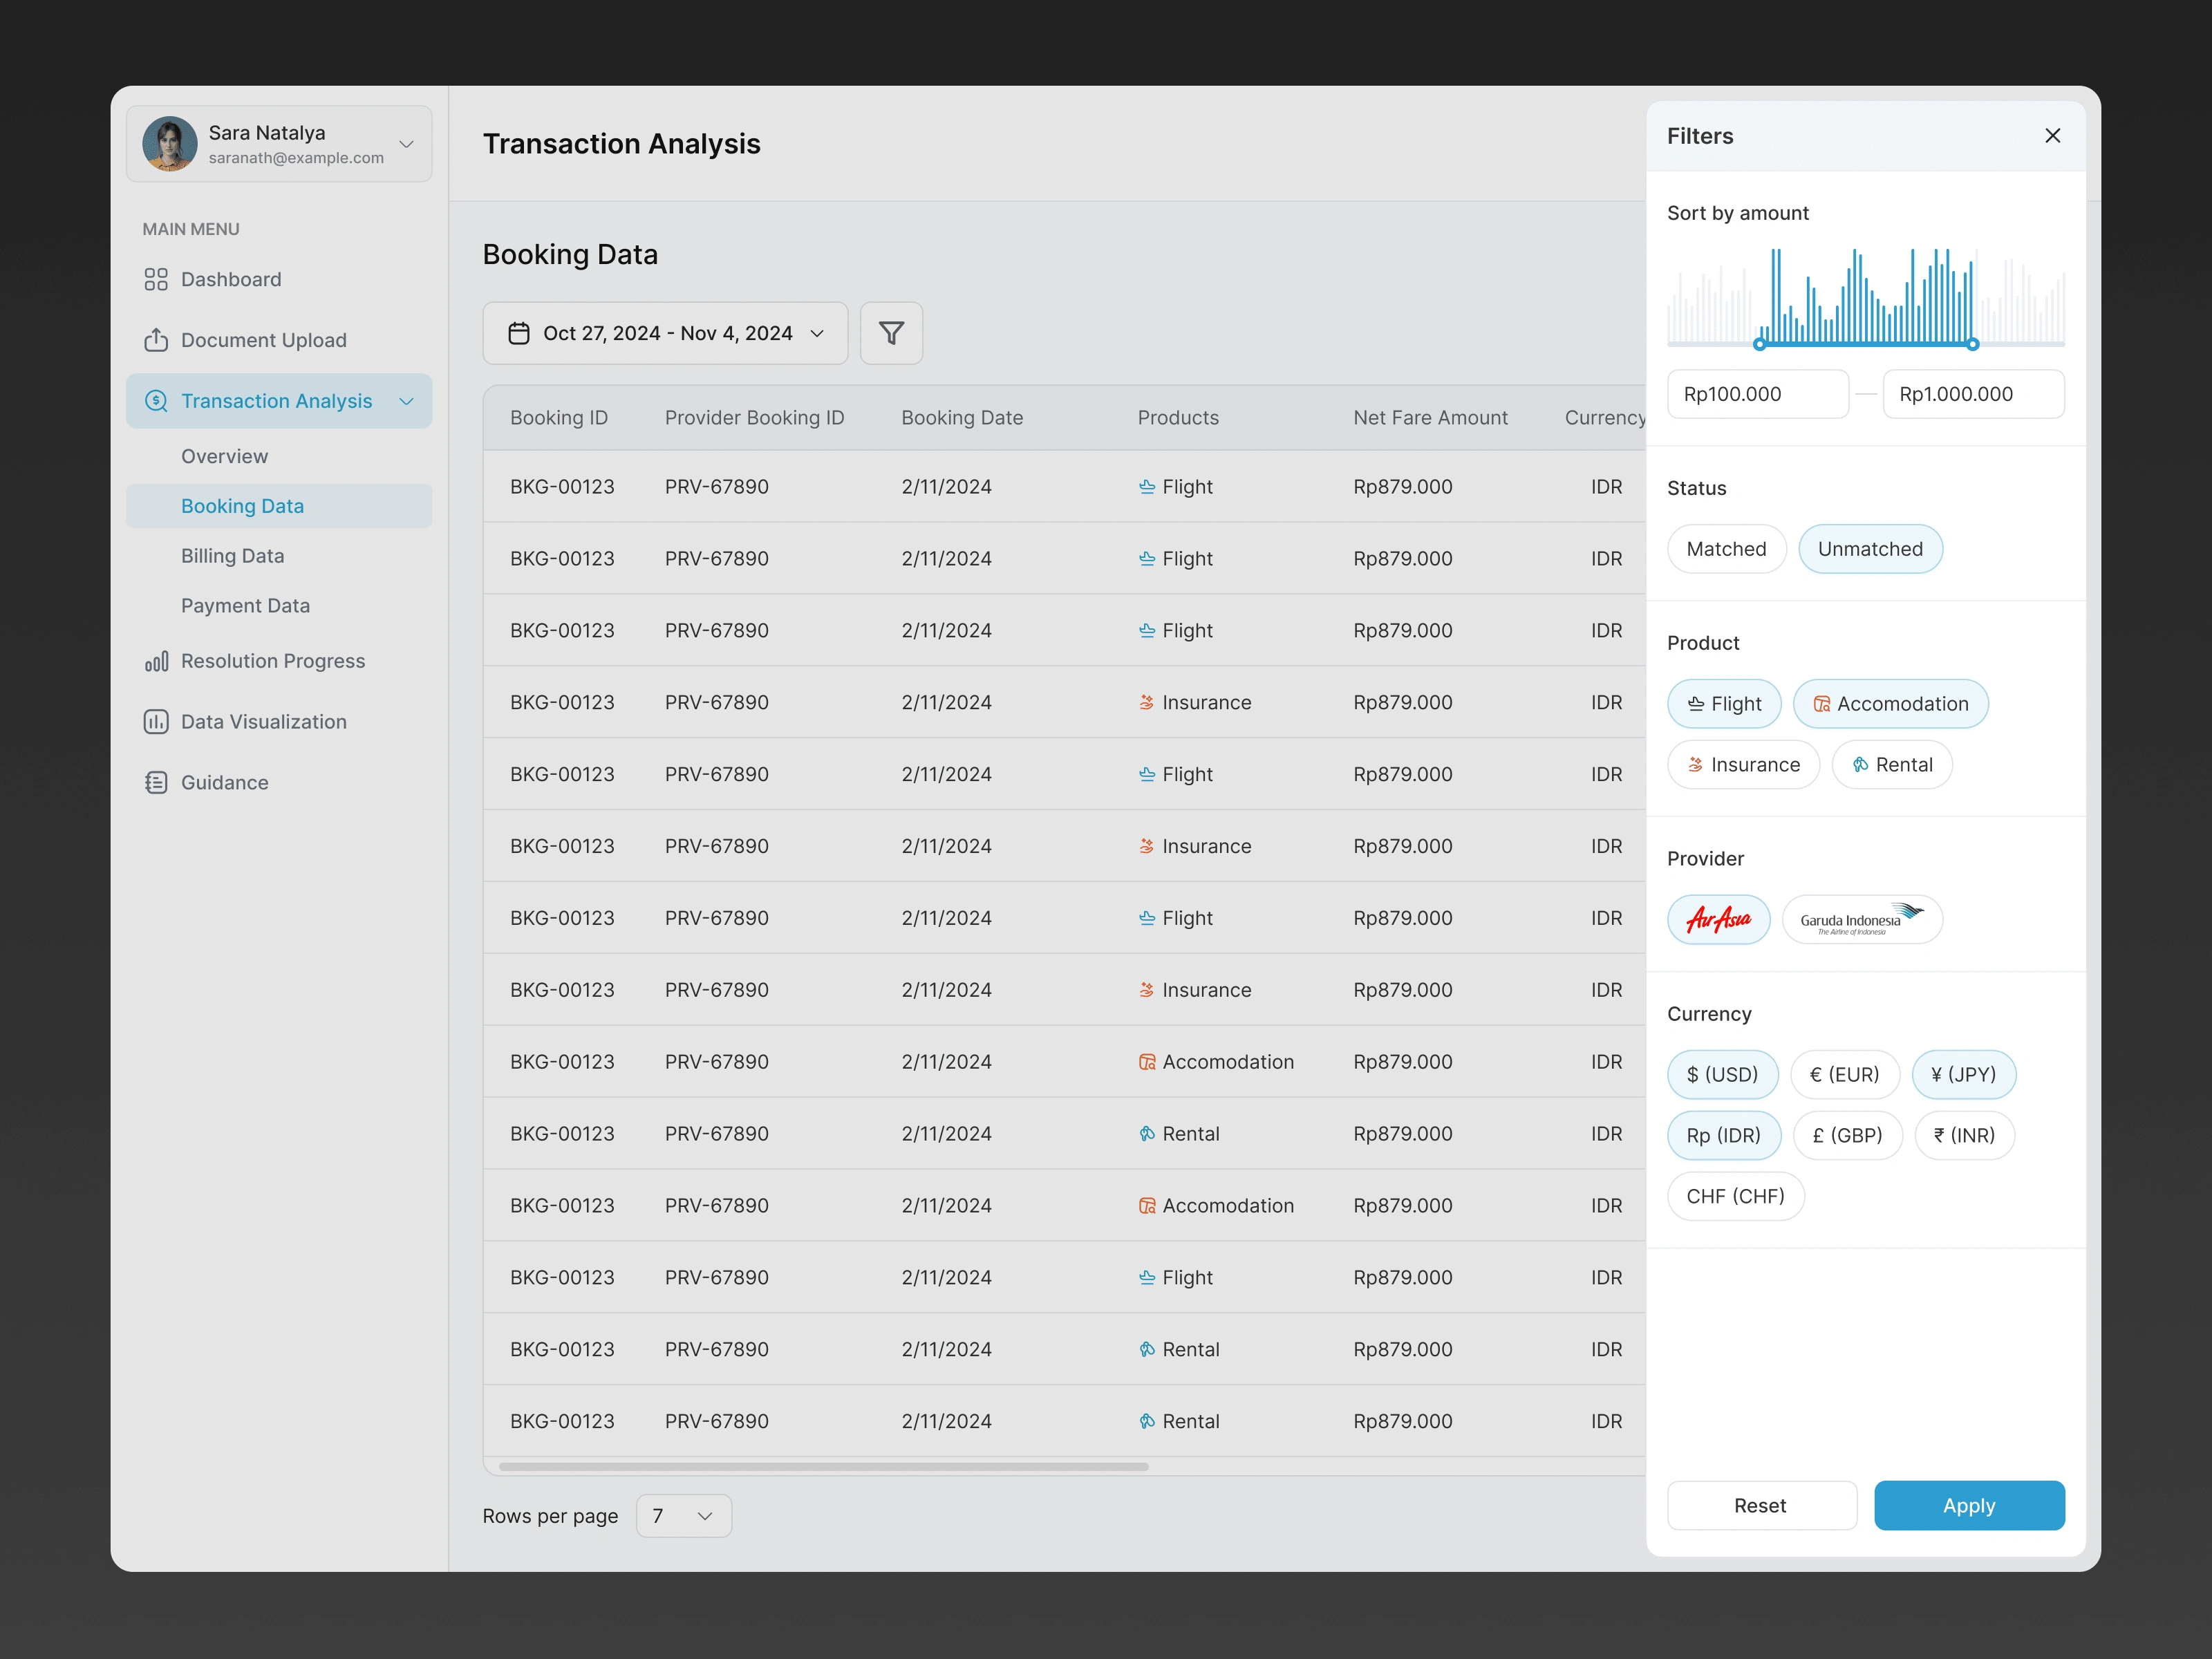
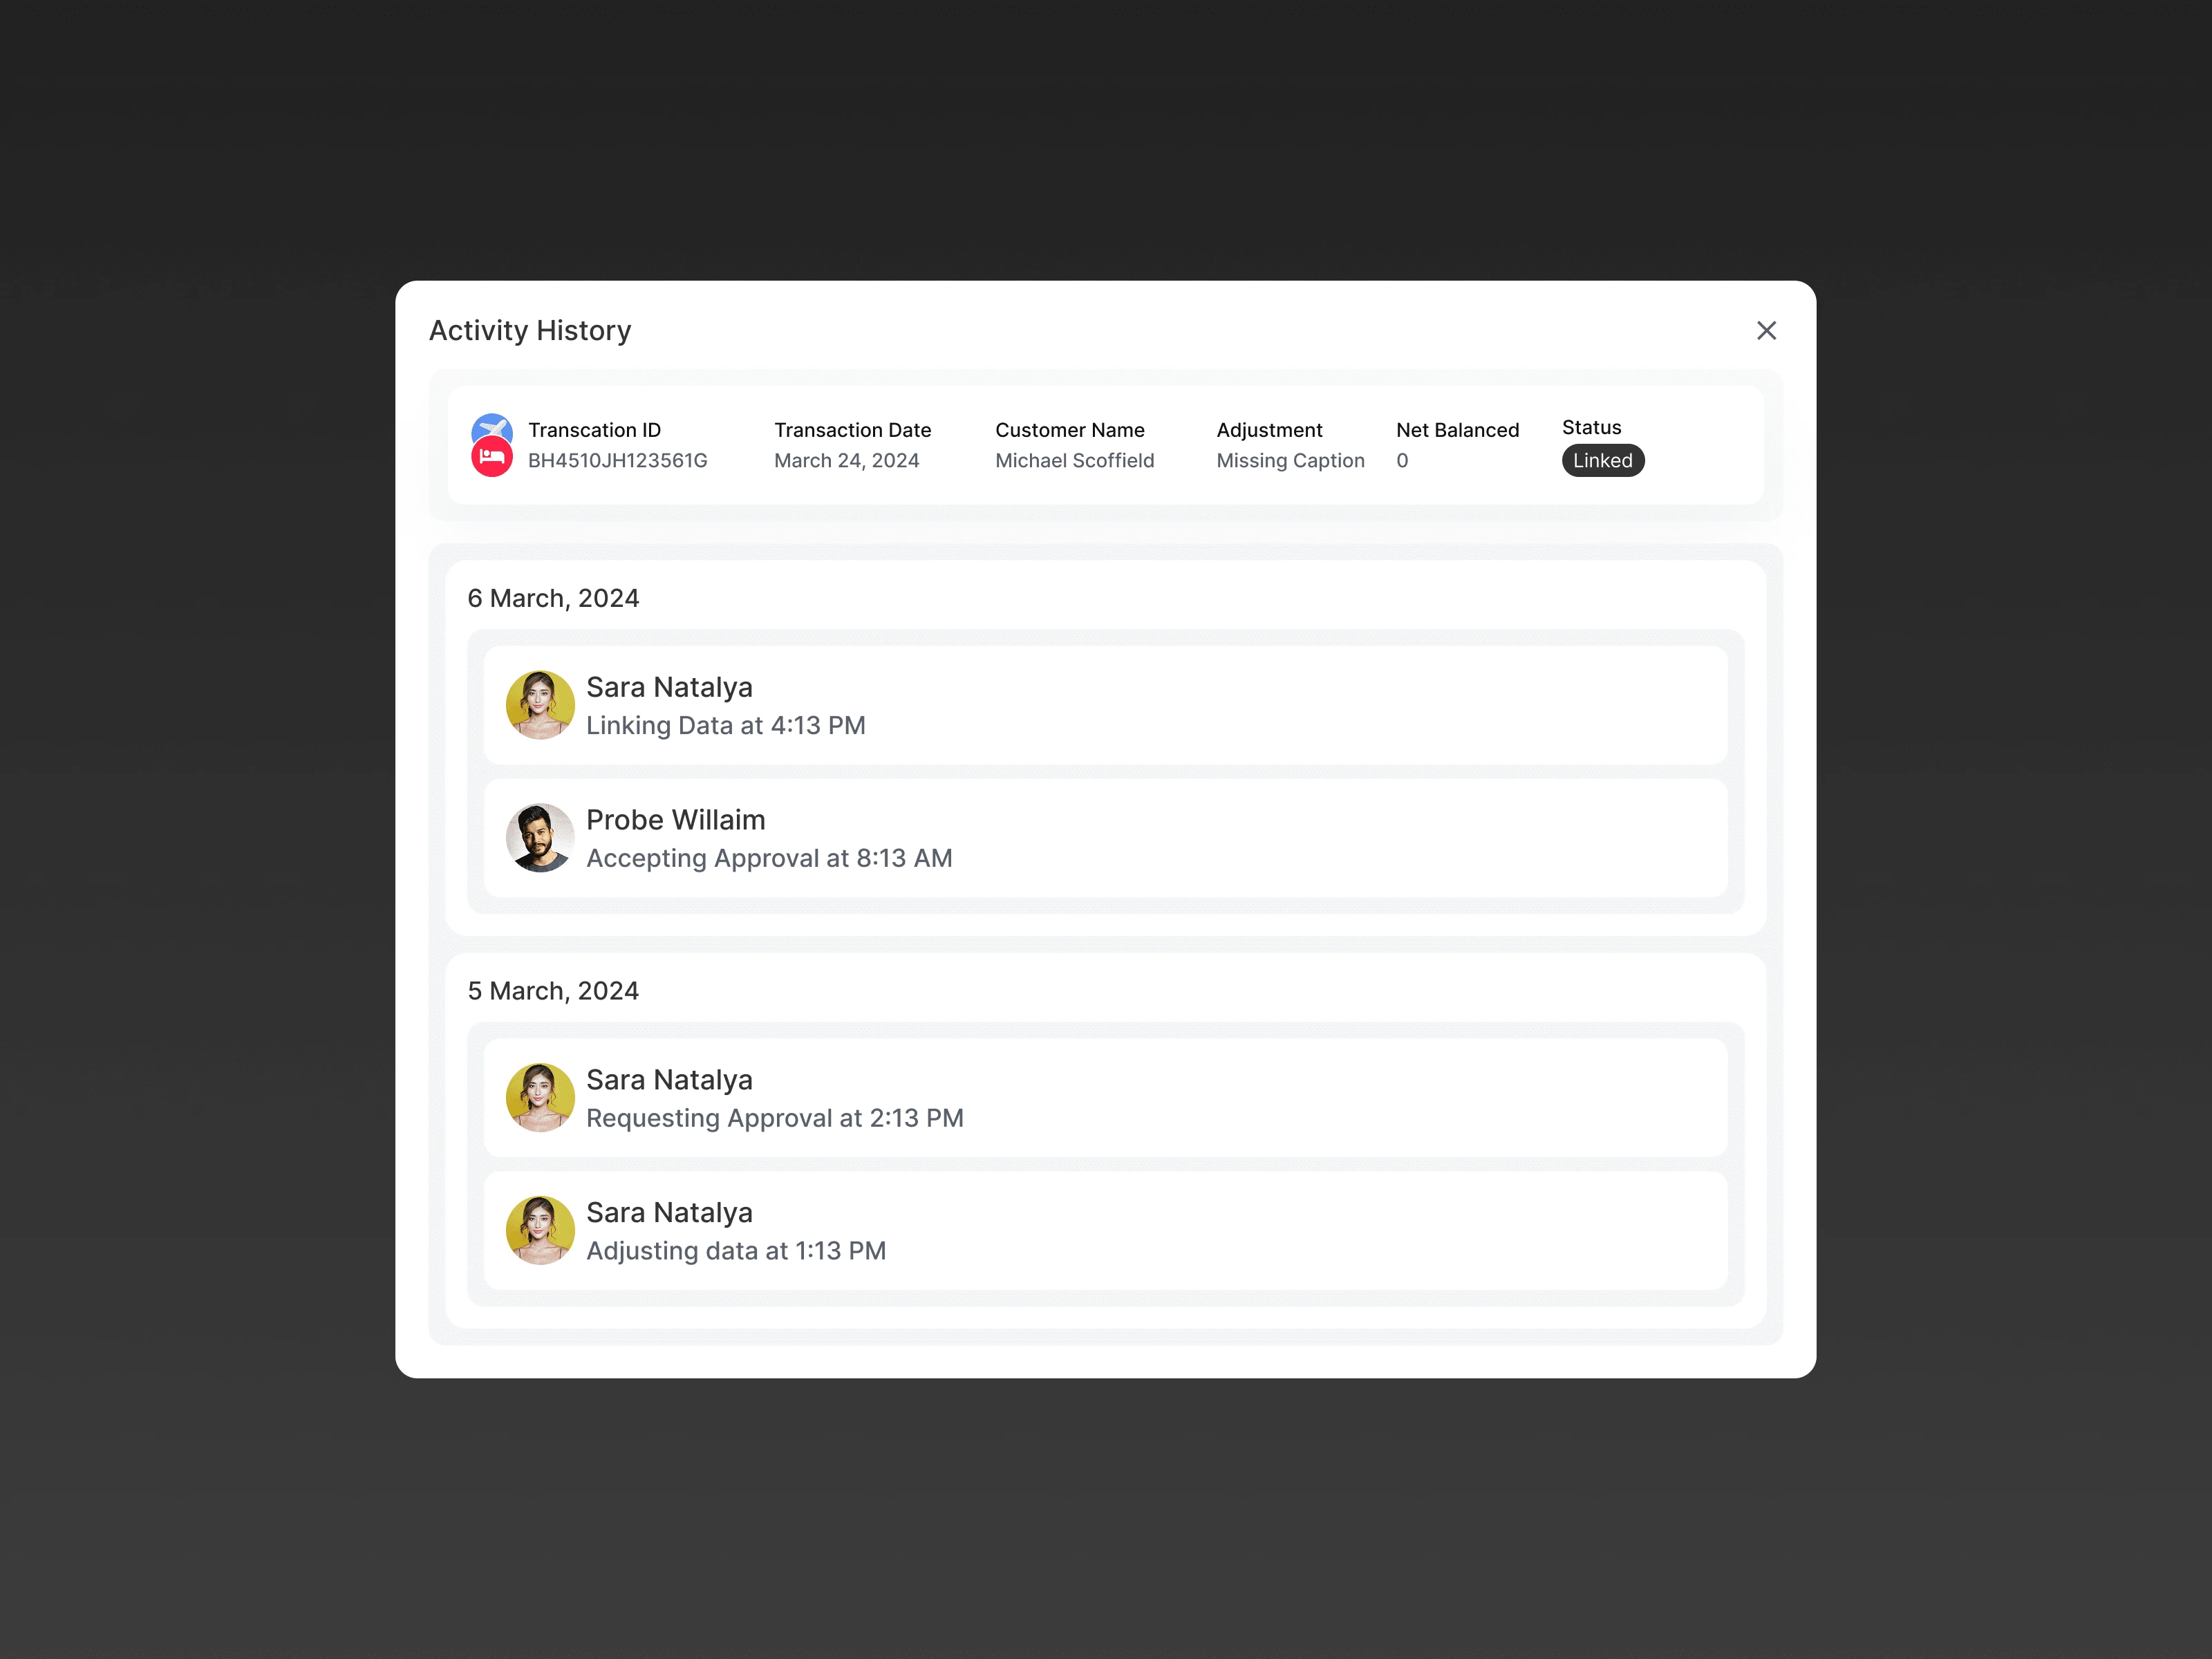
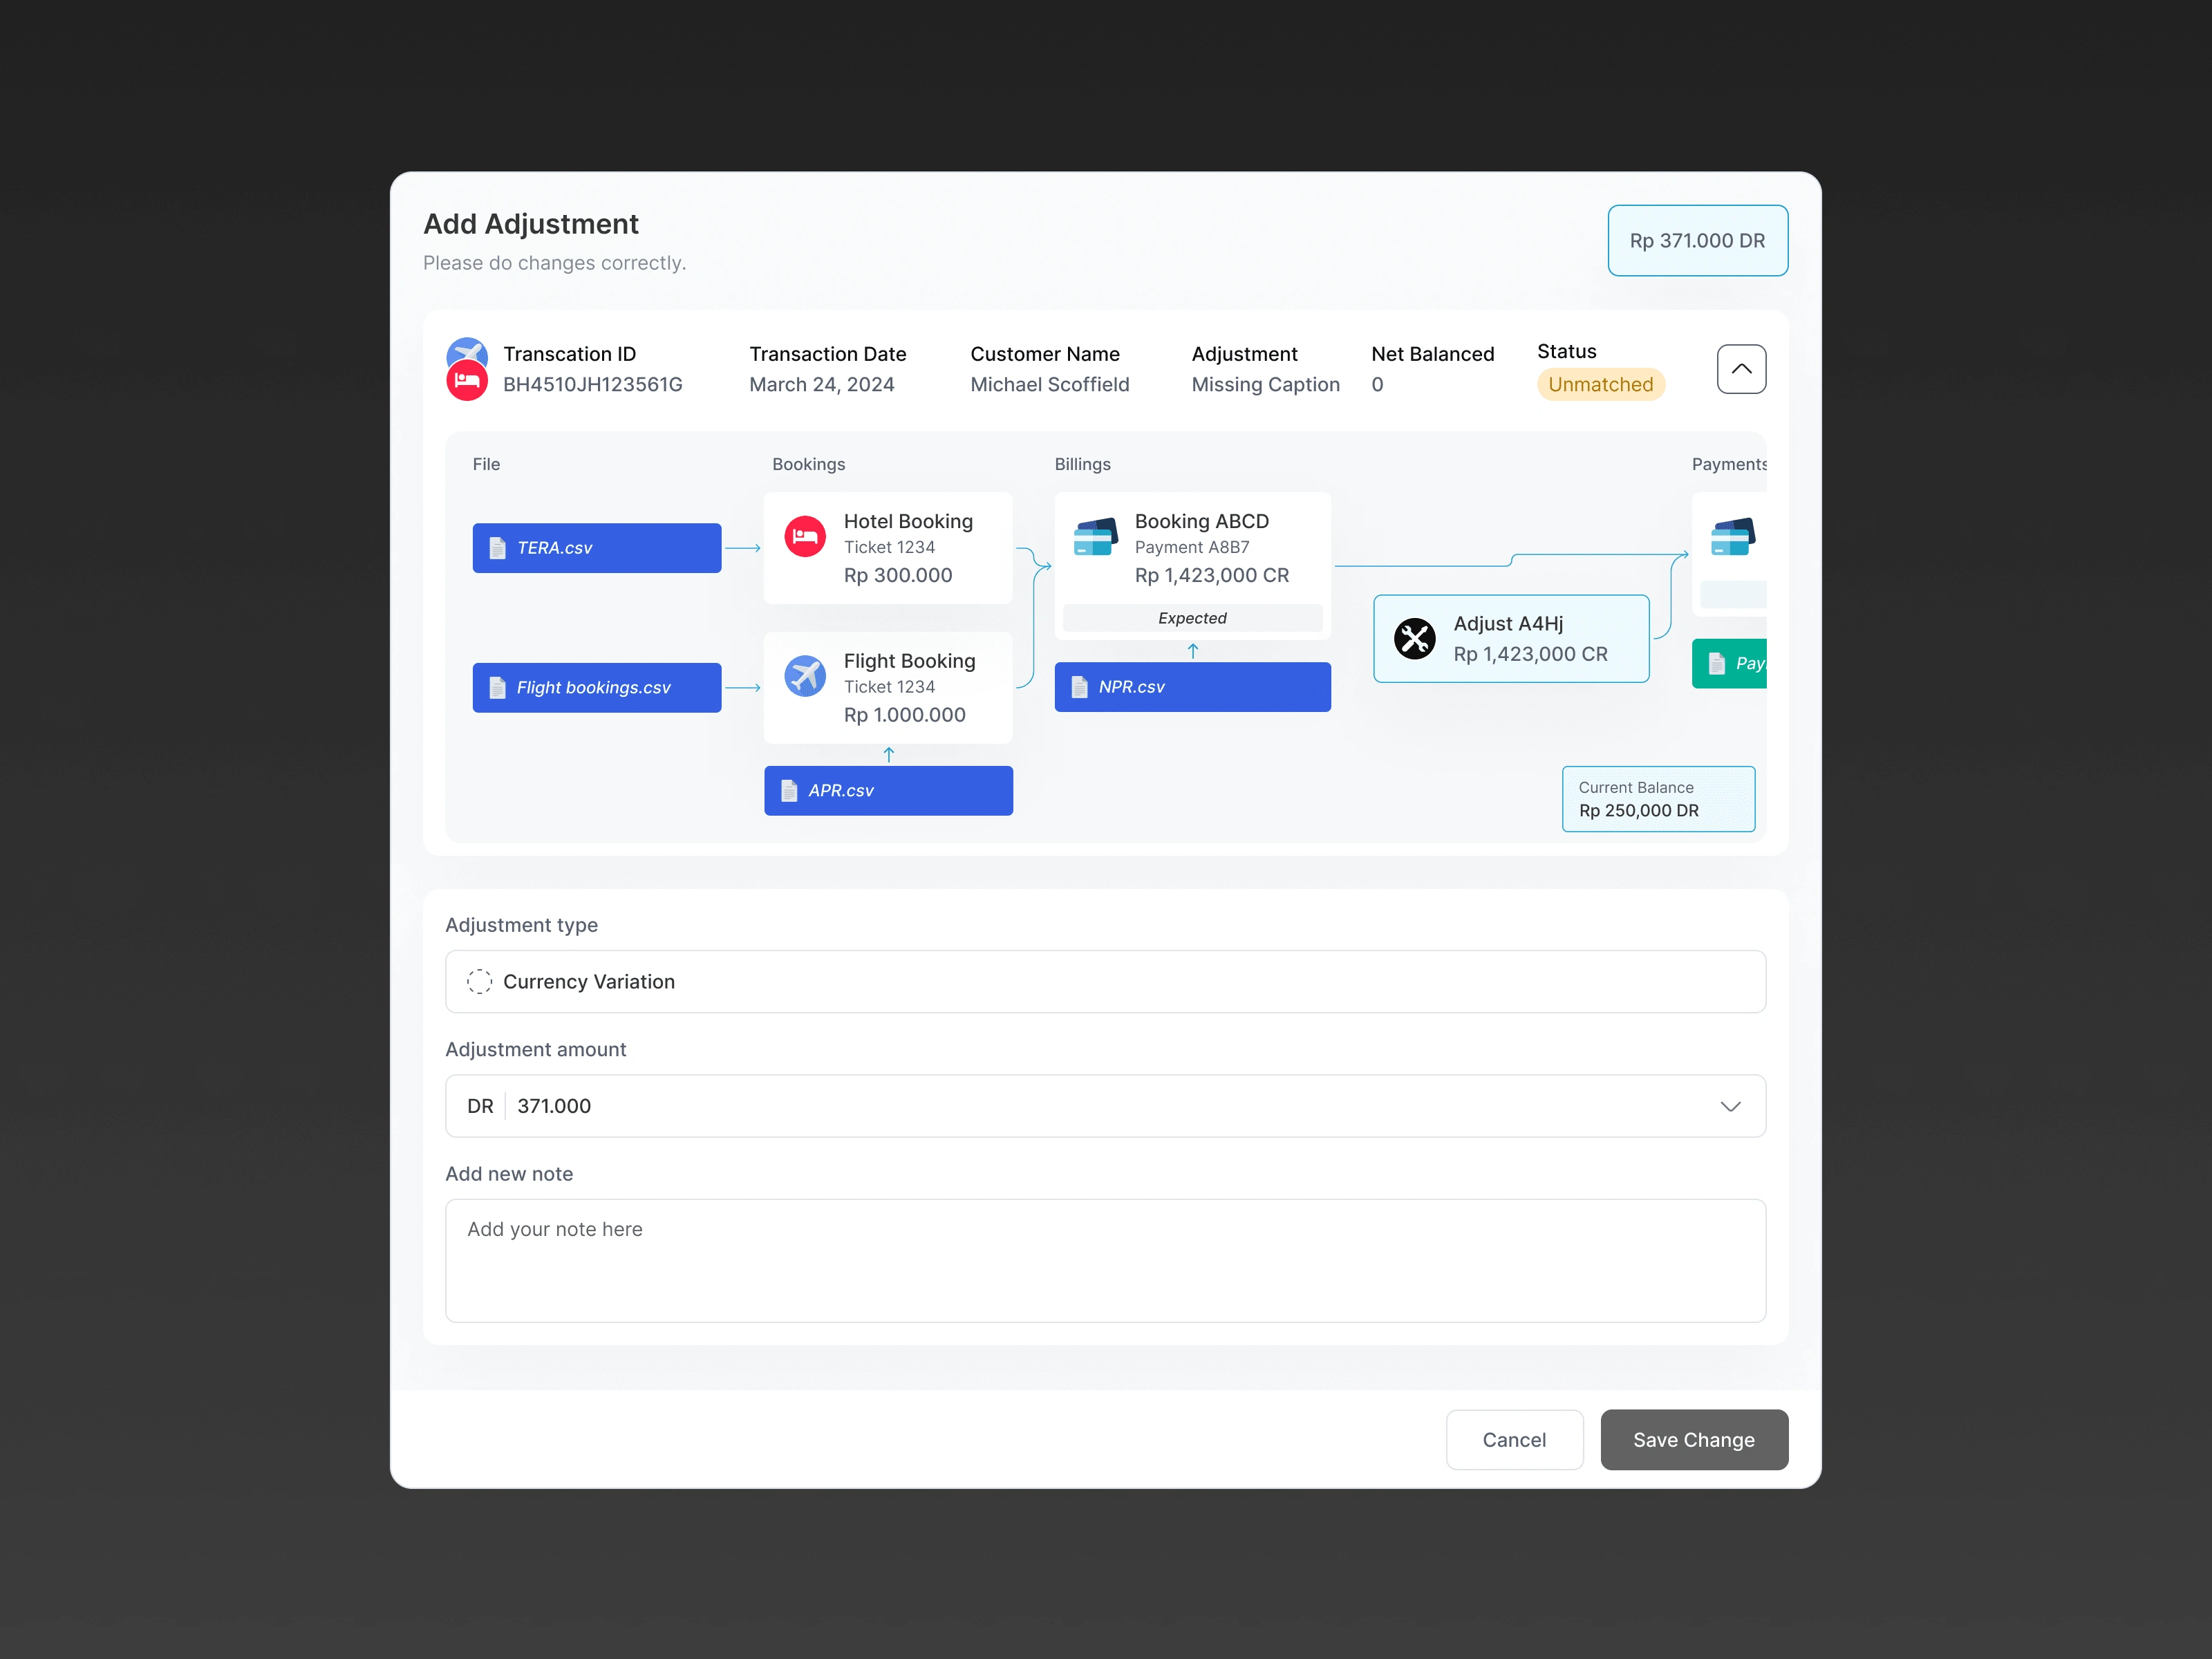
A UI dashboard design that is designed to facilitate transaction analysis with efficient intuitive and navigation data visualization. Using a data -based UX approach, this dashboard helps users match transactions, track payments, and identify accurate mismatches. With AI-Powered Matching features, sophisticated filters, and clean layout, this design supports faster and accurate decision making in financial management.
The navigation sidebar uses a clear icon and label, while the main area displays the flow of transactions in a connected card -based visualization, providing an easy picture. Neutral colors with blue accents create a professional and modern impression, while interactive elements such as the "Details" button and search improve user experience.
This section displays a detailed transaction flow from booking, billing, to payment in a hierarchical display. Each stage is visually connected, facilitating the identification of transaction status, including balances, adjustments, and matched/unmatched status. Color indicators and status labels help fast navigation in the financial reconciliation process.
This section displays a list of booking transactions in a neat table, with complete information such as date, product, price, and provider. The filter on the right side allows users to filter data based on the amount, status, product, provider, and currency, facilitate the search and analysis of transactions.
Like this project
0

Posted Mar 18, 2025

UI dashboard for transaction analysis, match data, track payments, and identify mismatch with intuitive visualization and AI-Powered Matching.

Likes

0

Views

0

Timeline

Oct 21, 2024 - Nov 27, 2024

Tags

UI Designer

UX Designer

Visual System Designer

Figma

FinTech

Crypto Dashboard Redesign
Vincerix Website
Vincerix Website
AI Email Coach
AI Email Coach
Alumea Skincare E-commerce