Super Store Sales Insight Power-BI-Dashboard
Harsh Boda
Problem Statement:
The superstore is selling a variety of products across multiple countries, with different categories and subcategories. The goal is to analyze the sales data and identify useful insights to help the store increase its sales and grow its business.
Steps Followed in this project
Step : 1 Business requirement (business requirement document) From the client
Step : 2 Collect the data from different sources.
1. Sales (folder by year) 2. Categories (Excel) 3. Geography (Excel) 4. Product (CSV / Database) 5. SalesRep (Excel) 6. SubCategories (Excel)Step : 3 Cleaning the data in the power query editor
- Remove the duplicate rows - Check the datatype of the column and correct - Remove the unwanted columns - Extract the data from the column,split the column - Concate the the columns,delete the rows - Pivot and unpivoting the dataStep : 4 Create the DIM and Fact Table from the data with the use of DAX Function and Measure
1. Use various Dax function and Measure 2. Aggregation function 3. Date and time function 4. FILTER FUNCTION 5. logical functionStep : 5 Data Modeling : Connect the DIM and FACT table to each other
Step : 6 Create the Dashboard as per the requirement
Charts Use : Column chart Clustered Column Chart Pie and Donut Chart Waterfall Chart Line Chart Card and Slicer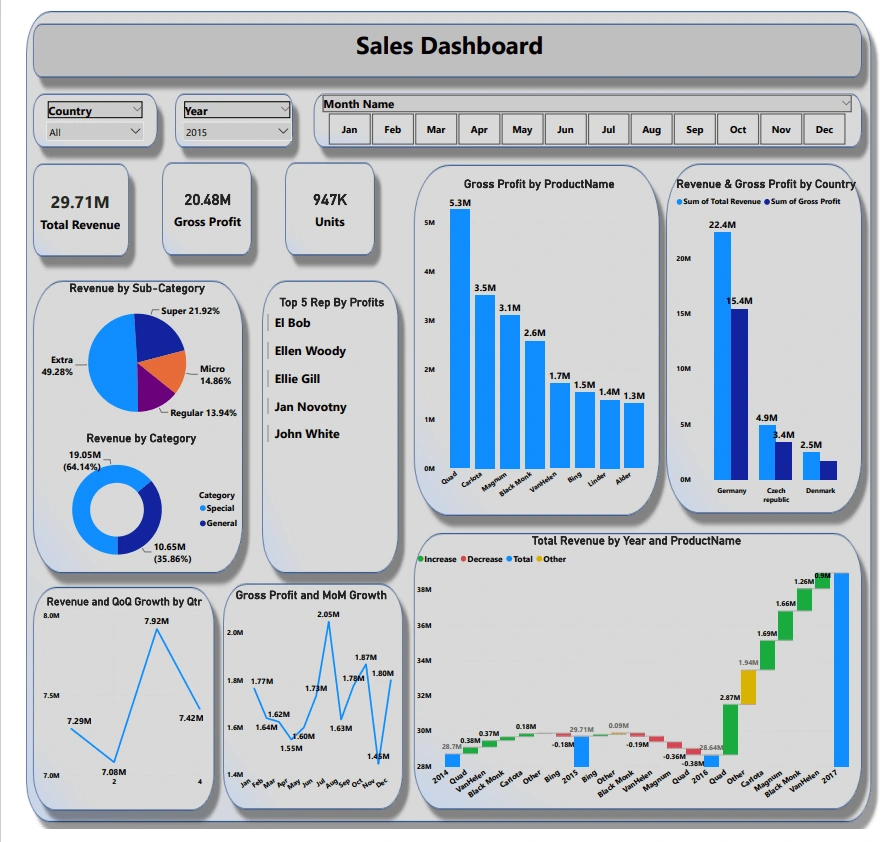
Like this project
Posted Feb 6, 2024
The Superstore Sales Analysis project aims to explore and analyze the sales data of a retail superstore, identifying key trends, patterns, and opportunities.
Likes
0
Views
16