🚀 Podcast Analytics Dashboard: Built with React & AI in 5 Days
Vaibhav Vats
Project: Chart Table Rebuild – A Startupathon Challenge
Overview
I participated in a Startupathon and built an alternative to the Spotify Chart Table within just 5 days. This project is a fully responsive web application created using React and NPM. I leveraged AI tools to speed up development and ensure a seamless user experience.
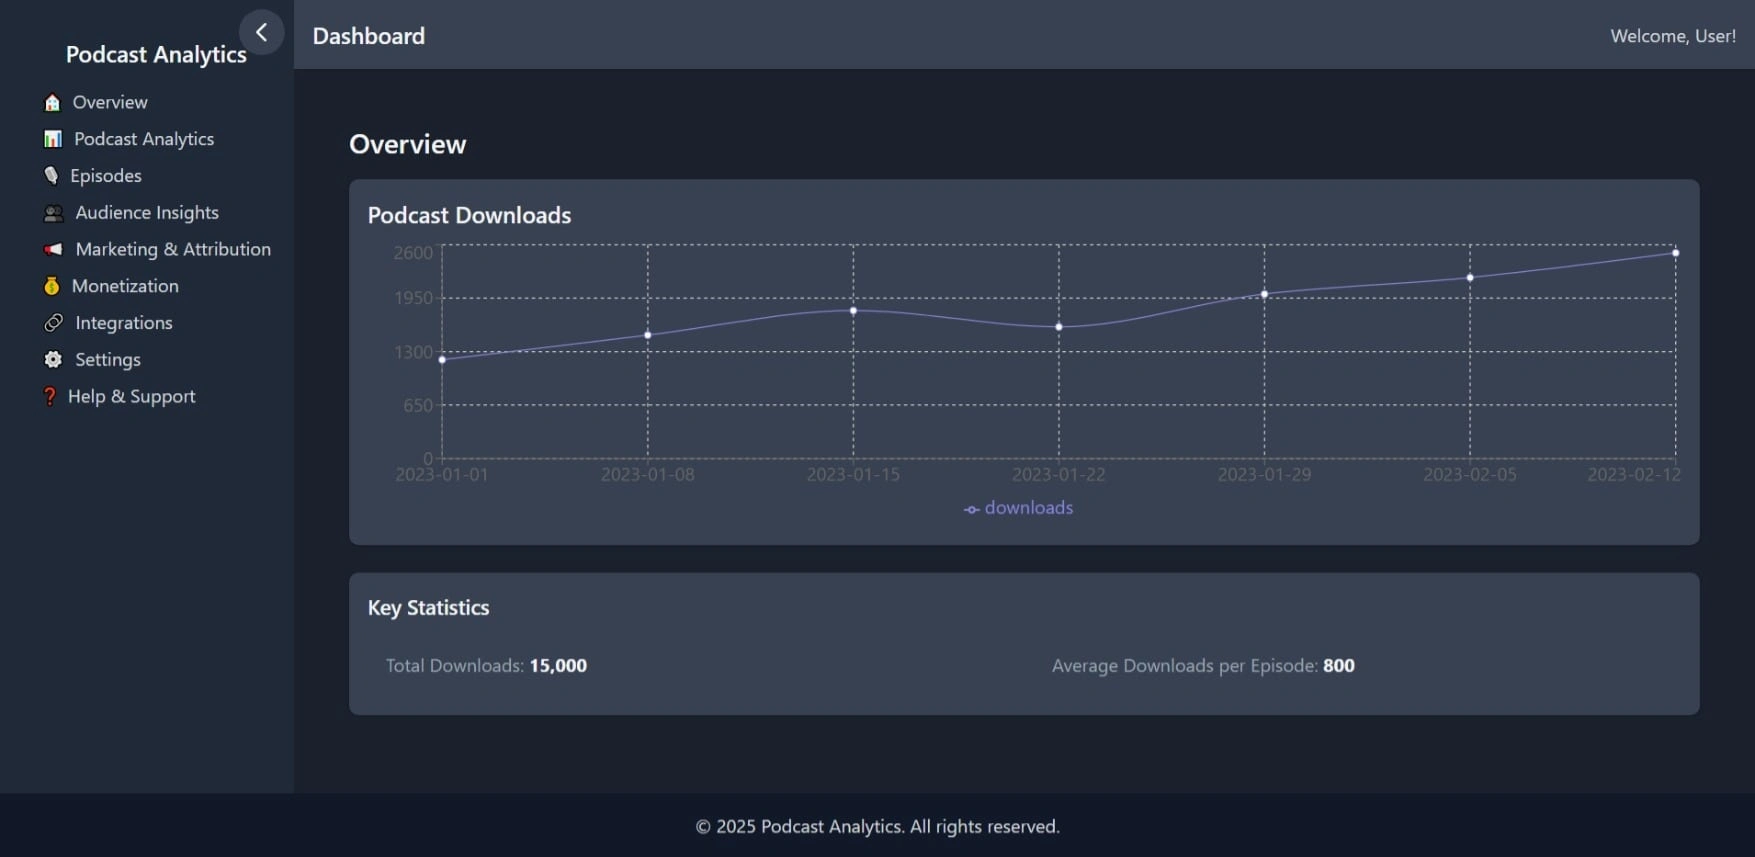
🔗 Live Project: Podcast Analytics
🔗 Loom Video: Watch Demo
Tech Stack & Features
Frontend
Built with ReactJS and NPM
Fully Responsive UI with multiple data visualization graphs
Integrated authentication with dummy login credentials
Dashboard with analytics & filtering options
Backend
Initially built as a monolithic system, but later optimized
Researched Microservices Architecture for scalability
API Gateway Implementation planned for integrating multiple backend services
Key Features
✅ User Authentication – Sign in and Login functionality
✅ Dynamic Data Representation – Various types of charts and graphs integrated
✅ Filtering Options – Sort by newest, oldest, and engagement rate
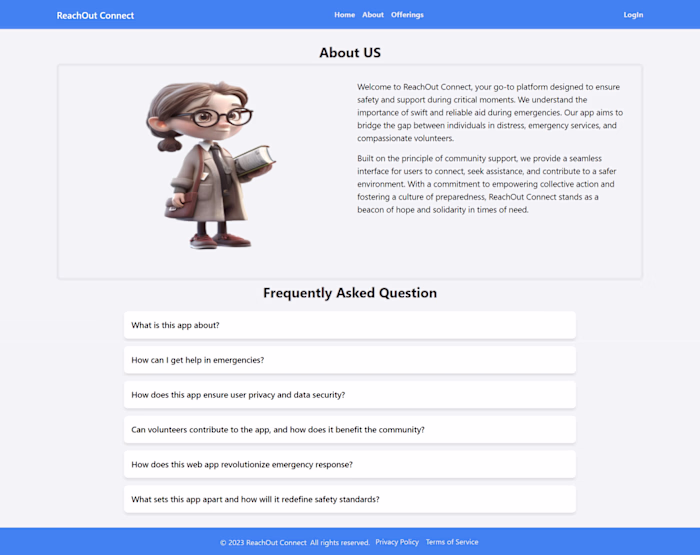
✅ Static Pages – Upgrade plans, privacy policy, and security settings
✅ Future Scope – Transitioning to microservices architecture for better scalability.
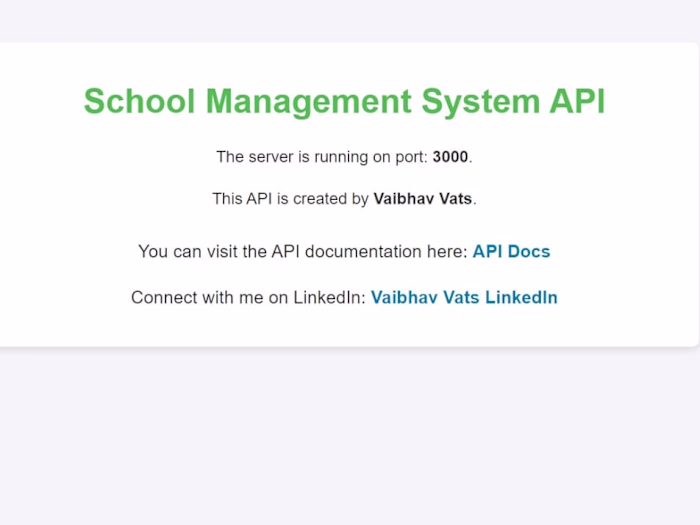
✅ Backend Development: Use Node JS, Express JS and Mongo DB to create the user auth api. GitHub Link: Click Here.
Demo Credentials
Email: test@example.com
Password: 123456
Conclusion
This project showcases my ability to build a scalable, AI-assisted, and responsive web application within a limited timeframe. I am continuously improving it by integrating a microservices-based backend and enhancing its functionality.
🔗 Live Project: Click Here
🔗 Loom Video Demo: Click Here
🚀 Looking for freelance opportunities? Let’s connect!
Like this project
Posted Feb 27, 2025
I built a responsive Podcast Analytics Dashboard in 5 days for a Startupathon using React, NPM & AI. It features auth, data visualization, filters & scalability