Unraveling the Story of Shoes and Adventures with Data Visuals
Bliss Wave IT LLC
Technical Approach
Utilizing Python for data aggregation and analysis, I meticulously tracked activities and footwear performance. My data was managed through PostgreSQL, chosen for its robust relational database capabilities, essential for identifying patterns and segregating data effectively.
The Blueprint: Data Modeling
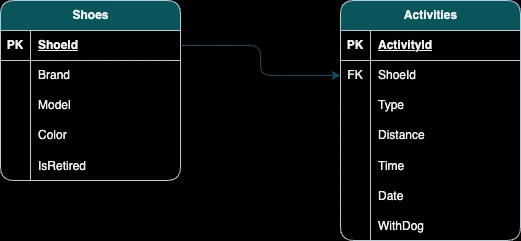
This project involved two tables: Shoes and Activities.
Each shoe is linked to a particular type of activity. Multiple shoes can be associated with the same activity due to replacements, and each shoe may have multiple recorded activities. I walk Laika at least twice a day and make sure to record the distance with my Garmin Forerunner.
Queries in Action: Uniting Shoes with Their Journeys
To view the total distance for each shoe. The following query can be used.
# Query to join shoes and activities and get total distance run by each shoe
query = """
SELECT
s.shoeid,
s.brand,
s.model,
s.color,
s.isretired,
SUM(a.distance) as distance
FROM
shoes s
LEFT JOIN
activities a ON s.shoeid = a.shoeid
GROUP BY
s.shoeid, s.brand, s.model, s.color, s.isretired
ORDER BY
distance DESC;
"""
This query joins the shoes and activities table together to obtain each shoe’s total mileage.
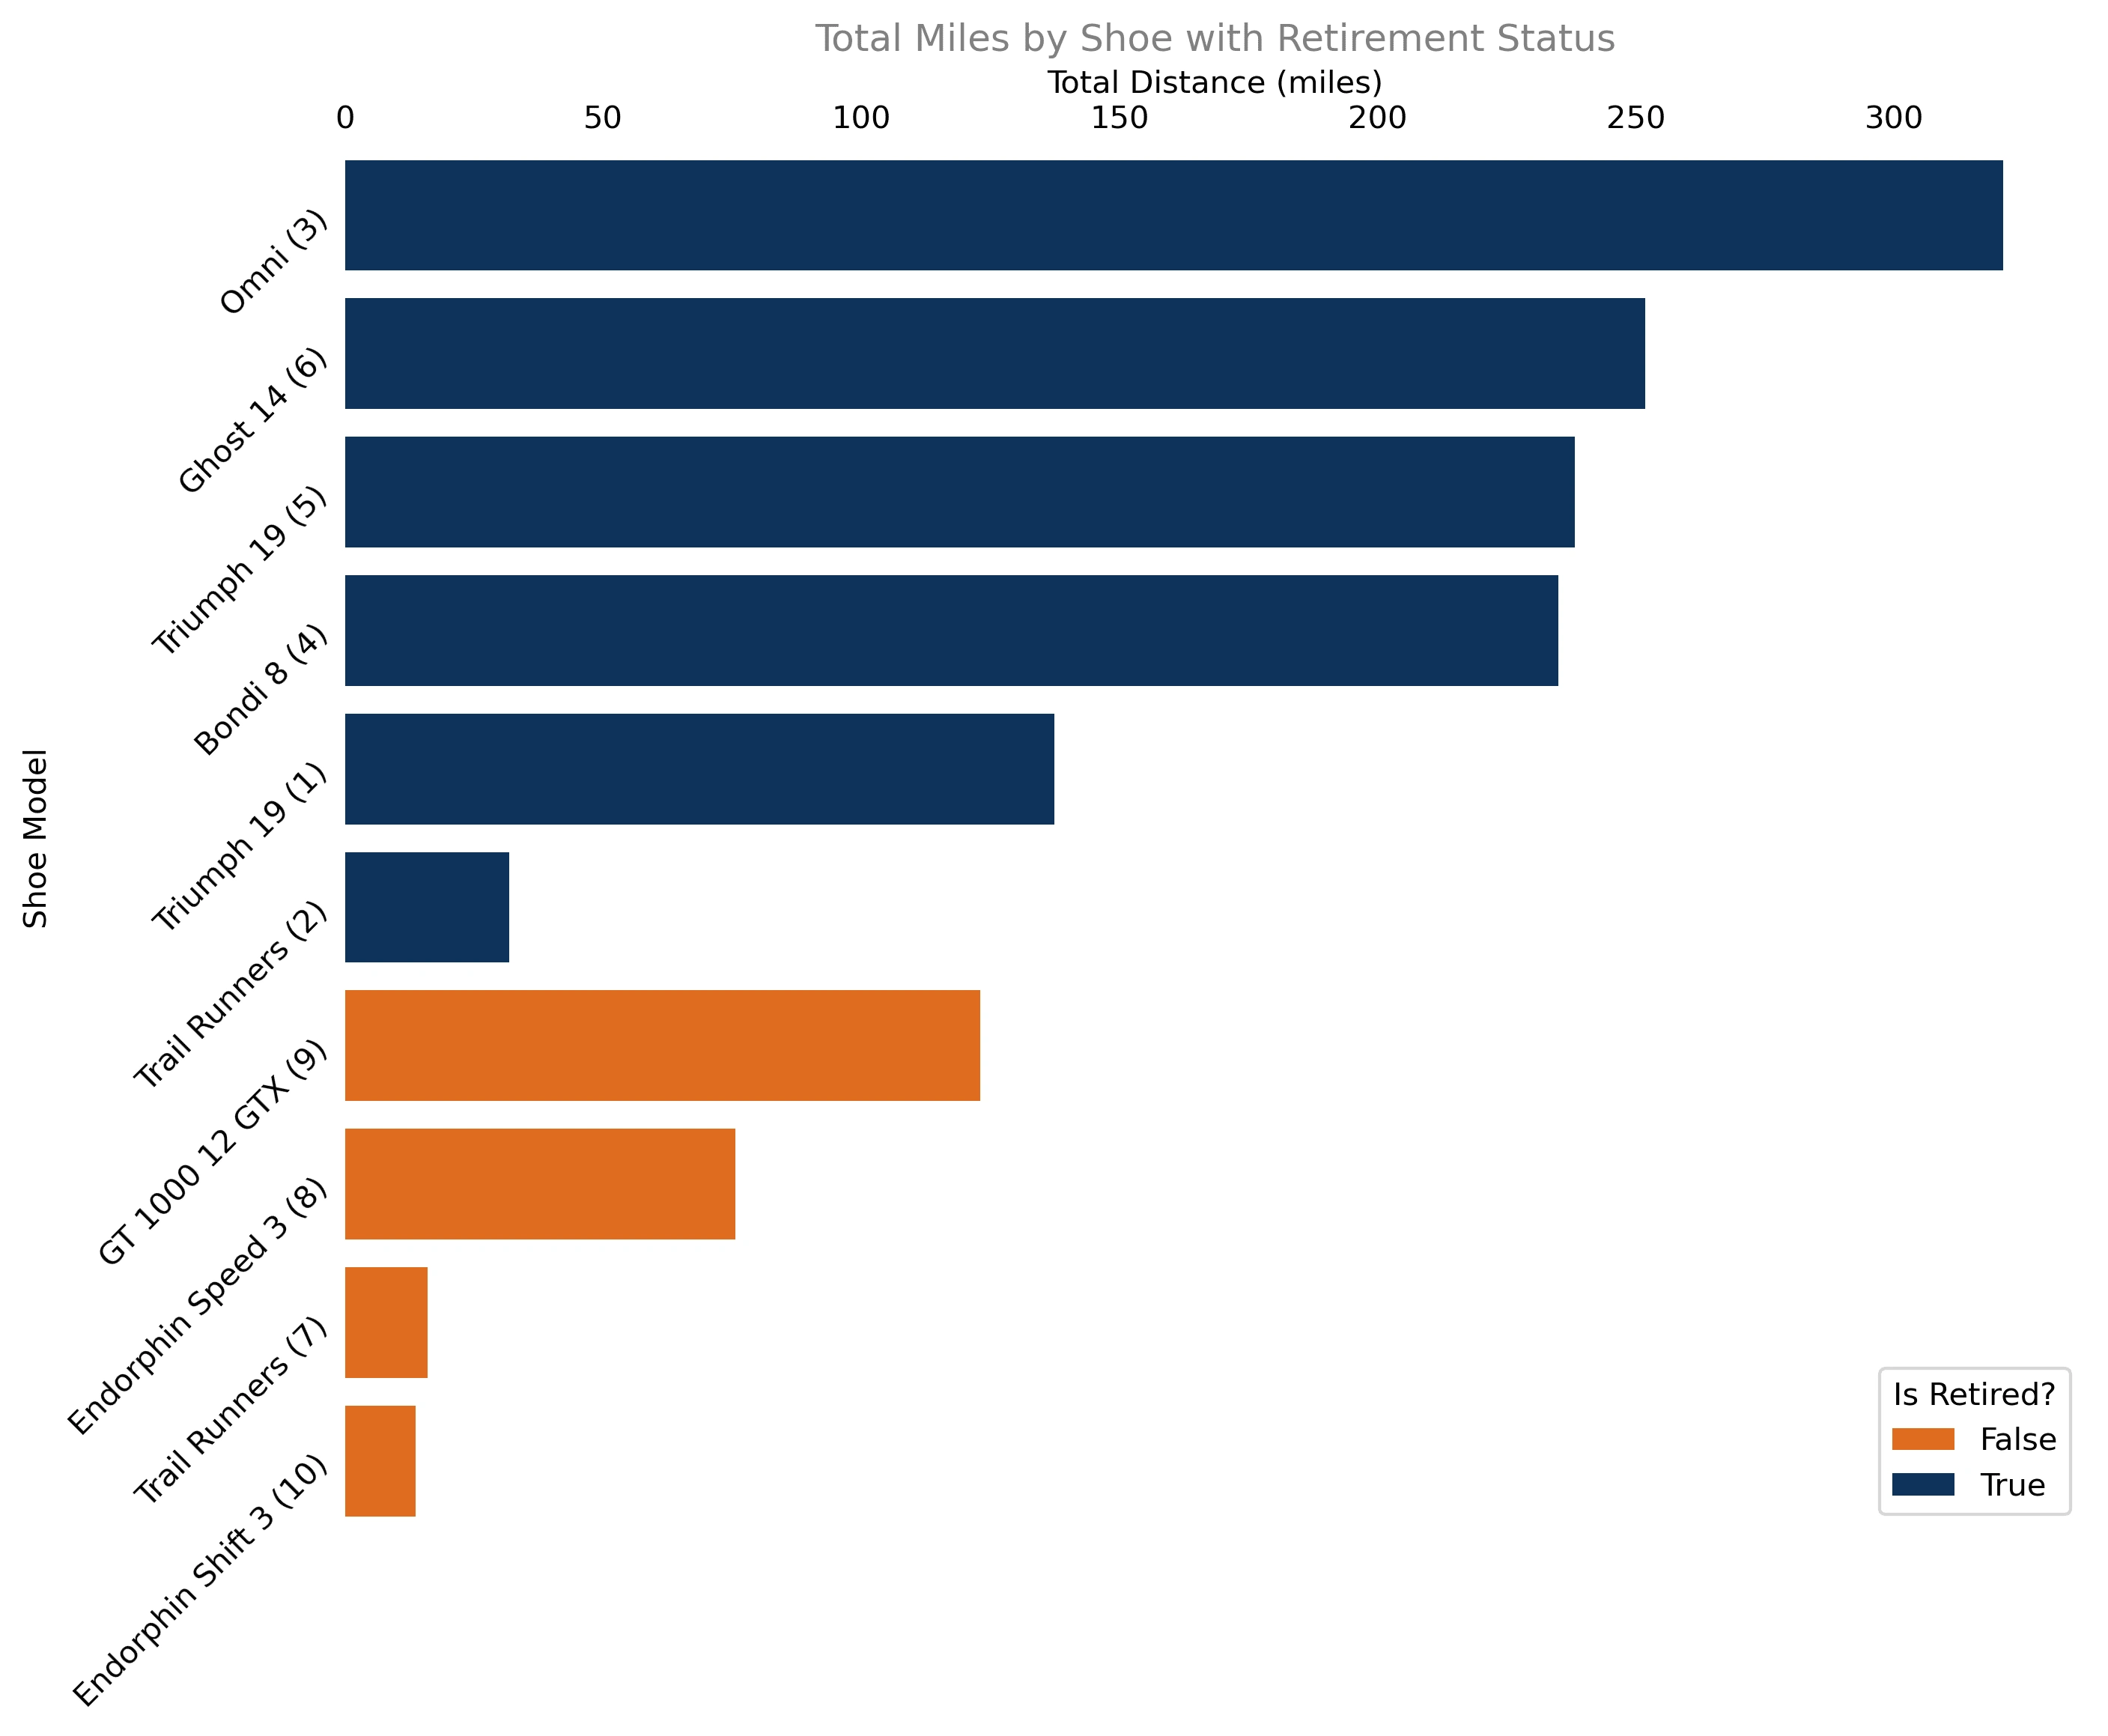
Reflections from Data Visuals
Primarily using Python with Matplotlib and Seaborn, it becomes much more clear of the results from this project.
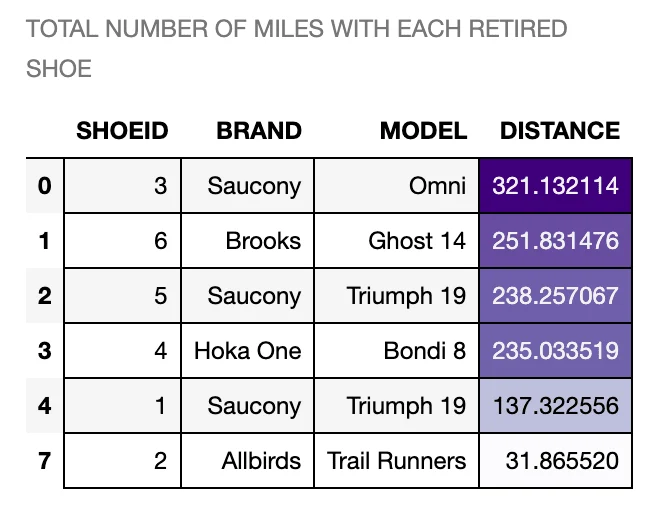
The data can also be visualized using Pandas styling:
The insights from this project extend beyond personal health to influence footwear industry trends, showcasing the impact of data visualization on decision-making. It's personal—it's about the journey, my dog Laika, and how we use data to make better choices. This work illustrates the power of data visualization to uncover insights across various fields. It's about transforming data into stories that drive action and innovation. Through this project, I aim to show clients the value and versatility of data visualization in understanding and shaping both personal interests and industry landscapes.
Are you looking to transform your data into compelling visual stories that drive action? Bliss Wave IT is here to help. My expertise in data visualization and analysis empowers clients to uncover hidden patterns, trends, and insights in their data. Contact me to explore how I can bring your data to life.
Like this project
Posted Mar 22, 2024
Tracking shoe usage with PostgreSQL & data visuals with Python, this project maps out gear usage & insights, blending daily adventures with data visuals.
Likes
0
Views
23