Project Overview Analyzed 110K+ patient appointment

Mohamed Ghanem


Project Overview
Analyzed 110K+ patient appointment records to identify key demographic and behavioral drivers behind clinic attendance and no-shows. Designed an interactive Power BI dashboard tracking a 71.48% baseline attendance rate across 71.95K+ recorded clinic visits.
Key Insights & Dashboard Features
Demographic Drivers: Identified attendance trends across age groups (average patient age: 38.50 years) and gender distribution (66.8% female vs. 33.2% male).
SMS Reminder Impact: Evaluated notification efficiency, revealing higher attendance rates among patients receiving SMS reminders compared to non-recipients.
Geographic & Chronic Risk Profiling: Mapped top neighborhoods with highest no-show counts and evaluated attendance correlation with chronic conditions like Diabetes and Hypertension.
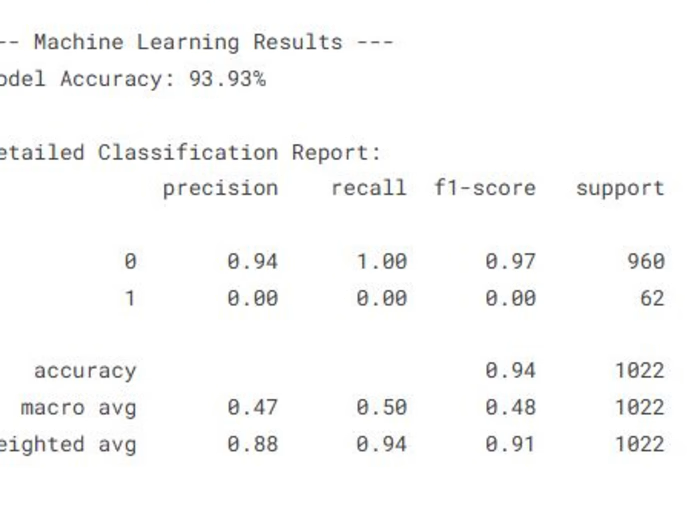
Predictive Modeling: Built machine learning classification models (CatBoost, XGBoost, SMOTE) in Python to predict high-risk no-shows and optimize reminder schedules.
Tools & Technologies
Data Processing & ML: Python (Pandas, Scikit-learn), SMOTE, XGBoost, CatBoost
Visualization & BI: Power BI, DAX, Power Query
you can see the job here[https://www.kaggle.com/code/mohamedmoustfaghanem/hospital-operations ]
Like this project
Posted Sep 2, 2026
Project Overview Analyzed 110K+ patient appointment records to identify key demographic and behavioral drivers behind clinic attendance and no-shows. Designe...
Likes
0
Views
0
Timeline
Mar 15, 2026 - Mar 17, 2026