
Which patients are most likely to be readmitted — and where should a hospital focus its limited follow-up resources?
I analyzed hospital readmission patterns using SQL, Power BI, and DAX, looking at diagnoses, prior readmissions, comorbidity burden, discharge disposition, insurance, demographics, and seasonal trends to identify where readmission risk was concentrated.
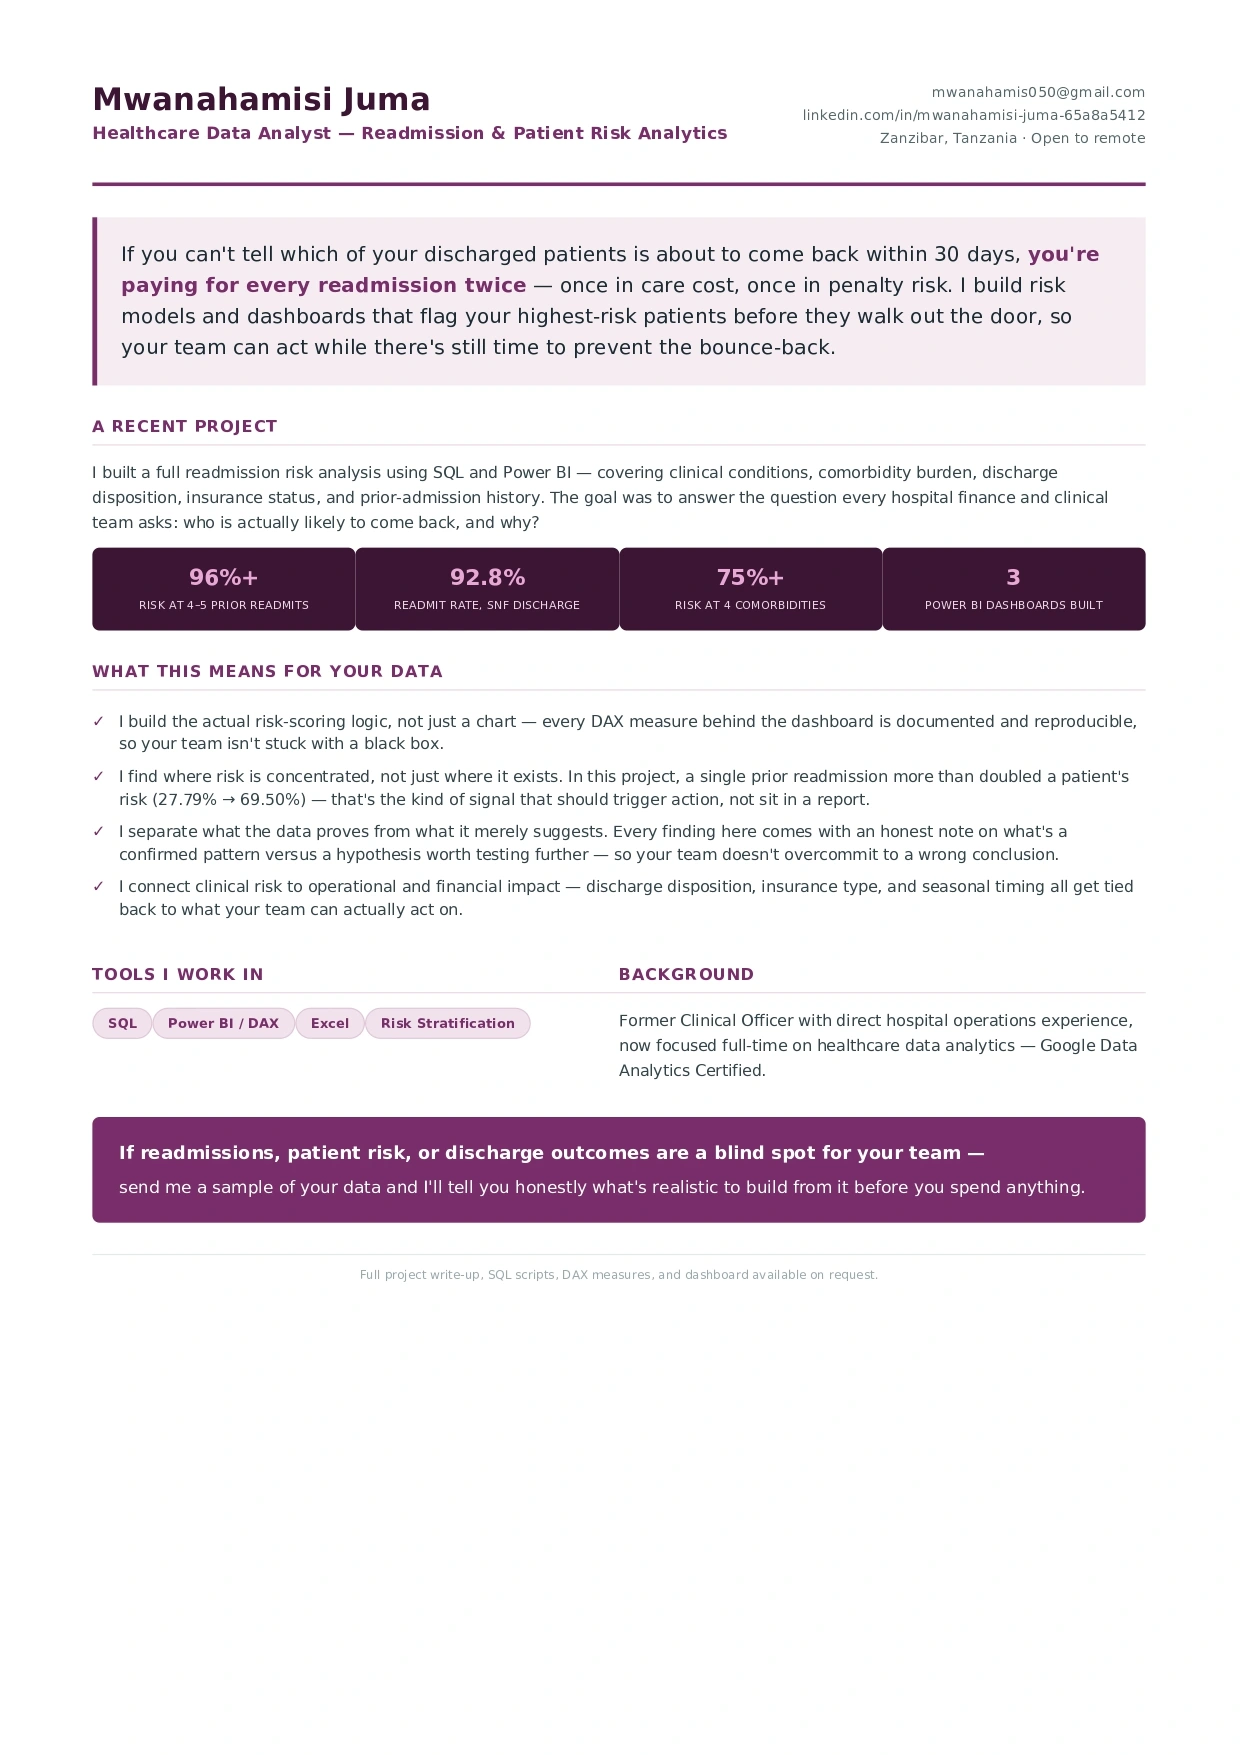
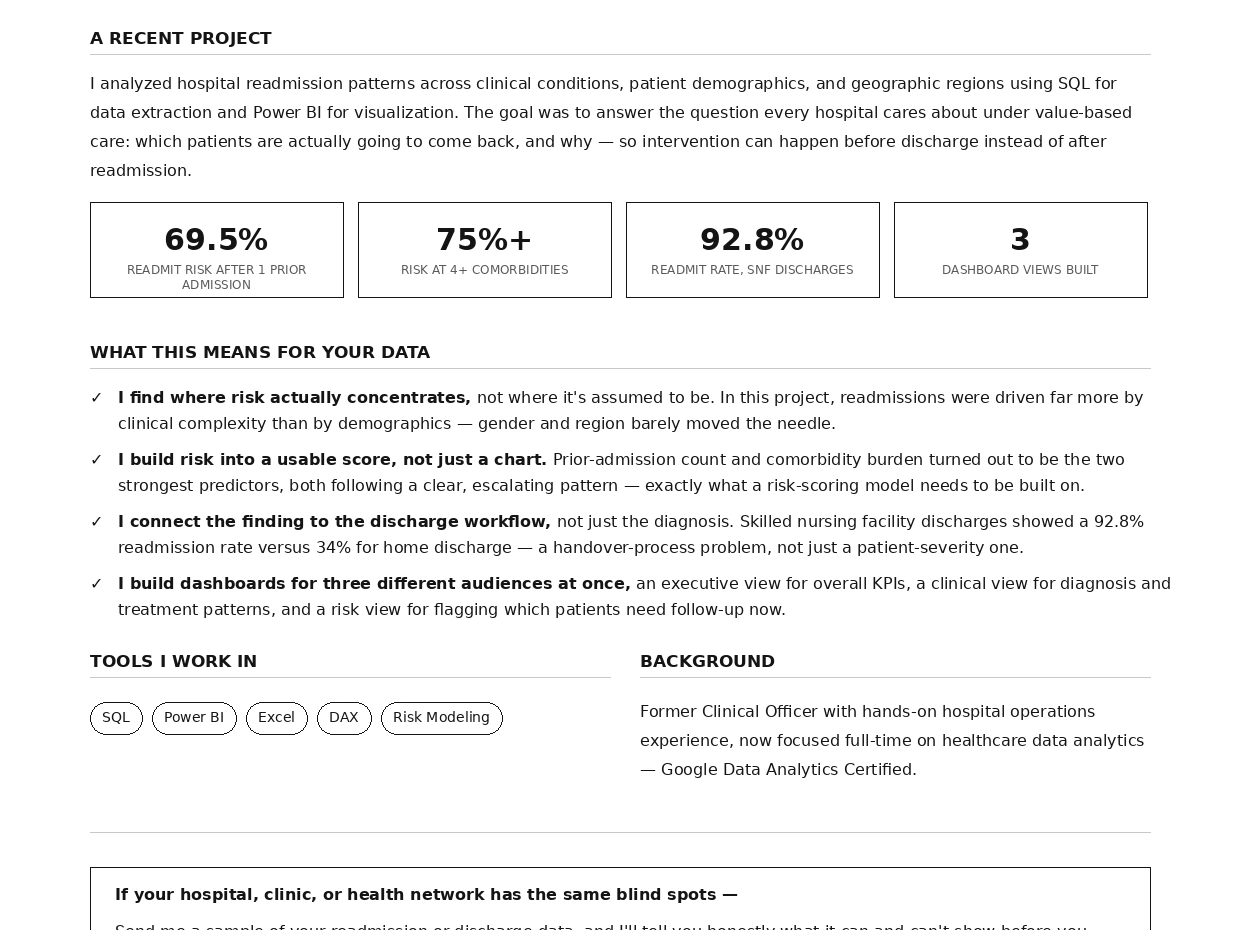
A few things stood out. Patients with no prior readmissions had a 27.79% readmission rate, compared with 69.50% after just one prior readmission. Patients with 4+ comorbidities reached 75.05%+, while high-risk conditions such as sepsis, COPD, heart failure, stroke, and kidney disease showed the highest readmission rates. Skilled nursing facility discharges were also particularly high at 92.80%.
The bigger opportunity was turning those patterns into action. I used the findings to define a practical high-risk flagging approach — prioritizing patients with previous readmissions, high comorbidity burden, high-risk diagnoses, or post-acute care needs for earlier follow-up, medication reconciliation, and stronger discharge coordination.
I built an interactive Power BI dashboard with executive, clinical, and risk-focused views, turning hospital readmission data into something healthcare teams could actually use to prioritize patients and target intervention where it matters most.
Tools: SQL · Power BI · DAX · Excel
0 likes · 0 views · Sep 8, 2026
Which patients are most likely to be readmitted — and where should a hospital focus its limited follow-up resources? I analyzed hospital readmission patterns...


