
What it shows
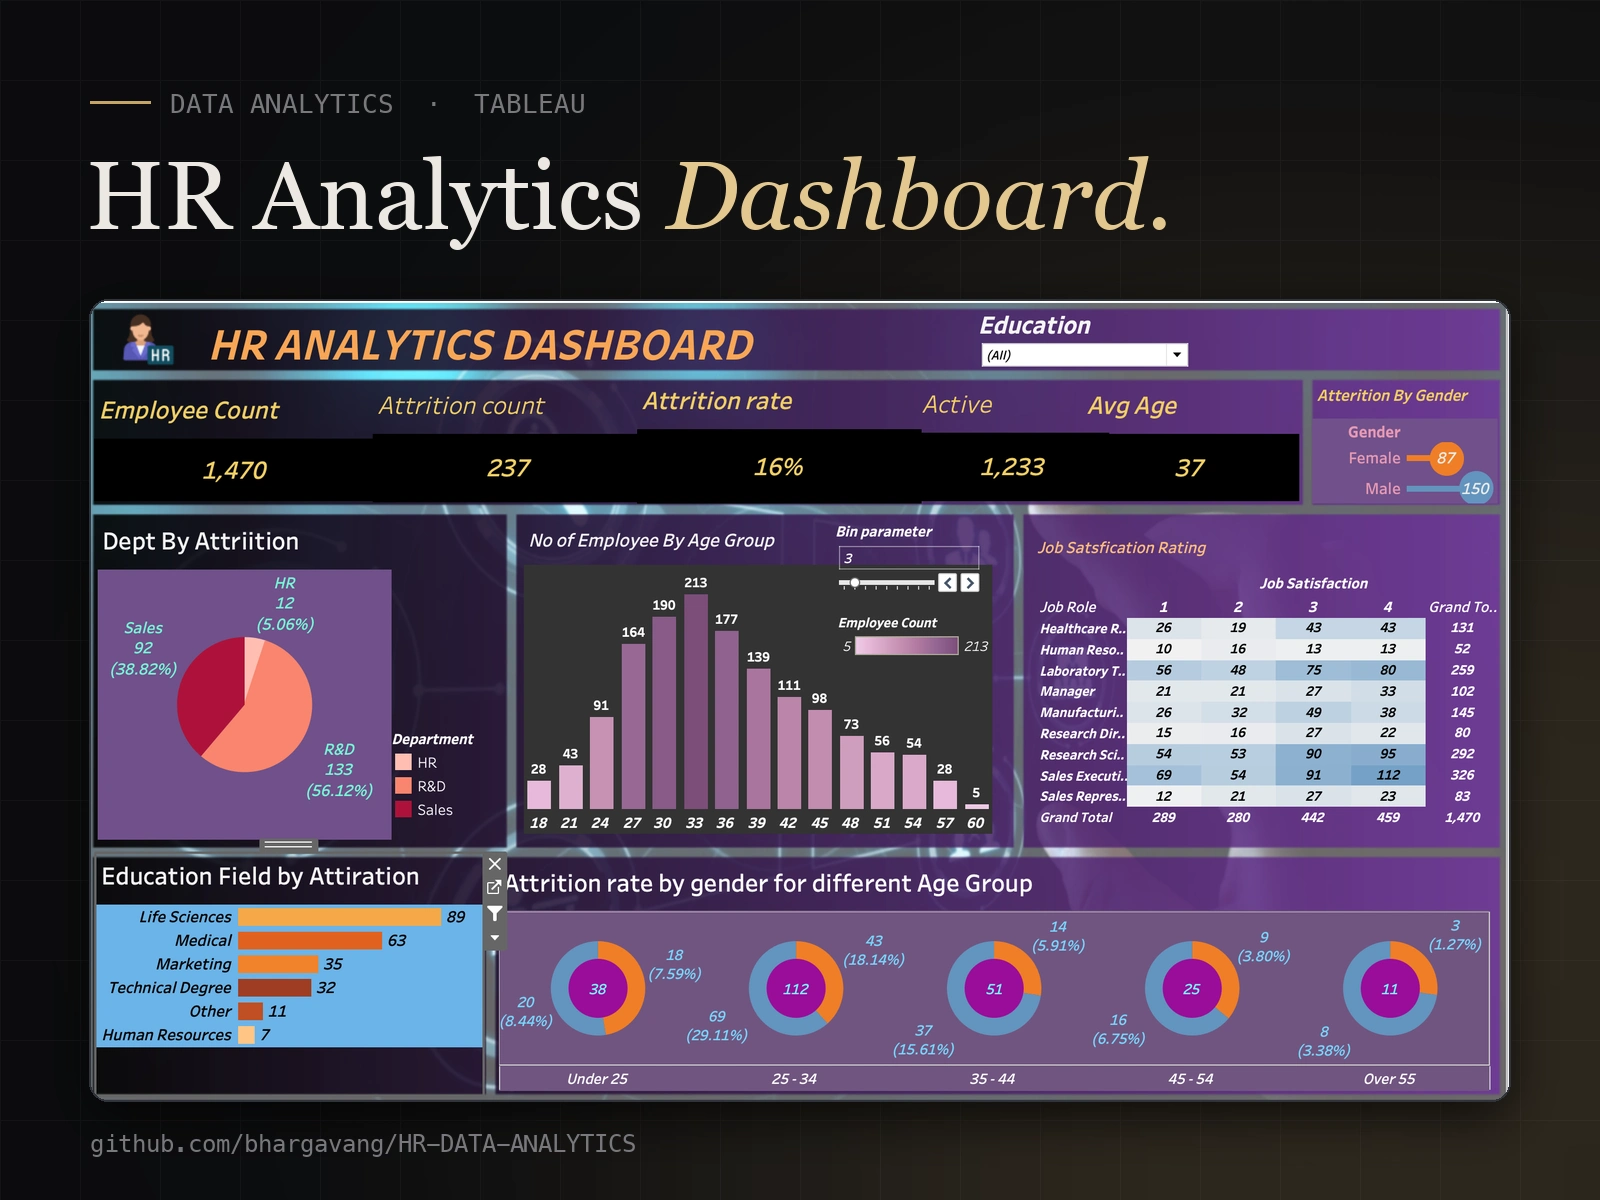
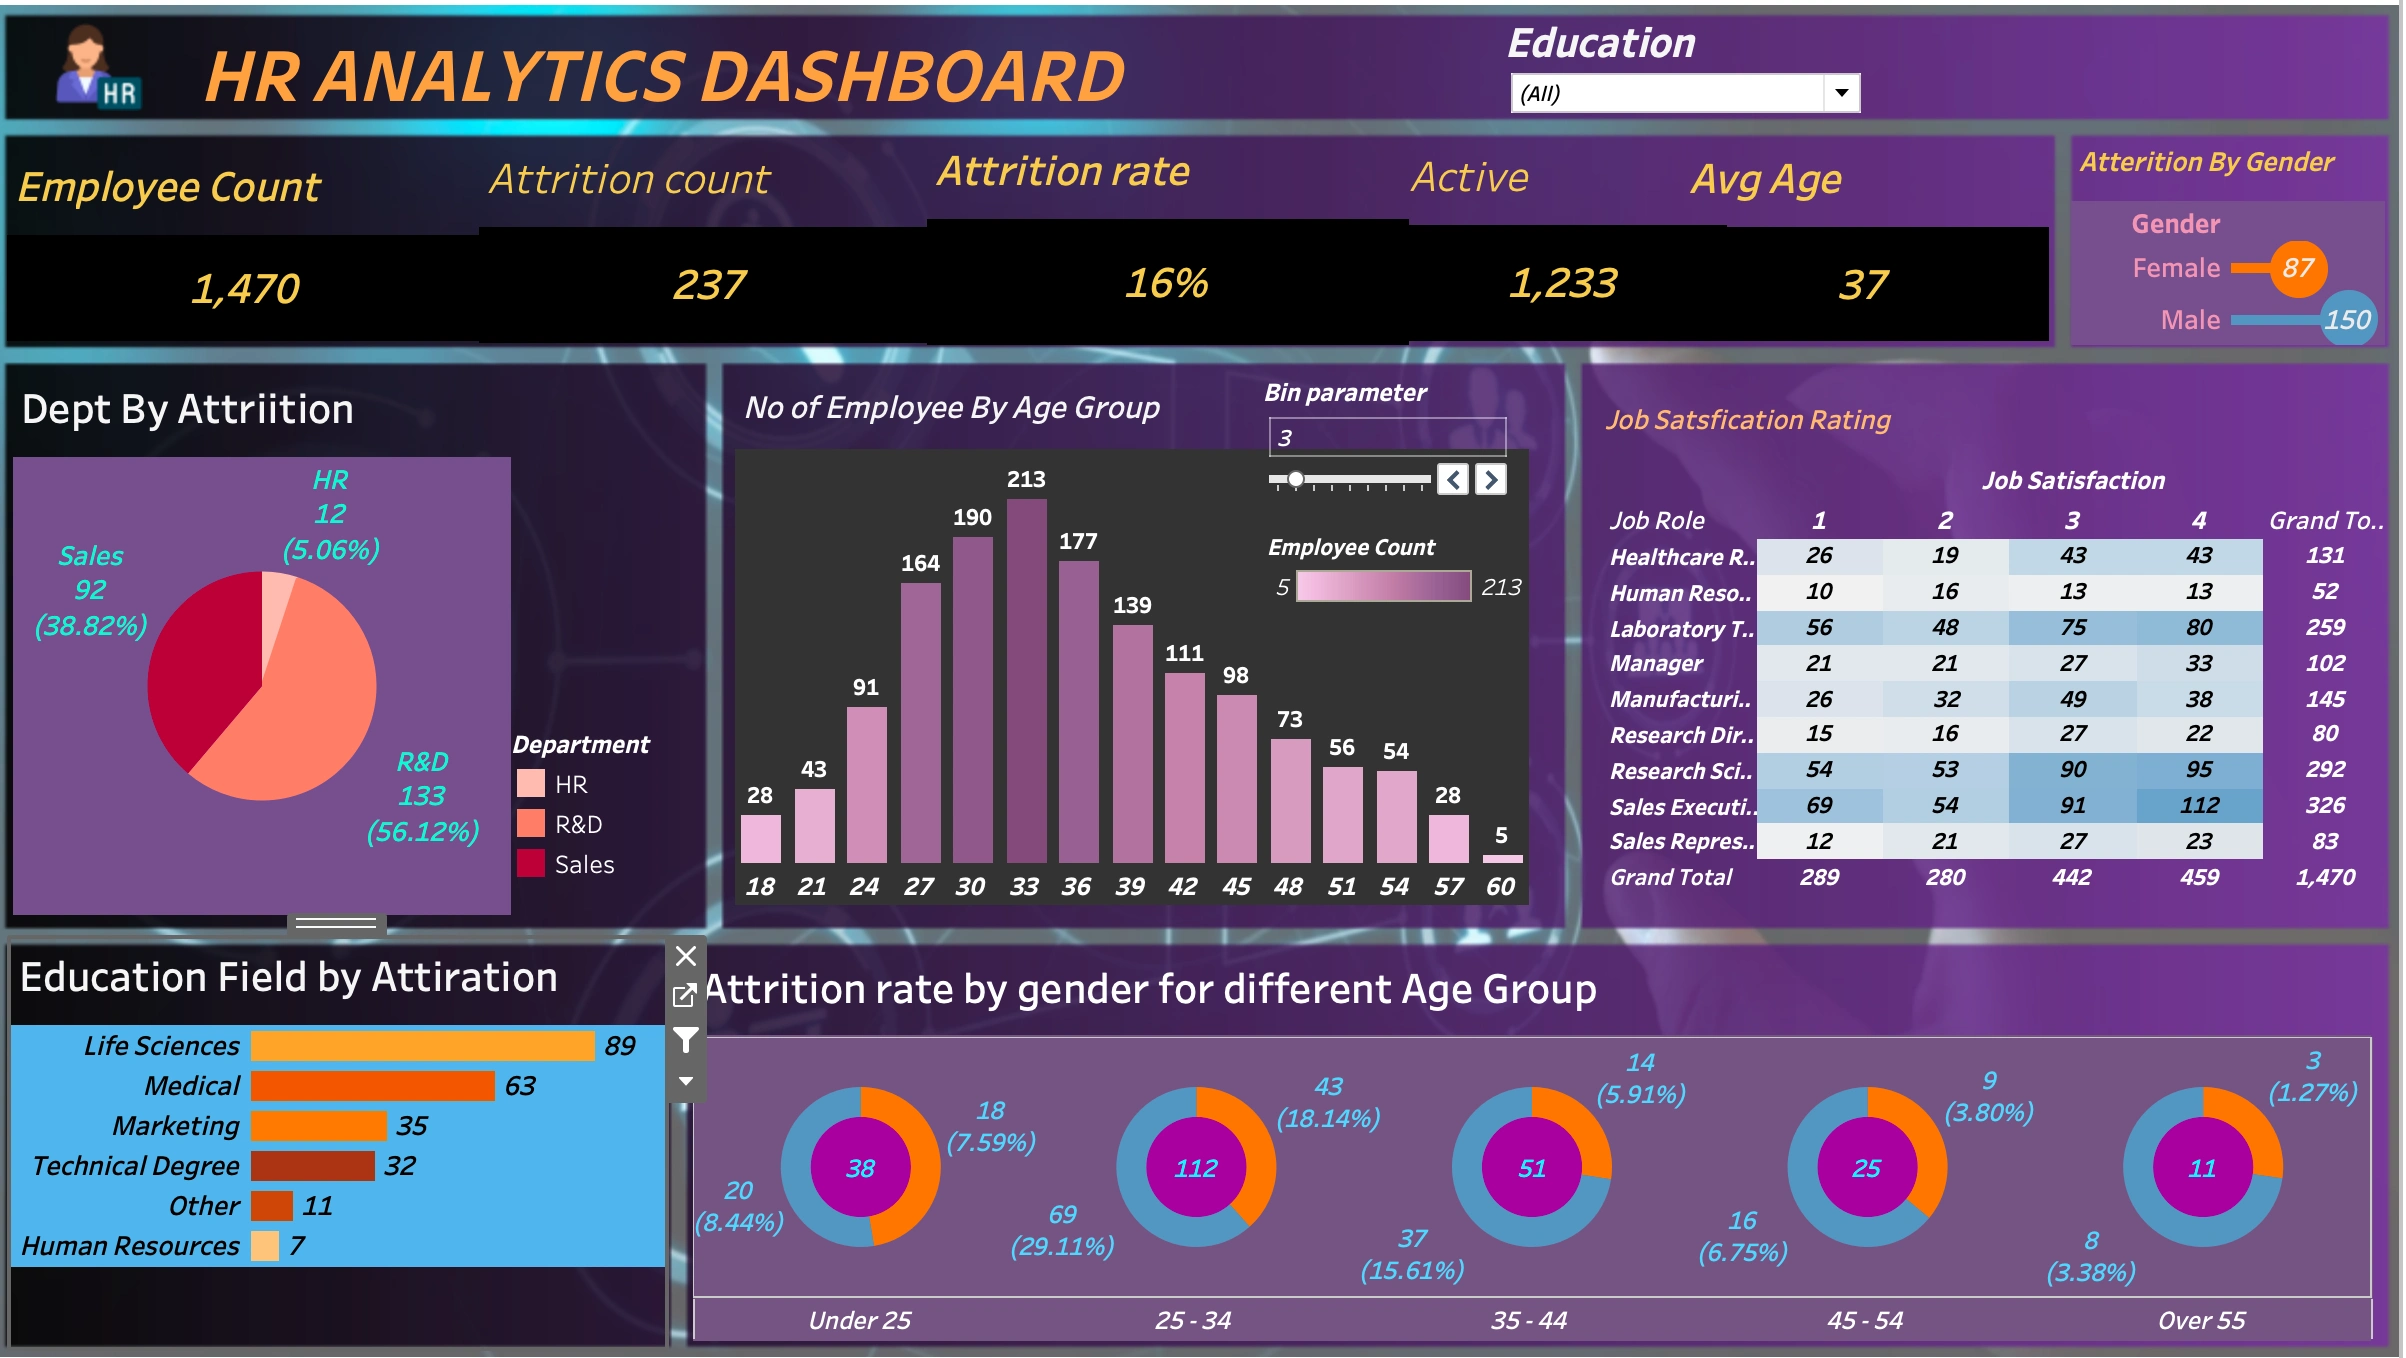
An interactive Tableau dashboard that helps HR teams understand attrition across 1,470 employees — 237 people left, an attrition rate of 16%.
Inside the dashboard
• KPIs for employee count, attrition, active staff and average age
• Attrition by department, gender and education field
• Employees by age group, with an adjustable bin size
• Job satisfaction ratings by job role
• Attrition rate by gender across five age groups
Key insights
• R&D has the most leavers (56% of attrition), followed by Sales (39%)
• The 25–34 age group has the most leavers, 112 of 237
Built with Tableau. Workbook and data on GitHub — github.com/bhargavang/HR-DATA-ANALYTICS
0 likes · 0 views · Nov 9, 2026
Interactive Tableau dashboard tracking attrition across 1,470 employees by department, gender, age group, education and job satisfaction.

