
What it shows
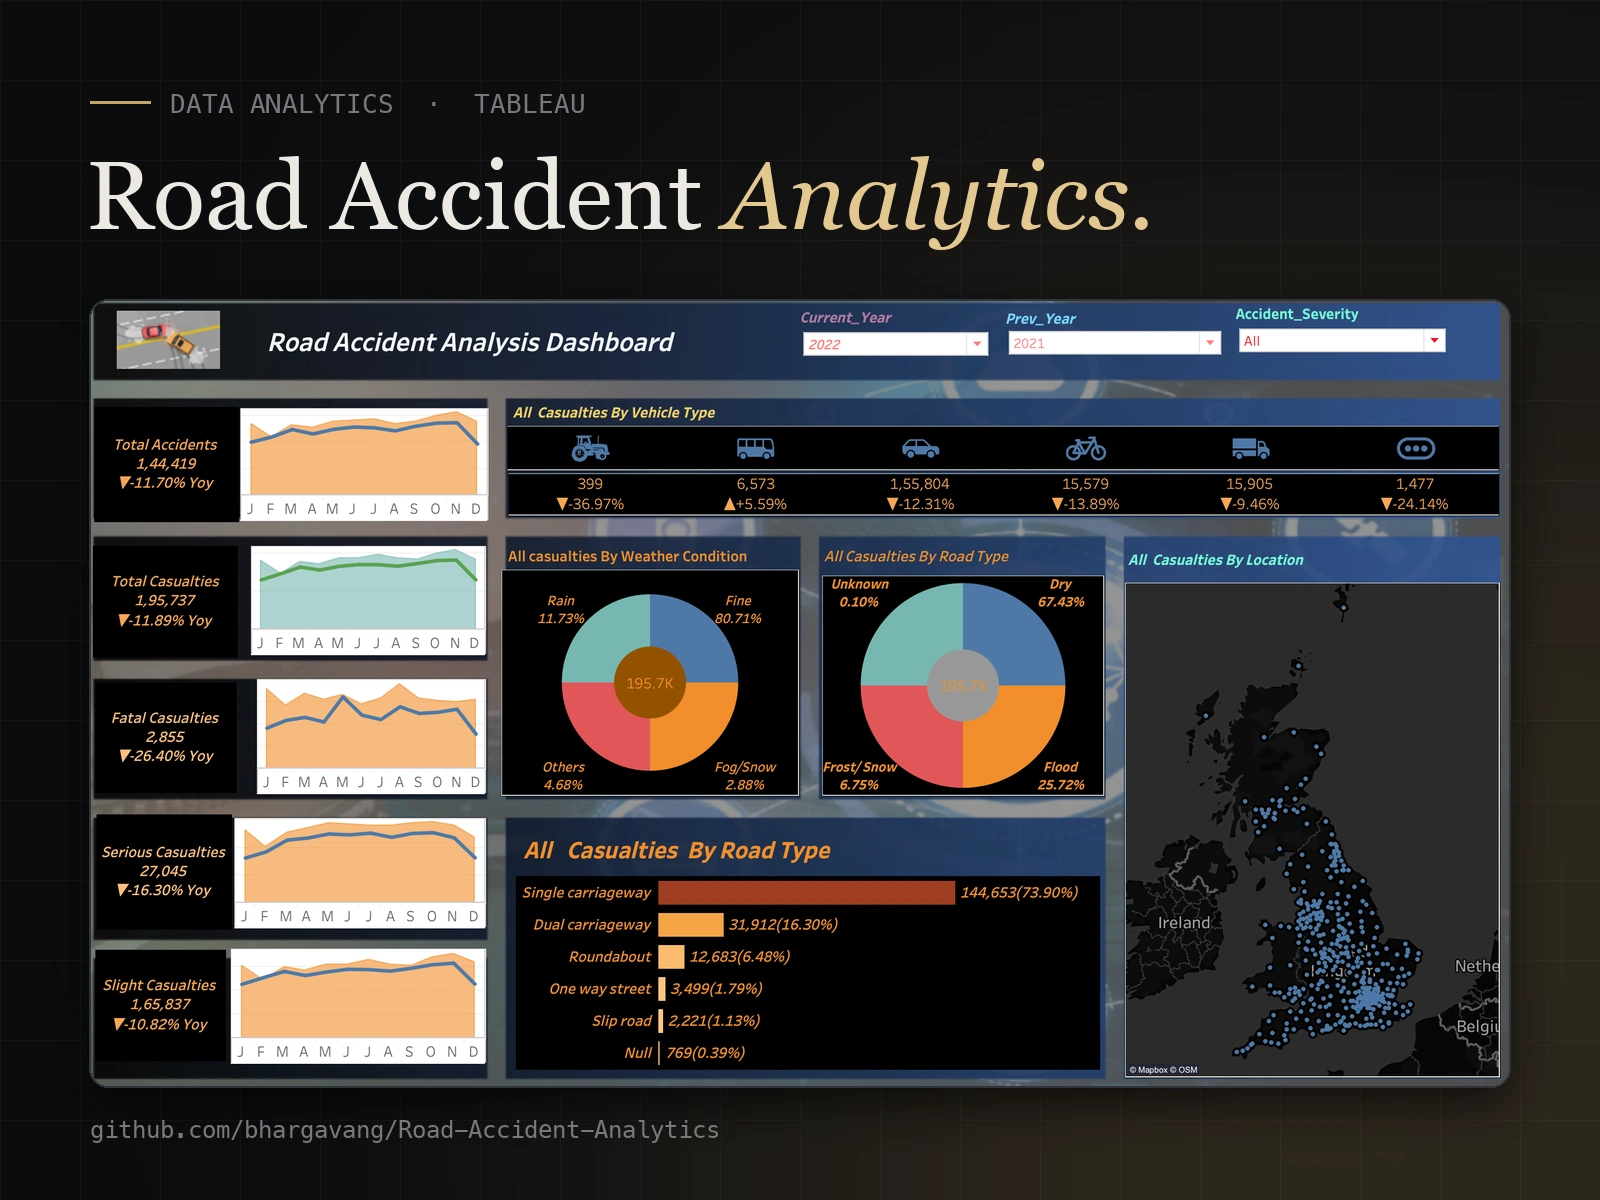
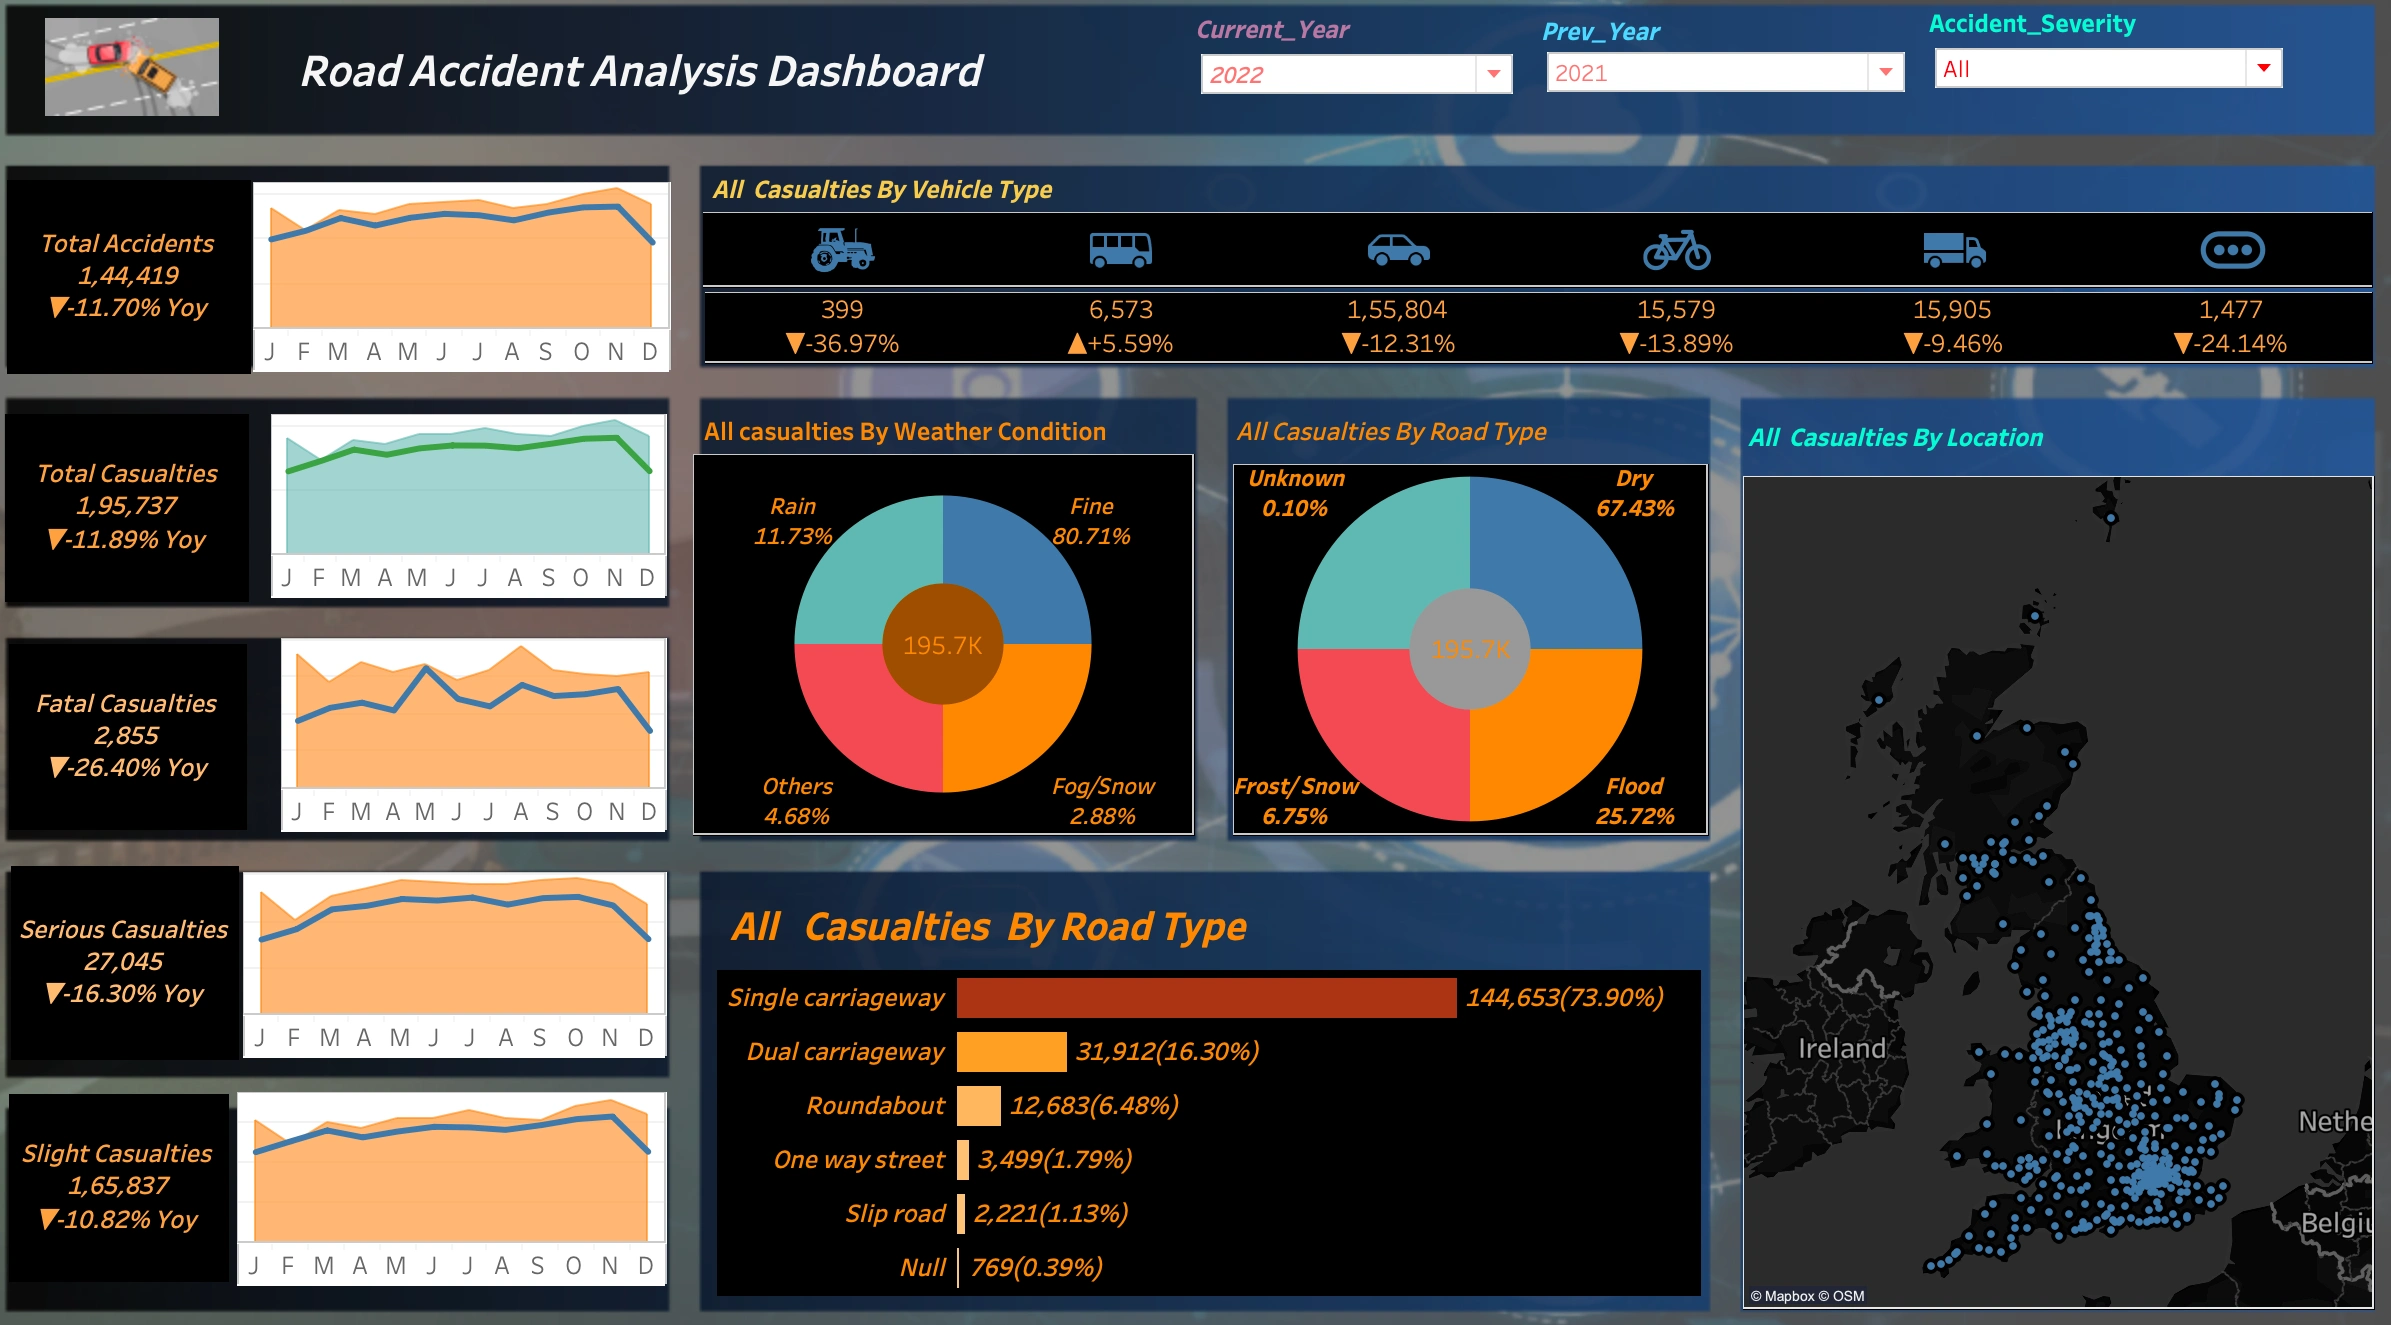
An interactive Tableau dashboard of UK road accident data that compares 2022 with 2021 — 144,419 accidents and 195,737 casualties, with month-by-month trends.
Inside the dashboard
• Year-over-year KPIs for total, fatal, serious and slight casualties
• Casualties by vehicle type, weather and road surface
• Casualties by road type, from single carriageways to slip roads
• A map of accident hotspots
• Filters for year and accident severity
Key insights
• About 81% of casualties happen in fine weather, so human factors matter more than conditions
• Single carriageways account for about 74% of casualties
Built with Tableau. Workbook on GitHub — github.com/bhargavang/Road-Accident-Analytics
0 likes · 0 views · Nov 9, 2026
Interactive Tableau dashboard of 144K UK road accidents with year-over-year trends, weather and road-type breakdowns, and a hotspot map.

