Amazon Sales Analytics – Power BI and Python

Nitu Alam


Amazon_Sales_Analysis
Have to conduct a detailed year-wise analysis of Amazon sales data to understand sales trends by identifying key metrics and other factors and show the meaningful relationship between attributes.
𝗜𝗻𝘀𝗶𝗴𝗵𝘁𝘀:
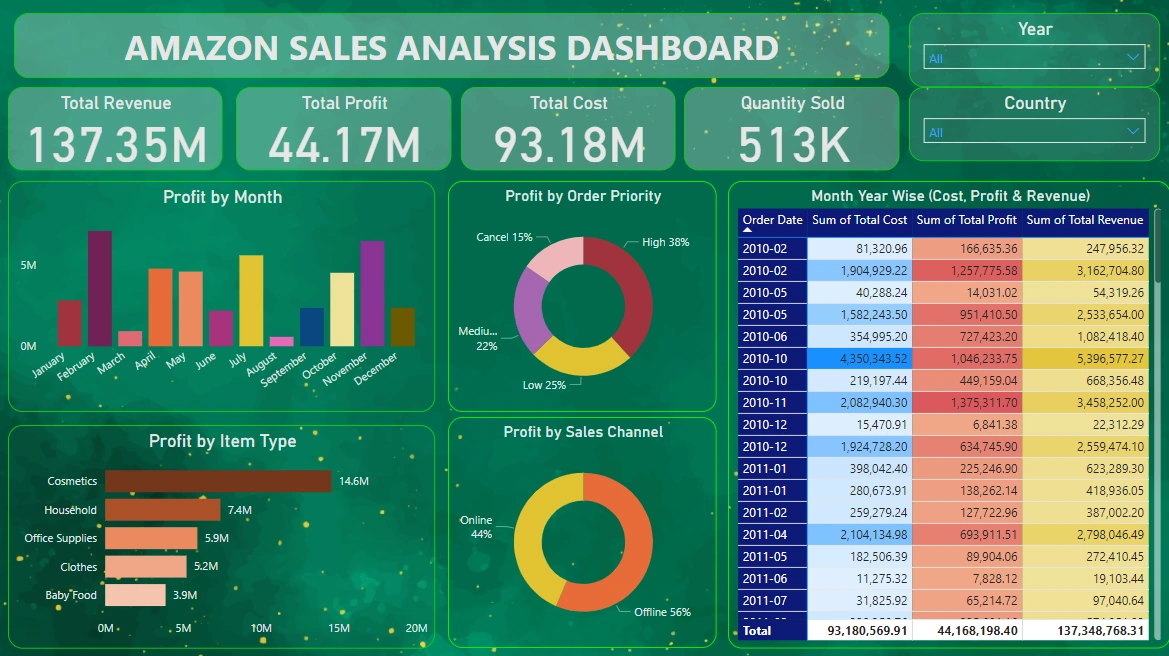
⦿ Top 5 Gross Profit Margin Categories:
Cosmetics, Households, Office Supplies, Clothes, and Baby Food are the top-performing categories in terms of gross profit margin.
⦿ Profit Percentage by Sales Channels:
Online sales contribute to 44% of the total profit, while offline sales contribute to the remaining 56%
⦿ Profit Percentage by Customer Preferences:
High-priority customer preferences generate 38% of the total profit, followed by the least priority (25%), medium (22%), and cancels (15%).
⦿ Monthly Trends:
February, July, and November exhibit the highest number of orders, while March, June, and August show the Lowest order volumes.
⦿ Profit Percentage by Regions:
Europe and Sub-Saharan Africa are the most profitable regions, contributing 25% and 28% respectively to the total profit. Other significant regions include Asia (14%), Australia and Oceania (11%), Central America and the Caribbean (6%), and Middle East & North America (13%).
⦿ Most Profitable Countries:
Djibouti and Myanmar emerge as the most profitable countries within the regions analyzed.
𝗧𝗼𝗼𝗹𝘀 𝗮𝗻𝗱 𝗧𝗲𝗰𝗵𝗻𝗼𝗹𝗼𝗴𝗶𝗲𝘀:
Python
PowerBI
Canva
𝗣𝗿𝗲𝘀𝗲𝗻𝘁𝗮𝘁𝗶𝗼𝗻 𝗟𝗶𝗻𝗸: https://rb.gy/tjhgua
𝗗𝗮𝘀𝗵𝗯𝗼𝗮𝗿𝗱 𝗟𝗶𝗻𝗸: https://project.novypro.com/myWUP2
Like this project
Posted Sep 13, 2026
Analyzed Amazon sales data using Python and Power BI to clean records, identify trends, compare product performance and build an interactive dashboard.
Likes
1
Views
1
Timeline
Feb 10, 2025 - Feb 15, 2025
Clients
Amazon