Reddit Trends Dashboard Development
Tim Green
Case Study: Reddit Trends Dashboard
Real-Time Community Intelligence at Your Fingertips
Project Overview
Client: Self-initiated proof-of-concept
Timeline: Rapid prototype to production deployment
Role: Sole designer and full-stack developer
Technologies: React, TypeScript, Tailwind CSS, shadcn/ui, Recharts, Docker, nginx
Live Demo: reddittrends.rawveg.co.uk
The Problem
Reddit hosts some of the most valuable real-time conversation data on the internet. Across thousands of communities, discussions emerge, gain momentum, and fade in patterns that reveal genuine public sentiment, emerging trends, and topic relationships. But accessing these insights typically requires either expensive enterprise tools or building custom analytics infrastructure from scratch.
I wanted to demonstrate that sophisticated community intelligence dashboards could be prototyped rapidly without sacrificing depth of analysis or quality of experience. The goal was a working application that could track sentiment, visualise engagement patterns, and surface actionable insights from live Reddit data.
The Solution
Reddit Trends Dashboard is a comprehensive analytics platform that transforms raw Reddit activity into meaningful intelligence through interactive visualisations, sentiment analysis, and predictive metrics.
Beyond Surface-Level Analytics:
This is not a simple feed reader. The dashboard processes live data from twelve monitored subreddits spanning technology, science, politics, gaming, cryptocurrency, and environmental topics. Each post receives sentiment scoring, engagement tracking, and relationship mapping to surface patterns invisible in raw data.
Production-Ready Architecture:
The application ships with Docker containerisation, multi-stage builds for optimised image sizes, nginx configuration for production serving, and health check endpoints. This is prototype work that deploys like production software.
Intelligent API Handling:
Reddit's API has strict rate limits. The dashboard implements exponential backoff, automatic retry logic, and user feedback mechanisms that gracefully handle throttling without degrading the experience.
Reddit Trends Dashboard Functional Concept
Technical Implementation
Frontend Architecture:
React 18 with TypeScript provides the foundation, ensuring type safety throughout the codebase. Tailwind CSS paired with shadcn/ui components enables rapid, consistent interface development. Recharts powers the visualisation layer, delivering interactive charts that respond to user exploration.
Vite handles the build pipeline, providing fast hot module replacement during development and optimised production bundles for deployment.
Data Processing Layer:
The application fetches from Reddit's public JSON endpoints, processing hot posts and search results across multiple subreddits simultaneously. A custom service layer handles request orchestration, implements rate limiting with minimum two-second intervals between requests, and manages error recovery with exponential backoff.
Sentiment analysis scores each post and aggregates results across time periods, communities, and topics. The processing happens client-side, eliminating backend infrastructure requirements whilst still delivering meaningful analysis.
Containerisation Strategy:
Docker deployment uses multi-stage builds. The builder stage installs dependencies and compiles the React application. The production stage serves the built assets through Alpine-based nginx, resulting in lightweight, secure containers with built-in health monitoring.
Docker Compose configuration supports both development and production scenarios, with options for reverse proxy integration and Kubernetes deployment patterns documented for enterprise scaling.
Dashboard Capabilities
Core Analytics Suite:
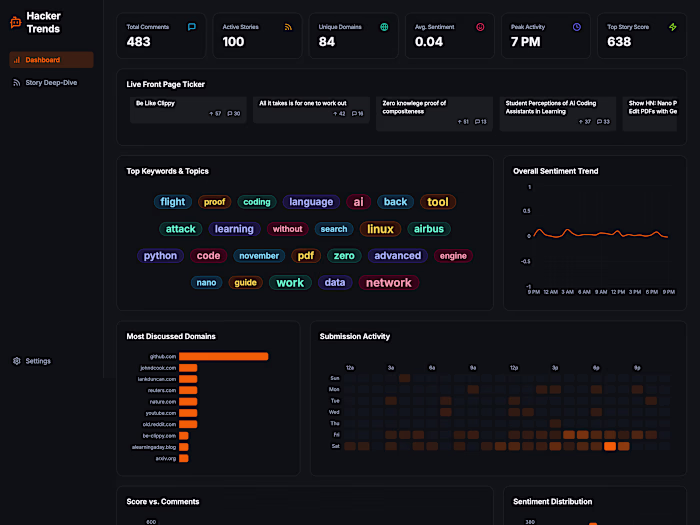
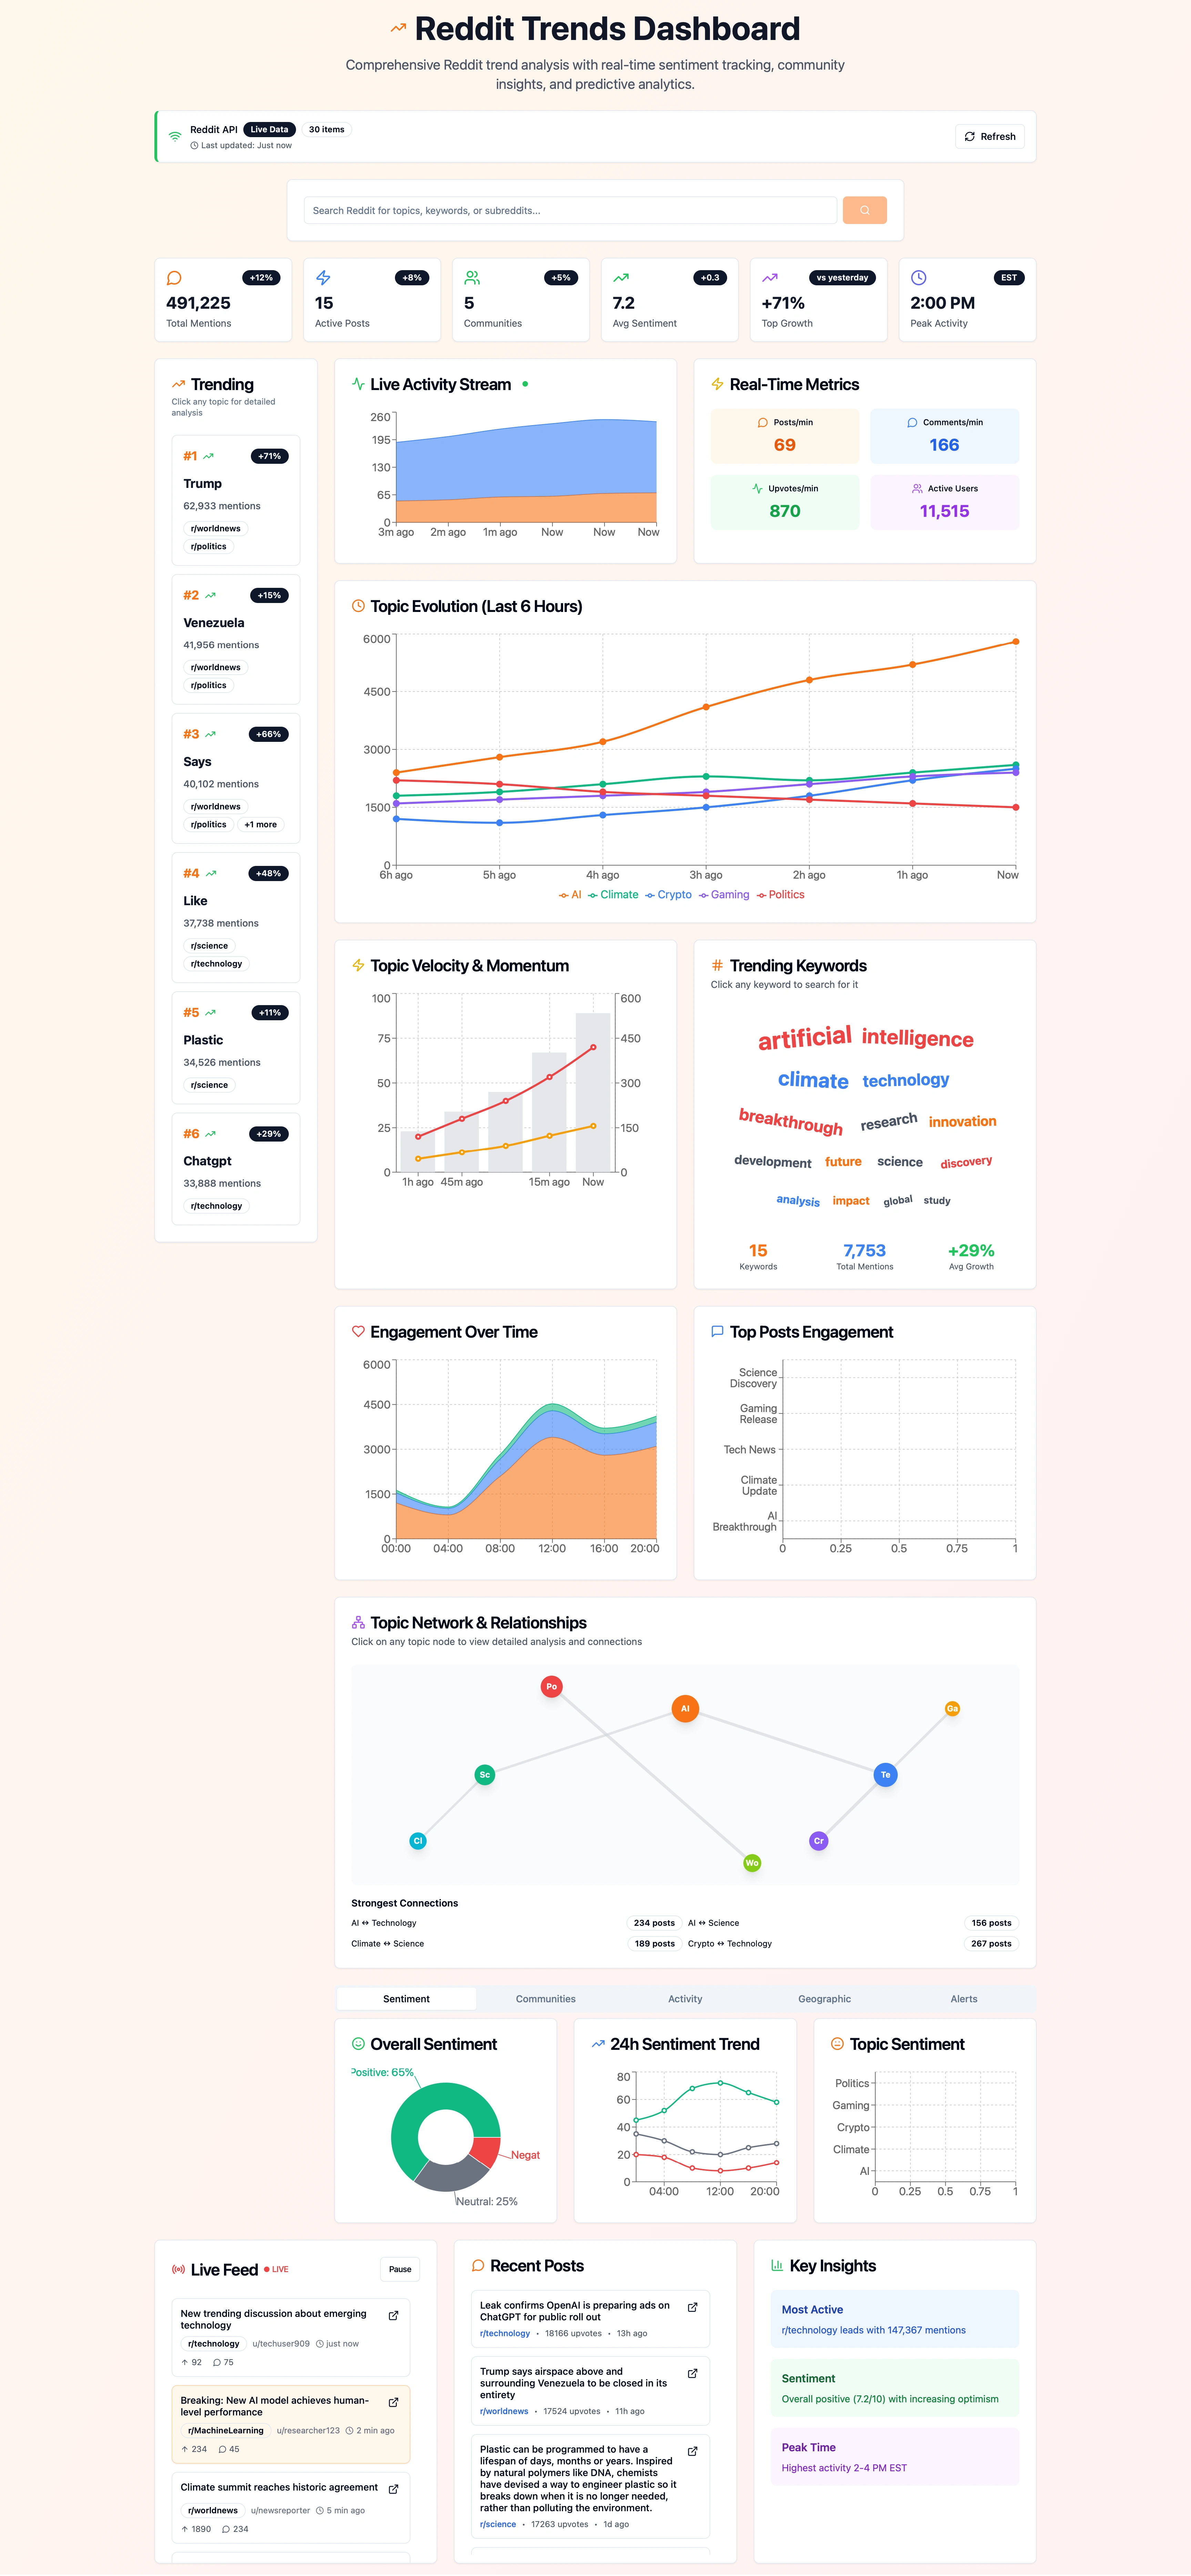
The header metrics provide immediate overview: total mentions, post counts, community distribution, and aggregate sentiment. These numbers update as fresh data arrives, giving users constant awareness of current state.
Advanced Visualisations:
Topic Evolution charts track how discussions develop over time, revealing whether interest is growing, plateauing, or declining. Activity Heatmaps show posting patterns by day and hour, identifying optimal timing for engagement. Network Graphs expose relationships between topics and communities, surfacing unexpected connections.
Velocity and Momentum metrics quantify how quickly topics gain traction, distinguishing flash-in-the-pan spikes from sustained interest. Keyword Clouds identify trending terminology, with each word clickable for deeper exploration.
Interactive Exploration:
The dashboard rewards curiosity. Click any keyword to search related content. Click communities in the distribution chart to filter by subreddit. Click data points in timeline charts to drill into specific time periods. Every visualisation serves as a navigation element.
Smart Search:
The search system provides comprehensive analytics for any query. Enter a topic and receive sentiment breakdown, community distribution, engagement metrics, and related keyword suggestions. Search results integrate seamlessly with the visualisation layer.
Alert Configuration:
Users can establish monitoring thresholds for specific keywords. When mention counts exceed configured limits, the alert system provides notification. This transforms passive observation into active intelligence gathering.
Results and Demonstration Value
The dashboard successfully demonstrates that sophisticated community analytics can be delivered through rapid prototyping without enterprise budgets or extended timelines. Live data processing, sentiment analysis, interactive visualisation, and production deployment are all achievable within compressed development cycles.
The containerised deployment approach proves that prototype work can ship with production-grade infrastructure. Health checks, optimised serving, and documented scaling patterns mean the gap between "working demo" and "deployed product" effectively disappears.
Key Challenges Overcome
Challenge: Reddit's rate limiting can aggressively throttle requests, potentially breaking the user experience during peak usage.
Solution: Implemented intelligent request management with minimum intervals between calls, exponential backoff on throttling responses, automatic retry with increasing delays, and transparent user feedback showing rate limit status. The dashboard degrades gracefully rather than failing catastrophically.
Challenge: Client-side sentiment analysis risks performance degradation with large datasets.
Solution: Processing is optimised for the browser environment, with aggregation happening incrementally as data arrives. The interface remains responsive even whilst analysing hundreds of posts across multiple communities.
Challenge: Containerised deployment often introduces complexity that undermines the "rapid prototype" philosophy.
Solution: Multi-stage Docker builds keep the final image lightweight. Pre-configured Docker Compose files handle common deployment scenarios. Documentation covers VPS deployment, reverse proxy integration, and Kubernetes patterns. The containerisation adds capability without adding friction.
What This Demonstrates
Dashboard Development Expertise: From data ingestion through processing to interactive visualisation, this project covers the complete analytics dashboard pipeline. The patterns established here transfer directly to any data source requiring similar treatment.
Graceful Degradation Design: Real-world APIs have constraints. Building systems that handle those constraints elegantly, maintaining user experience even under adverse conditions, distinguishes production-quality work from fragile demos.
Deployment-Ready Prototyping: The Docker configuration, health checks, and scaling documentation prove that rapid development need not sacrifice operational readiness. Prototypes can ship like products when built with deployment in mind from the start.
Visual Design Sensibility: The dashboard is genuinely pleasant to use. Dark theme, clean typography, intuitive interactions, responsive layout. Technical capability and aesthetic awareness working together.
Engagement Opportunities
If you're looking to:
Build analytics dashboards for your own data sources or APIs
Create community monitoring tools for brand intelligence or market research
Develop internal dashboards with real-time data processing
Prototype data visualisation applications rapidly with production-ready infrastructure
This project demonstrates the approach. Sophisticated analysis, polished experience, containerised deployment, live and accessible. Let's discuss what we could build to unlock insights from your data.
Project Links:
Live Demo: reddittrends.rawveg.co.uk
GitHub Repository: github.com/rawveg/reddit-trends-dashboard
Like this project
Posted Nov 30, 2025
Developed Reddit Trends Dashboard for real-time community intelligence.