Hacker Trends: Real-Time Analytics and Sentiment Analysis
Tim Green
Case Study: Hacker Trends
From Concept to Deployed Dashboard in Record Time
Project Overview
Client: Self-initiated proof-of-concept
Timeline: Rapid prototype to production deployment
Role: Sole designer and full-stack developer
Technologies: React, TypeScript, Tailwind CSS, Supabase Edge Functions, Recharts, Vercel
Live Demo: hackertrends.rawveg.co.uk
The Problem
Hacker News generates enormous volumes of valuable signal: trending topics, community sentiment, emerging technologies, domain authority patterns, but accessing these insights requires either manual monitoring or building custom tooling from scratch.
I wanted to demonstrate how quickly a sophisticated, real-time analytics dashboard could move from idea to deployed product. Not a wireframe. Not a static mockup. A fully functional application with live data, AI-powered analysis, and polished user experience: the kind of proof-of-concept that answers "could we build this?" with "we already have."
The Solution
Hacker Trends is a real-time analytics and sentiment analysis dashboard that transforms raw Hacker News data into actionable insights through beautiful, interactive visualisations.
What Makes This More Than a Demo:
Live Data, Not Fixtures: The dashboard pulls real-time data from the Hacker News API, processes it through Supabase Edge Functions, and presents genuinely current insights.
AI-Powered Sentiment Analysis: Comments aren't just displayed: they're analysed for sentiment, enabling trend tracking and domain-based reputation analysis.
Production-Grade UX: Dark/light theming, responsive design across all breakpoints, smooth animations, customisable settings. This feels like a product, not a prototype.
Deployed and Accessible: Live on Vercel, publicly accessible, demonstrating the complete journey from code to production.
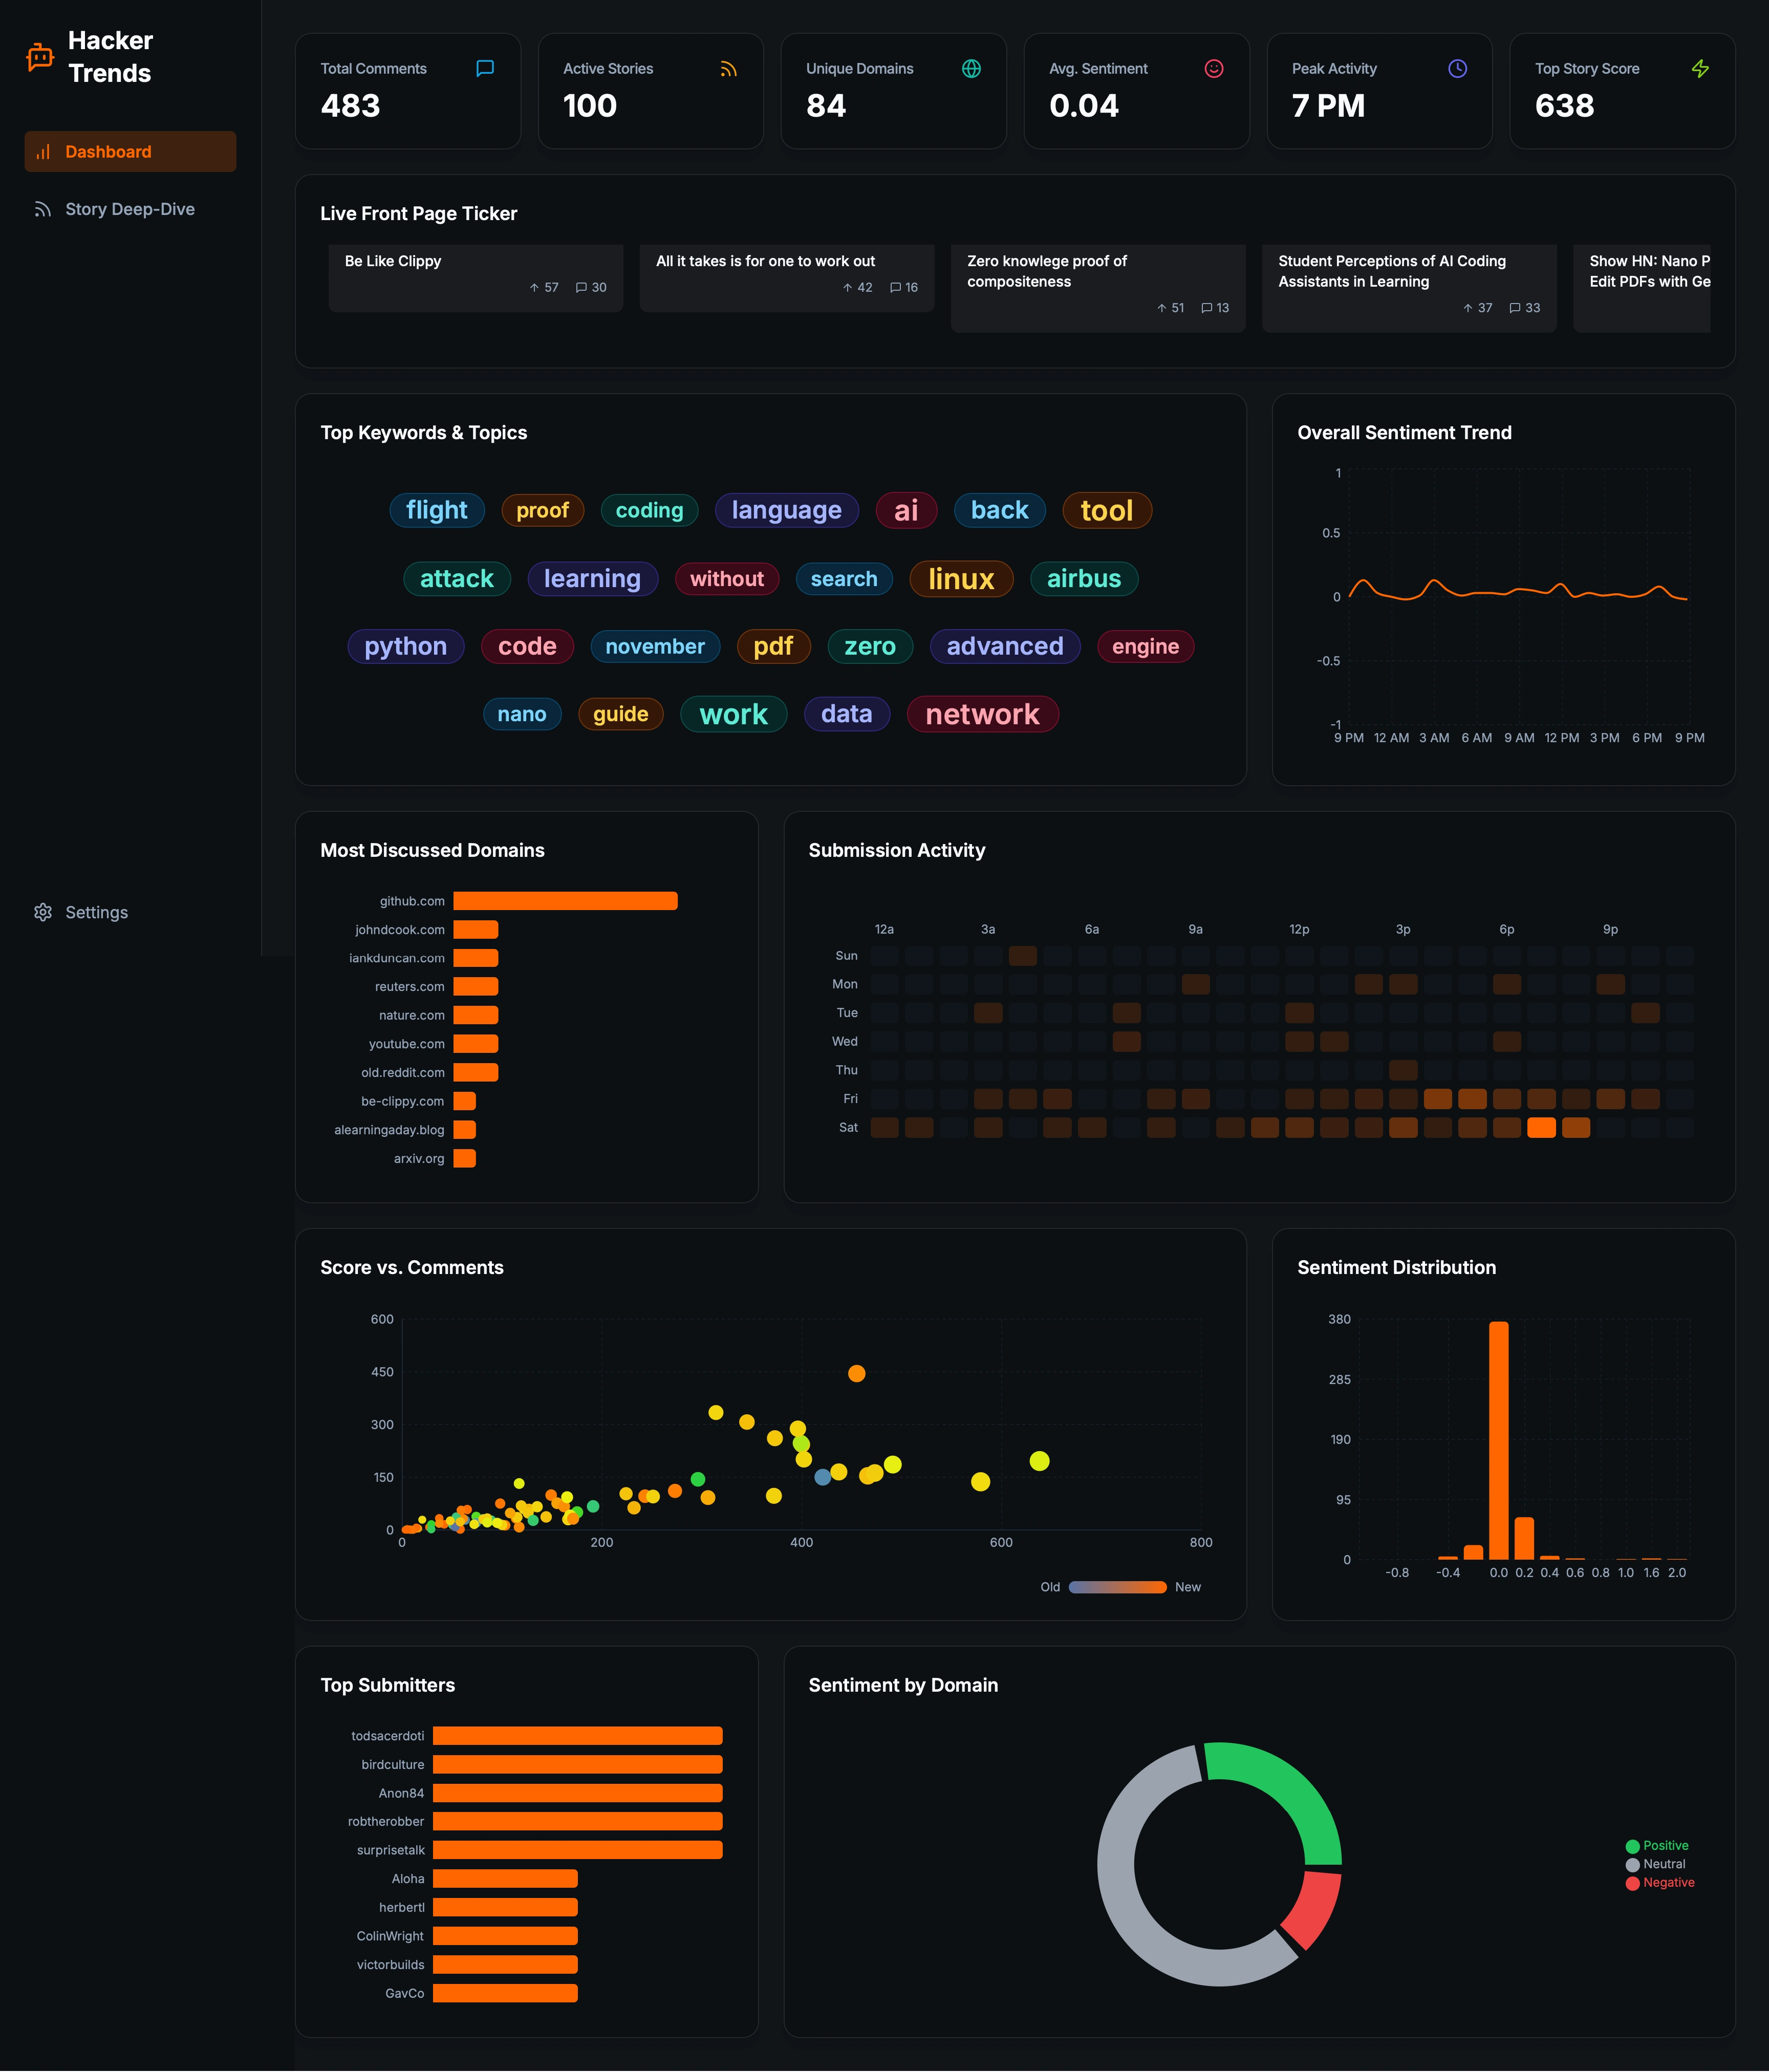
Functional Dashboard Concept
Technical Implementation
Frontend Architecture:
The interface is built with React and TypeScript, styled with Tailwind CSS for rapid, consistent design implementation. Vite provides the development environment, enabling fast iteration cycles during the build phase.
React Query handles data fetching and caching, ensuring the dashboard remains responsive even with frequent real-time updates. Recharts powers the interactive visualisations: charts that respond to user interaction rather than static images.
Backend Services:
Three Supabase Edge Functions handle the heavy lifting:
get-top-stories: Fetches and processes the top 100 stories from Hacker News, normalising the data for frontend consumption.
get-comment-sentiments: Runs sentiment analysis across comment threads, categorising responses as positive, neutral, or negative.
get-story-with-comments: Retrieves full story details with threaded comment trees and associated sentiment scores.
Edge Functions were chosen deliberately: they scale automatically, deploy instantly, and eliminate server management overhead. Perfect for proof-of-concept work where infrastructure shouldn't slow down iteration.
Deployment Pipeline:
Vercel deployment means pushes to main automatically deploy to production. No manual steps, no deployment scripts to maintain. The entire pipeline embodies the rapid-iteration philosophy.
Dashboard Capabilities
Real-Time Analytics Widgets:
Live Ticker: Scrolling feed of front-page stories with hover-to-pause interaction
Keyword Cloud: Trending topics extracted from current stories, clickable for deep-dive analysis
Sentiment Trend: 24-hour timeline showing community mood shifts
Activity Heatmap: Submission patterns visualised by day and hour
Score vs Comments: Story performance scatter plot with click-through to full content
Domain Analysis: Most-discussed sources with reputation indicators
Deep-Dive Exploration:
Each widget serves as an entry point to richer analysis. Click a keyword to see all related stories. Click a sentiment data point to read the underlying comments. Click a domain to explore its historical performance. The dashboard rewards curiosity.
User Experience Polish:
Theme switching (light, dark, system preference), adjustable ticker speed, configurable refresh intervals. These aren't afterthoughts—they demonstrate that proof-of-concept work needn't sacrifice user experience.
Results and Demonstration Value
The project successfully demonstrates the viability of real-time analytics dashboards built on modern serverless architecture. More importantly, it proves that sophisticated functionality: live data, AI analysis, interactive visualisation, can be delivered rapidly without compromising on quality.
The dashboard is live, functional, and publicly accessible. It handles real traffic, processes real data, and provides genuine utility. This isn't vapourware or a clickable prototype, it's working software.
Key Challenges Overcome
Challenge: Real-time data fetching without overwhelming the source API or creating poor user experience during loading states.
Solution: React Query's caching and background refetching provides snappy interactions whilst respecting API rate limits. Stale-while-revalidate patterns ensure users always see data immediately, with fresh data arriving seamlessly.
Challenge: Sentiment analysis at scale without introducing latency or cost concerns.
Solution: Edge Functions process sentiment analysis server-side, caching results appropriately. The architecture separates concerns cleanly: the frontend requests insights, the backend handles the computational work.
Challenge: Creating genuinely useful visualisations rather than charts for charts' sake.
Solution: Every widget answers a specific question: "What's trending?", "How does the community feel?", "When do people post?", "Which sources generate discussion?" Form follows function throughout.
What This Demonstrates
Rapid Prototyping Capability: This project exemplifies moving from concept to deployed product quickly. When you need to validate an idea, test market response, or demonstrate feasibility to stakeholders, this is the velocity available.
Full-Stack Fluency: Frontend (React, TypeScript, Tailwind), backend (Supabase Edge Functions), data visualisation (Recharts), deployment (Vercel), the complete vertical slice handled by one engineer.
Product Sensibility: Technical capability married to user experience awareness. The dashboard doesn't just work, it's pleasant to use. That combination matters when prototypes need to persuade.
Ship-Ready Mindset: This isn't code on a laptop. It's deployed, live, handling real requests. The gap between "working locally" and "working in production" is where many prototypes stall. This one didn't.
Engagement Opportunities
If you're looking to:
Validate a product concept with a working prototype rather than static mockups
Build an MVP that demonstrates genuine functionality to investors or stakeholders
Create internal dashboards or analytics tools rapidly
Explore whether an idea has technical legs before committing to full development
I specialise in this kind of rapid, high-quality prototyping. Hacker Trends demonstrates the approach: sophisticated functionality, polished experience, deployed and accessible. Let's discuss what we could build to validate your concept.
Project Links:
Live Demo: hackertrends.rawveg.co.uk
GitHub Repository: github.com/rawveg/hacker-trends
Like this project
Posted Nov 29, 2025
Developed real-time analytics and sentiment analysis tool for Hacker News.