Project Metrics: Identify work types and work load over time
Diana Slaney
Loading this content connects you to YouTube.
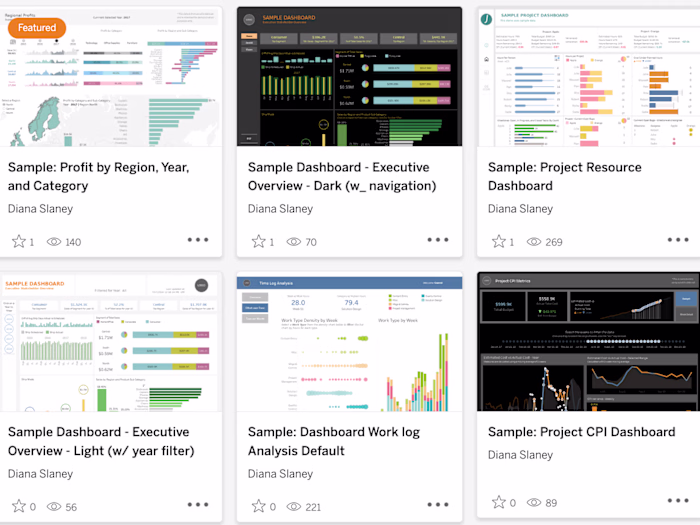
YouTube privacy informationData Visualization of Time Logs of Resources in a Project to demonstrate work type percentages, total hours, and density over time.This visualization provide...
Loading this content connects you to YouTube.
YouTube privacy informationLike this project
Posted Feb 18, 2025
Tableau Data Visualization dashboard demonstrating 3 different chart types to gain insights on work type percentages, total hours, and work density over time.
Likes
0
Views
7