Global GHG & CO₂ Emissions Data Pipeline
Rimsha Bashir

Global Greenhouse Gas (GHG) & CO₂ Emissions Data Pipeline 🌍
Table of Contents
Overview
Climate change is one of the most pressing global challenges, with greenhouse gas (GHG) emissions—especially carbon dioxide (CO₂)—being a major driver of rising global temperatures. Understanding emission trends is critical for policymakers, researchers, and sustainability leaders aiming to mitigate climate change and develop effective carbon reduction strategies.
Problem Statement: The Climate Challenge
Greenhouse gases (GHGs), especially carbon dioxide (CO₂), are major contributors to climate change. Human activities like fossil fuel combustion, deforestation, and agriculture have significantly increased CO₂ emissions, driving global warming and its associated impacts. These include:
Rising Global Temperatures: A 1.1°C increase since pre-industrial times, with potential catastrophic effects.
Extreme Weather Events: Intensified hurricanes, floods, and droughts affecting vulnerable regions.
Health Risks: Air pollution causing respiratory and cardiovascular diseases.
Economic & Social Disruptions: Costing billions globally, with developing nations most affected.
Key Research Questions
How have global CO₂ emissions changed over time?
Which countries and regions contribute the most to emissions?
How have Greenhouse gases contributed to the temperature change over time?
What sectors and sources drive emissions the most?
How do per-capita emissions compare across countries?
Objectives
This project aims to automate the ingestion, processing, and analysis of CO₂ & GHG emissions data to provide actionable insights for climate action, by examining trends in global CO₂ emissions over time to understand the scale and direction of the issue and identifying some key contributors to CO₂ emissions, such as countries and industries, and assess their roles in climate change.
Automate data ingestion of global emissions dataset using Kestra.
Process large-scale datasets efficiently with PySpark and Dataproc.
Store structured data in Google Cloud Storage (GCS) and BigQuery for analytics.
Transform raw data into insightful models using DBT.
Enable interactive visualizations with Power BI.
Data Source
This project uses the CO2 and Greenhouse Gas Emissions dataset provided by Our World in Data. You can find out more about the dataset and related metadata from the codebook provided. It includes a description and source for each indicator in the dataset.
Special thanks to them for making this valuable data publicly available. You can explore more such dataset on their website.
Citation
Hannah Ritchie, Pablo Rosado and Max Roser (2023) - “CO₂ and Greenhouse Gas Emissions” Published online at OurWorldinData.org. Retrieved from: 'https://ourworldindata.org/co2-and-greenhouse-gas-emissions' [Online Resource]
Tech Stack
Pipeline Architecture Diagram
Pipeline Overview
This is an overview of how the end-to-end analytics pipeline processes and analyzes Greenhouse Gas (GHG) emissions data using Terraform, Docker, Kestra, PySpark, dbt, and Google Cloud Platform (GCP).
Flow Summary
Infrastructure Provisioning with Terraform
GCP resources including the Cloud Storage bucket (
ghg-bucket), Dataproc cluster (ghg-dataproc), and BigQuery datasets (Staging and Analytics) are provisioned using Terraform.Docker Runs Kestra
A Docker Compose setup runs an instance of Kestra to orchestrate the entire pipeline.
Data Upload (via Kestra)
Raw GHG emissions data is sourced from the OWID data repository and uploaded to the GCS bucket for processing.
Processing with PySpark (via Kestra + Dataproc)
The PySpark transformation script transform_ghg_data.py is uploaded to the GCS bucket.
A Dataproc job is triggered to run the script, which defines the schema, cleans the data, and performs transformations.
The processed data is then written to the BigQuery
Staging dataset.Data Modeling with dbt
dbt models transform the staging data into analytics-ready tables in the BigQuery
Analytics dataset.Visualization
A Power BI dashboard connects to the BigQuery
Analytics dataset to enable interactive reporting and exploration of emissions trends, temperature changes, and economic correlations.What does Kestra do?
Kestra orchestrates and automates the entire pipeline:
Configuration (
gcp_kv.yml):
Sets up GCP environment variables, service credentials, and resource references (GCS bucket, Dataproc cluster, BigQuery datasets).Data Ingestion (
gcp_upload.yml):
Uploads raw emissions data into the GCS bucket.Data Processing (
gcp_spark_bq.yml):
Submits a PySpark job to Dataproc to transform raw data and load the output into BigQuery Staging.What does dbt do?
dbt manages the transformation of cleaned data in BigQuery:
Staging Models
stg_emissions.sql: Selects relevant fields, calculates emissions per capita.stg_country.sql: Extracts the latest GDP and population per country.Core Models
fact_emissions.sql: Creates a partitioned and clustered emissions fact table.dim_country_info.sql: Builds a dimension table with country-level info.annual_emissions.sql: Aggregates total and per capita emissions by year.global_temp.sql: Analyzes temperature trends linked to emissions.emissions_vs_econ.sql: Compares GDP to CO₂ per capita emissions.Final outputs from dbt are stored in the Analytics dataset and used in Power BI dashboards.
DBT Lineage View
This Lineage Graph represents the DAG, showing the flow of data between dbt models..
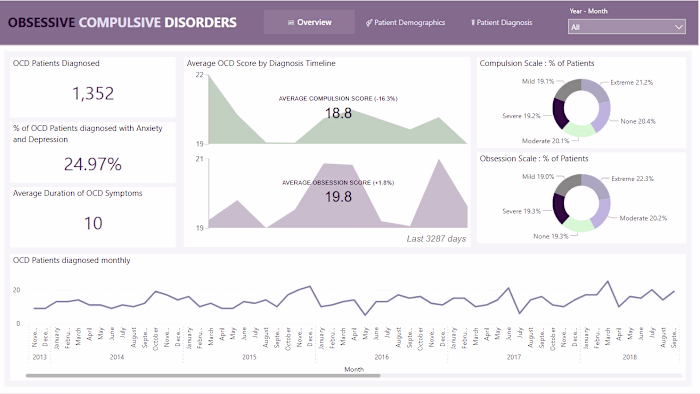
Dashboard
A high-level snapshot of total greenhouse gas (GHG) emissions, CO₂ emissions, and their impact on global temperature trends over time.
A geographic and sector-wise breakdown of emissions, showing region-wise contributions, emission per capita, and regional growth trends over the years.
You can view a preview of this dashboard in my Novypro account, here.
Instructions to Reproduce
Steps to reproduce this end-to-end pipeline has been documented in setup.md.
Future Improvements
Implement CI/CD
Add Makefile
Acknowledgement
This is a capstone project developed as a part of Data Engineering ZoomCamp course.
A huge thanks to the DataTalks.Club team and instructors for a great learning experience!
Like this project
Posted Apr 28, 2025
Developed a data pipeline for GHG emissions analysis using various tools.
Likes
0
Views
19