Analytics Dashboard for SaaS
Rajat Babbar
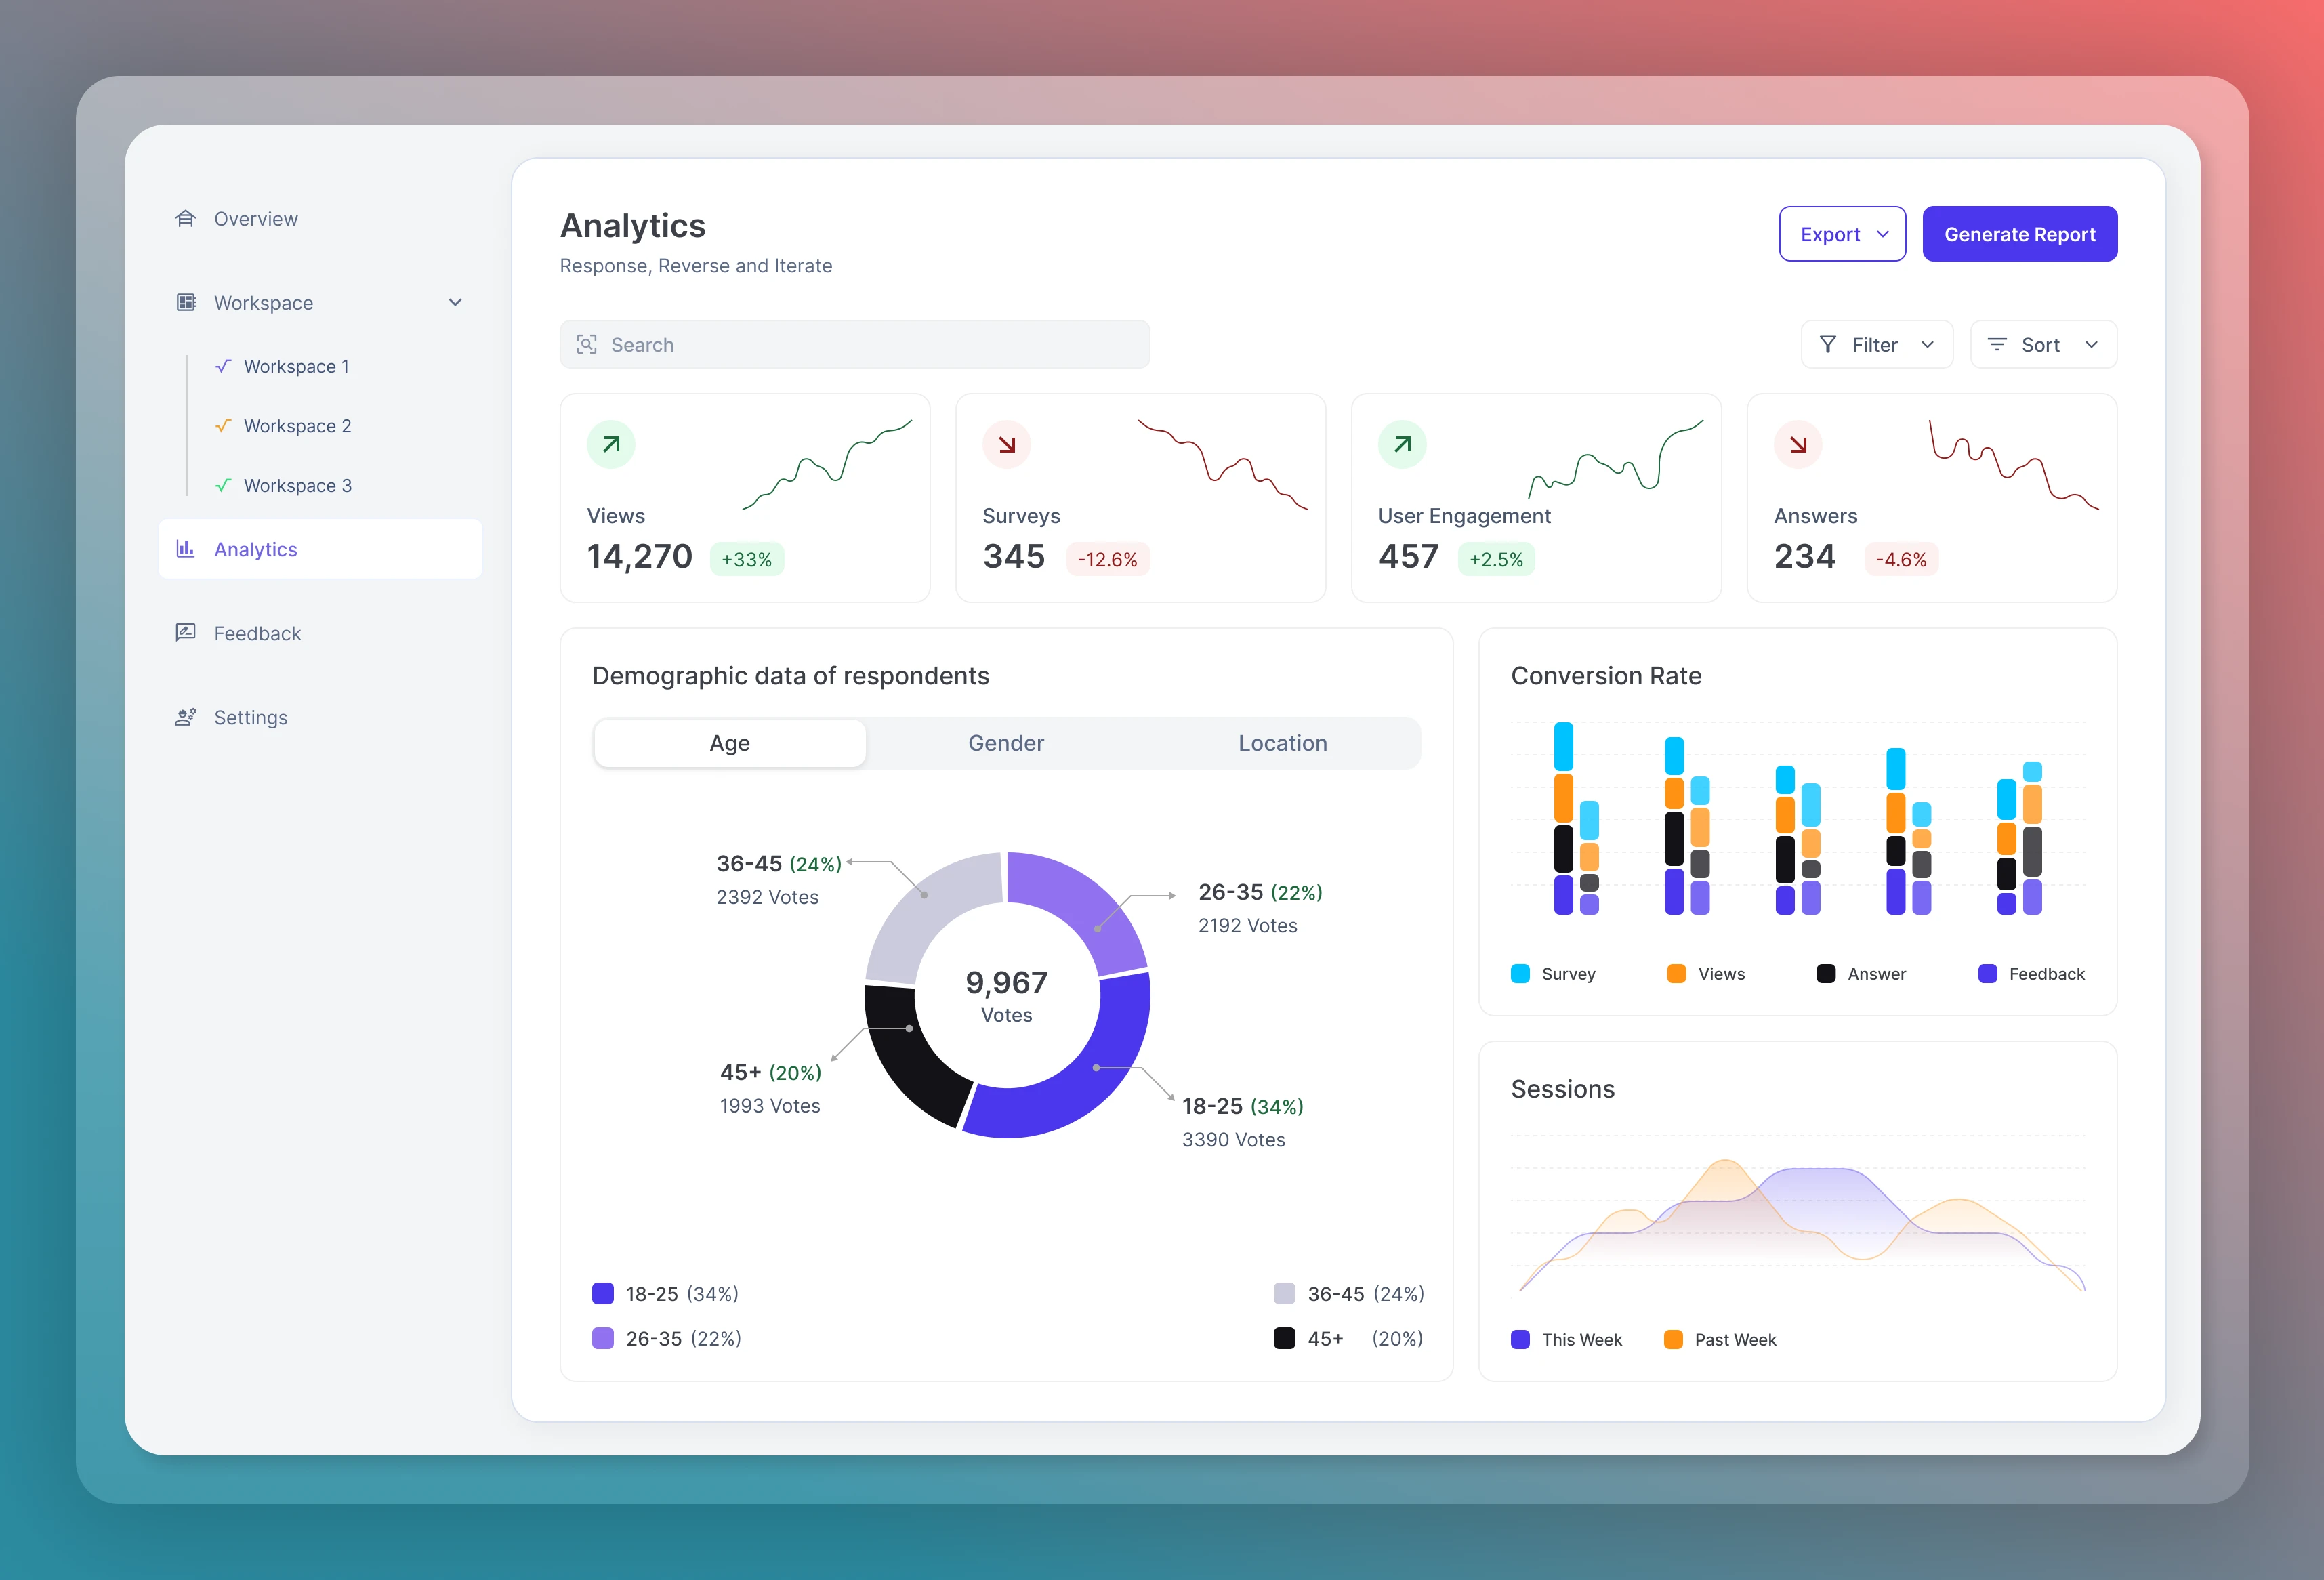
This analytics dashboard is designed to provide an intuitive overview of key performance metrics, including views, surveys, user engagement, and answers.
It incorporates visual data representations like graphs, charts, and demographic breakdowns (age, gender, location) to help users make data-driven decisions effectively.
Key features include interactive filtering, export options, and actionable insights to track and optimize user behavior, conversion rates, and overall engagement trends.
Like this project
Posted Jan 9, 2025
This analytics dashboard is designed to provide an intuitive overview of key performance metrics, including views, surveys, user engagement, and answers.
Likes
0
Views
7