Maximizing the Value of UX Research Data
Kenjo
Maximizing the Value of UX Research Data: A Look at Different Analysis Methods
As a professional UX researcher, one of the most important things we strive for is to maximize the value of the research data we collect. This data is crucial in helping us understand the needs and behavior of our users, and ultimately improve the overall user experience of our products or services. But simply collecting data isn't enough - we must also carefully analyze and interpret it to extract meaningful insights and inform our design decisions. Today we'll look at different analysis methods that can help us do just that - maximize the value of our UX research data.
What is analysis in UX Research?
UX research analysis involves examining and interpreting data from user testing and other research methods to understand user interactions and identify areas for improvement. It can be done through qualitative analysis of text and spoken data, quantitative analysis of numerical data, or a combination of both. The aim is to identify trends and patterns in user data and use this information to design a product or service that meets user needs and expectations.
7 Different Types of UX Research Analysis
It’s important to have a variety of analysis methods in your toolkit to effectively extract insights from your research data. Pro tip - consider your research's specific goals and objectives when selecting which analysis method to use. Each method has its own strengths and limitations, so it's important to choose the one that best fits the needs of your study. Additionally, it's always a good idea to triangulate your findings by using multiple analysis methods to get a more comprehensive understanding of the data.
Content Analysis
Content analysis is a UX research method that involves analyzing written or spoken data, such as user feedback, interviews, or surveys, to identify themes and patterns and gain insights into user thoughts, feelings, and experiences. It is a qualitative analysis method that can be used to examine various types of user data.
How to do Content Analysis
Using Content Analysis can be quite nerve-racking as it can get quite complicated, but here’s
a simplified flow to help you get started.
First things first, you need to generate descriptive codes for distinct themes or words in your data. You can be creative but make sure to be concise so that other people viewing your analysis can easily understand the codes in one glimpse. Start off by creating codes for open survey responses or diary study entries like “1-Family” to responses related to the participant’s family or “2-Job” to diary entries concerning the participant’s job. As you analyze the data, you can create sub-categories for more specific themes, such as "Job - layoff" or "Family – extended”. As a rule of thumb, keep them broad and don’t fall into the rabbit hole of hyper-specific codes like adding additional codes for mother-in-law, first cousin twice removed, etc.
The next step is to assign codes to behaviors or observations that align with the themes you have identified. When you come across data that fits a certain theme, tag it with the corresponding code. If appropriate, you can assign multiple codes to the same data. This will allow you to easily sort and analyze the data according to the themes you have identified. Then count the frequency of each code to understand the prevalence of different themes in the data. For instance, if 30% of the responses were tagged “Family” and 60% were tagged “Job”, it’s easy to say that content surrounding jobs are prevalent in the study.
Discourse Analysis
Discourse analysis is a UX research method that involves analyzing how language is used in communication, both spoken and written, to understand user needs and engagement with a product or service. It differs from content analysis, which focuses on the content of a product or service and may involve analyzing pre-existing content or using techniques like coding and categorization. Discourse analysis often involves collecting data through methods like user testing, interviews, and focus groups, and analyzing the structure and patterns of language. Both content analysis and discourse analysis can provide insights into user perceptions and interactions with a product or service.
How to do Discourse Analysis
Start by defining your research question and gathering all relevant data, including transcripts of interviews, observations, and other forms of communication.
Organize the data in a way that makes it easy to analyze and look for patterns and themes that emerge. Pay attention to how language is used in the data, including word choice, tone, and context, and look for patterns in the way people communicate and make sense of their experiences. Consider the power dynamics and cultural and social context at play in the communication being analyzed.
Use your observations and analysis to interpret the data and draw conclusions about the user experience and consider how your findings can inform the design and improvement of products or services. Write up a report or presentation to share your results and recommendations with stakeholders. By following these steps, you can conduct a thorough and systematic discourse analysis to gain a deeper understanding of how people communicate and make sense of their experiences and use this insight to inform the design and improvement of products or services.
Make sure to consider the power dynamics at play in the communication being analyzed. Pay attention to who holds power in the communication and how it is exercised, as this can have a significant impact on the meaning and interpretation of the communication.
Grounded Theory
Grounded theory is a research analysis method used in UX research to generate new theories based on empirical data. It is a way of systematically analyzing and interpreting data collected from various sources to generate a theory that is grounded in the data itself.
The goal of grounded theory is to develop a theory that is grounded in the data, rather than imposing preconceived notions or hypotheses onto the data. This means that the theory emerges from the data itself, rather than being imposed upon it.

How to do Grounded Theory
The first two steps in conducting Grounded Theory analysis is similar to the other analysis methods where you collect data from various sources and code the data using the predetermined categories based on the research questions.
However, for grounded theory analysis to work in your favor, make sure that your sample size is large enough to field you accurate and precise information. Too small a sample size and your analysis might be skewed.
After the data has been coded, it is analyzed to identify patterns and relationships and to guide the development of a theory that explains the data. This theory should be grounded in the data and be able to accurately describe and interpret the phenomenon of interest. It should also be able to answer the research questions being explored and provide insights into the user experience.
Benefits of Grounded Theory
One of the key benefits of grounded theory is that it allows researchers to develop theories that are grounded in real-world data, rather than being based on assumptions or preconceptions. This can help to ensure that the theories generated are relevant and applicable to the real world and can be used to inform the design of user experiences.
Overall, grounded theory is a powerful and widely used research analysis method in UX research and can be a valuable tool for generating new insights and understanding the needs and behaviors of users.
Framework Analysis
Framework analysis is a method used to analyze and interpret data in a structured and systematic way. It involves creating an organized structure, or framework, of themes (often confused with Thematic Analysis, more on that later) derived from the data to identify and describe patterns and relationships within the data. This method of analysis can be used with a variety of data types and has been applied in a range of research contexts.
How to do Framework Analysis
First step is to create an analytic framework based on the research questions being explored. This framework should include the key concepts and themes that you will be analyzing and the steps you will follow to analyze and interpret the data. The purpose of the analytic framework is to guide the analysis and interpretation of the data in a systematic and structured way.
Once the analytic framework has been developed, the next step is to use it to analyze and interpret the data. This may involve using a combination of data description and abstraction to identify key patterns and themes within the data. Data description involves describing the data in detail, including the context in which it was collected and the characteristics of the participants. Data abstraction involves identifying and extracting the key themes and patterns within the data.
The overall goal of framework analysis is to understand and interpret the phenomenon of interest in a comprehensive and nuanced way. By using an analytic framework and a combination of data description and abstraction, you can gain a deep understanding of the user experience and use this insight to inform the design and improvement of products or services.
Pro tip: Be open to changing the framework as you go along. This is because the process of analyzing the data may uncover new insights that require the framework to be adjusted. It's important to be flexible and willing to change the framework to make sure it accurately reflects what you are studying.
Benefits of Framework Analysis
Framework analysis is a flexible and powerful method that can be used to gain insights and inform the design of user experiences. It allows researchers to identify patterns and themes within the data and to conduct cross-sectional analysis, helping to ensure that the insights generated are relevant and applicable to the real world.
Rainbow Spreadsheet Analysis
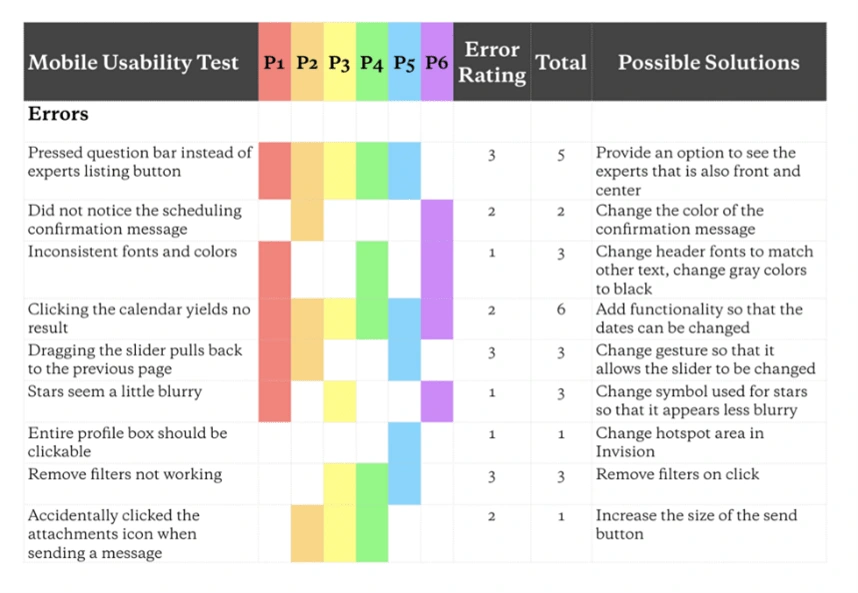
The Rainbow Spreadsheet analysis involves creating a spreadsheet with multiple columns, each representing a different theme or category, and using color-coding to visually represent the relationships and patterns within the data.
How to do Rainbow Spreadsheet Analysis
As always you need to gather all the data you will be studying, such as transcripts of interviews and observations. Then, create a spreadsheet and put the data into rows and columns.
Each row is a separate piece of data, and each column represents a specific theme or category. After organizing the data, you need to analyze it to find patterns and connections. You can do this by sorting and filtering the data, using formulas and charts to visualize it, and looking for connections between different categories. The goal of the Rainbow Spreadsheet Analysis is to understand and interpret the data in a detailed way and use that understanding to make products or services better.
If you opt to choose this method, make sure to develop a clear and logical structure for organizing the data in the spreadsheet. A well-organized spreadsheet will go a long way in making the analysis easier. It’s also important to use consistent and clear naming conventions for the columns and rows to ensure that the spreadsheet is easy to read and understand.
Benefits of Rainbow Spreadsheet Analysis
One of the key benefits of the rainbow spreadsheet method is that it allows researchers to visually represent the relationships and patterns within the data, making it easier to identify trends and insights. This can be particularly useful when working with large amounts of data, as it helps to ensure that the data is analyzed in a consistent and reliable manner.
Overall, the rainbow spreadsheet is a useful research analysis method in UX research and can be a valuable tool for organizing and interpreting data in a visual and intuitive way. It can help researchers to identify trends and insights that can inform the design of user experiences.
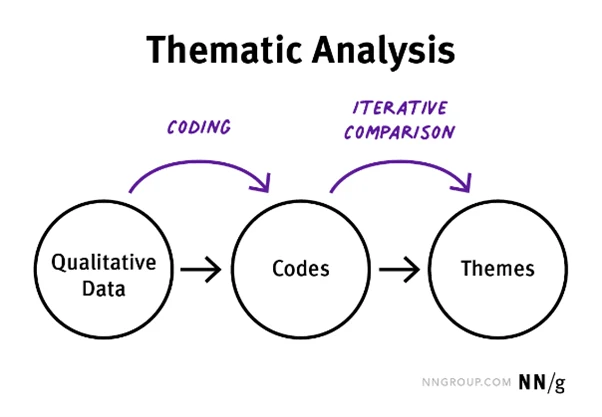
Thematic Analysis
Thematic analysis is a crowd favorite in the field of UX Research, so it’s best to familiarize yourself with it now. Thematic Analysis is a method used in UX research to identify, analyze, and interpret patterns or themes within a data set. It is a flexible, inductive approach that allows researchers to identify and explore the underlying meanings and interpretations that participants bring to their experiences.
How to do Thematic Analysis
The first step is to familiarize yourself with the data. This might involve reading through all of the transcripts or other data sources, taking notes on any initial observations or impressions you have, and highlighting any particularly relevant or interesting segments of text.
Next, you will want to begin coding the data by identifying words, phrases, or passages that relate to specific themes or ideas. This can be done manually, by reading through the data and marking segments that seem relevant to a particular theme, or it can be done using specialized software that allows you to tag or highlight segments of text. As you code the data, it can be helpful to create a coding sheet or matrix that allows you to keep track of which themes or ideas are emerging from the data.
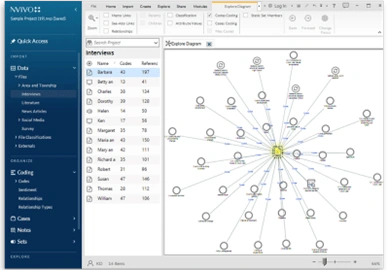
Once you have coded the data, the next step is to review the coded segments and begin organizing them into themes. This might involve grouping together similar codes or ideas, or it might involve combining codes that seem to be related in some way. It can be helpful to use a template or framework to guide your thematic analysis, such as the Framework Method or the NVivo software, which can help you organize and analyze your data in a structured way.
Finally, once you have identified and organized your themes, you will want to write up your results. This might involve creating a summary of your findings, describing the themes that emerged from the data, and discussing the implications of these themes for your research question or hypotheses. It can also be helpful to include examples from the data to illustrate your points and provide concrete evidence for your conclusions.
Overall, conducting a thematic analysis requires careful reading and interpretation of the data, as well as a systematic and organized approach to coding and analyzing the data. By following these steps, you can identify patterns and themes in your data and gain a deeper understanding of the experiences, perspectives, and behaviors of the people you are studying.
One pro tip for conducting a thematic analysis is to remain open-minded and flexible throughout the process.
It is important to approach the data with an open-minded and non-judgmental attitude, as this will allow you to identify patterns and themes that might not have been immediately apparent. Additionally, it is important to remain flexible and willing to adjust your coding and analysis as you go along, as the data may reveal new or unexpected themes that were not initially anticipated.
It would also be in your best interest to involve multiple reviewers in the coding and analysis process. It can be helpful to have multiple people review and code the data, as this can help ensure that the analysis is thorough and that different perspectives are considered. You can also check for inter-rater reliability, which is a measure of how well different coders agree on the themes and categories identified in the data.
Finally, it is important to remember that thematic analysis is an interpretive process, and it is natural for different researchers to have different interpretations of the data. It is therefore important to be transparent about your coding and analysis process and to clearly describe and justify your decisions in your write-up. By being transparent and explicit about your process, you can help ensure that your results are reliable and can be replicated by other researchers.
Benefits of Thematic Analysis
One of the key benefits of thematic analysis is that it allows researchers to explore and analyze data in a more open-ended and flexible way, rather than being constrained by pre-determined categories or frameworks. This makes it well-suited for qualitative research, where the goal is often to understand the rich, nuanced experiences and perspectives of participants.
Overall, thematic analysis is a powerful tool for UX researchers looking to delve deeper into the meanings and interpretations of their data and to identify patterns and themes that can inform the design of user experiences.
What are the best times to do analysis in UX Research?
As a UX researcher, you must know that the process of gathering and analyzing data is a crucial part of understanding the needs, motivations, and behaviors of your users. But when is the best time to do this analysis?
Before starting research
Before you even begin your research, it can be helpful to do some preliminary analysis to understand the context and goals of your study. This might involve reviewing existing research on the topic, identifying key stakeholders and user groups, and defining your research question. Doing this analysis upfront can help you create a more focused and effective research plan.
While conducting research
As you're gathering data from interviews, focus groups, surveys, or other sources, it can be helpful to start analyzing the data as you go. This can help you identify patterns and themes that emerge early on and allow you to adjust your research plan as needed. For example, if you notice that a particular theme is coming up repeatedly in your interviews, you might want to focus on that theme in future research activities.
At the end of the research project
Once you've completed your data collection, it's time to dive into a more thorough analysis of the data. This might involve coding the data, identifying themes and patterns, and interpreting the results in relation to your research question. It's important to set aside dedicated time for this analysis, as it can be a time-intensive process. Doing a thorough analysis at the end of your research project will allow you to draw meaningful insights and recommendations that can inform the design of your product or service.
Overall, the best times to do analysis in UX research are throughout the research process, as it allows you to constantly iterate and improve upon your designs based on the needs and behaviors of your users. By incorporating analysis into your workflow, you can ensure that you're creating the best possible experiences for your users.
Summary
Incorporating analysis into the UX research process is crucial for understanding user needs and behaviors, and for creating designs that meet those needs.
By constantly iterating and improving upon designs based on data and insights, you can ensure that you are creating the best possible experiences for your users. Overall, it is important to incorporate analysis throughout the research process to constantly gather and interpret data and use that information to inform design decisions. By doing so, you can ensure that your designs are meeting the needs and expectations of your users.
Like this project
Posted Feb 3, 2023
A Look at Different Analysis Methods
Likes
1
Views
45