Customer Segmentation for Elevvo Pathways

Fares Sultan


Customer Segmentation with K-Means Clustering
Unsupervised learning project that segments mall customers by income and spending behavior, built during my internship at Elevvo Pathways.
Dataset
Objective
Group customers into meaningful segments to support data-driven marketing — identifying who to target with premium offers, who needs re-engagement, and who's naturally loyal.
Approach
Data cleaning & scaling — prepared and standardized income/spending features.
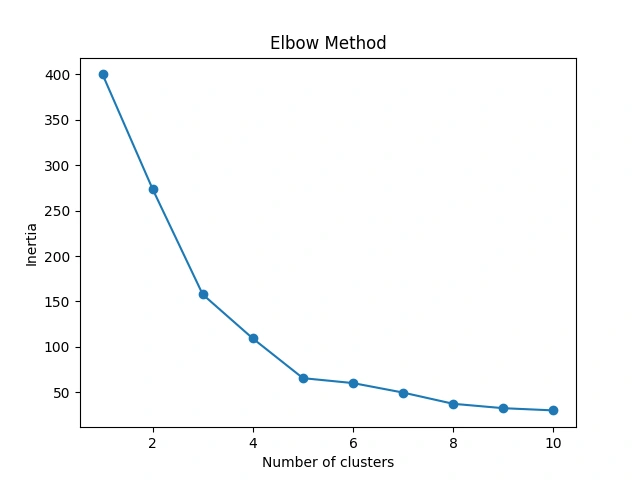
Elbow Method — ran K-Means for k = 1 to 10 and plotted inertia to find the optimal number of clusters.
K-Means clustering — fit the final model at the chosen k.
DBSCAN — applied as a secondary check to detect outliers and non-linear cluster shapes.
Segment analysis — computed average income/spending per cluster to interpret each group.
Results
Elbow Method
Inertia drops sharply up to k=3, keeps declining through k=4–5, then flattens from k=6 onward. The bend at k=5 marks the point of diminishing returns, so k=5 was chosen for the final model.
Customer Segments (k=5)
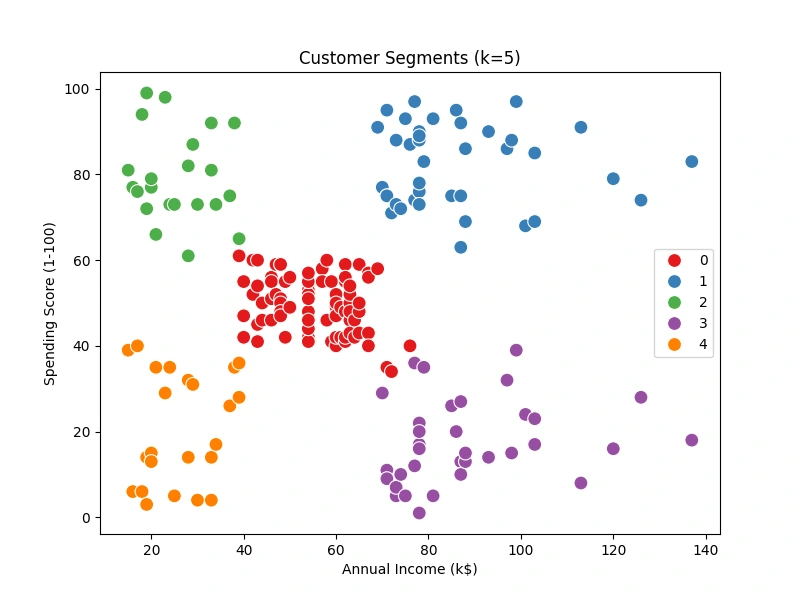
Cluster Income Spending Profile 0 (red) Mid (~40–70k) Mid (~40–60) Mainstream customers — largest, steady segment 1 (blue) High (~70–140k) High (~70–100) VIPs — affluent, high spenders; top target for premium offers 2 (green) Low (~15–40k) High (~70–100) Aspirational spenders — spend beyond their income bracket 3 (purple) High (~70–140k) Low (~0–40) Wealthy but disengaged — untapped potential, needs re-targeting 4 (orange) Low (~15–40k) Low (~0–40) Budget-conscious, low engagement — lowest priority segment
DBSCAN (outlier detection)
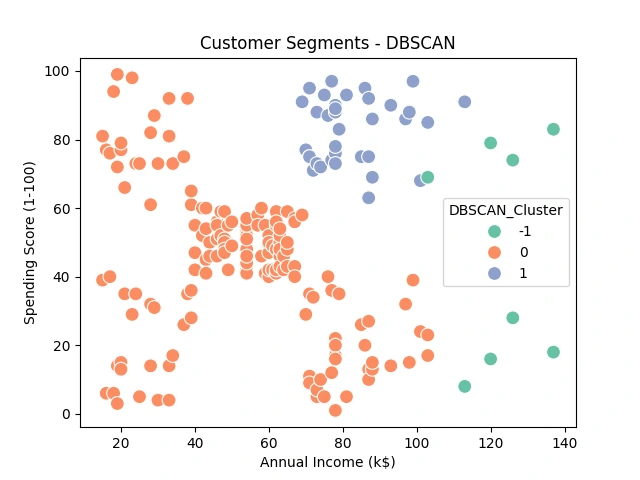
DBSCAN was run as a density-based check against the K-Means result:
Cluster 1 (blue) — the high-income, high-spending group came through as a genuinely dense cluster, matching K-Means' VIP segment (Cluster 1).
Cluster 0 (orange) — nearly everyone else (low/mid income, any spending level) merged into one large blob. DBSCAN couldn't separate "aspirational spenders" from "budget-conscious" customers, since there's no density gap between them — the data is continuous, not clustered, in that region.
Cluster -1 (green) — labeled as noise/outliers. Mostly the very high earners (~110–140k) across a range of spending scores, since they're too sparse to form their own dense group.
Takeaway: DBSCAN confirms the VIP segment is a real, dense cluster, but it isn't well suited to splitting the rest of the customer base — this data is closer to convex/blob-shaped, which favors K-Means. It's useful here mainly as an outlier-detection sanity check rather than a full segmentation method.
Key Takeaways
Income and spending score are not correlated — high income doesn't guarantee high spending (see Cluster 3), and low income doesn't mean low spending (see Cluster 2).
The clearest business opportunities are the VIP segment (Cluster 1) for retention/upselling and the high-income, low-spending segment (Cluster 3) for re-engagement campaigns.
K-Means with k=5 produced clean, well-separated, interpretable clusters — validated visually and by the elbow curve.
DBSCAN independently confirmed the VIP segment as a real dense cluster, but couldn't separate the rest of the customer base — reinforcing that K-Means was the better fit for this dataset's shape.
Tools
Python · Pandas · Scikit-learn · Matplotlib · Seaborn
Like this project
Posted Sep 28, 2026
Developed a customer segmentation solution using K-Means clustering to identify groups of customers with similar characteristics.