This project focuses on analyzing

Sai Motupalli

This project focuses on analyzing sample sales data using Microsoft Excel to identify business trends, compare regional performance, and evaluate product category profitability.
I organized and analyzed the dataset using Excel formulas, PivotTables, and charts to transform raw sales records into meaningful business insights.
Key Activities
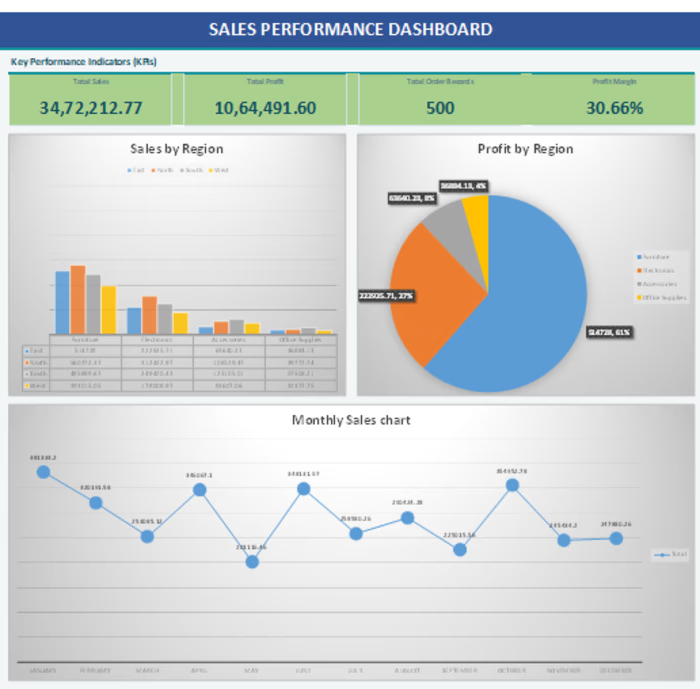
Analyzed monthly sales trends to understand changes in sales performance throughout the year.
Compared sales and profit across North, South, East, and West regions.
Evaluated sales, profit, and profit margins across product categories.
Used Excel formulas and PivotTables to summarize key performance indicators.
Created charts and visual summaries to make findings easier to understand.
Tools Used: Microsoft Excel
Project Outcome: Produced a structured sales analysis highlighting monthly trends, regional differences, and category-level profitability to support data-informed decision-making.
This portfolio project uses sample data and demonstrates my practical skills in Excel analysis, business reporting, and data visualization.
Like this project
Posted Oct 18, 2026
This project focuses on analyzing sample sales data using Microsoft Excel to identify business trends, compare regional performance, and evaluate product cat...
Likes
0
Views
0