Serverless Database Dashboard Design for NebulaDB

Cansaas Agency


Overview
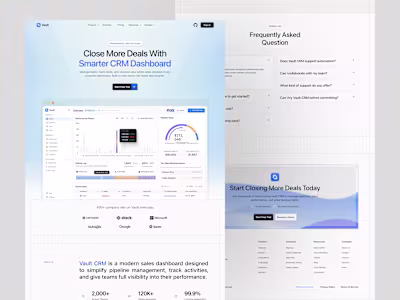
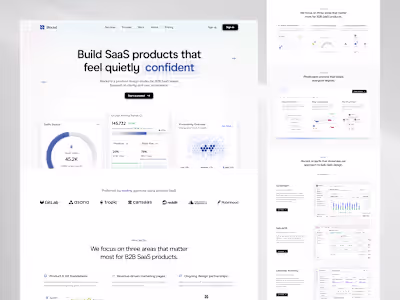
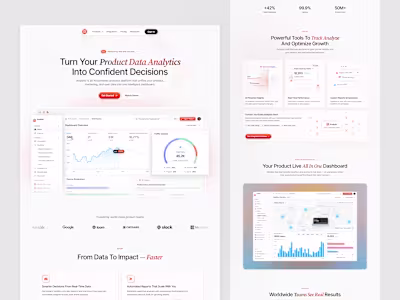
This Serverless Database Dashboard was designed as a modern DevOps monitoring interface for a B2B infrastructure SaaS platform. The goal was to centralize critical system metrics, such as latency, error rate, throughput, and resource usage, into a single cloud infrastructure monitoring dashboard that allows engineering teams to quickly understand system health. By combining structured layout, clean data visualization, and intuitive navigation, the dashboard transforms complex backend metrics into a clear and actionable overview.
The Challenge
Monitoring distributed serverless infrastructure often requires engineers to navigate multiple tools for logs, performance metrics, and infrastructure health. This fragmented workflow increases cognitive load and slows down incident response. The challenge was to design a unified analytics dashboard that enables teams to identify anomalies, monitor clusters across regions, and analyze performance trends without switching contexts.
The Approach
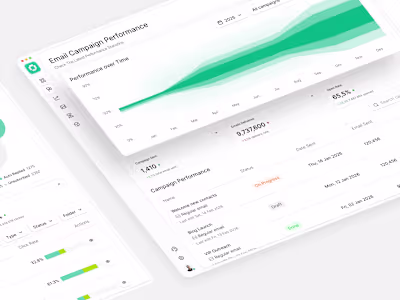
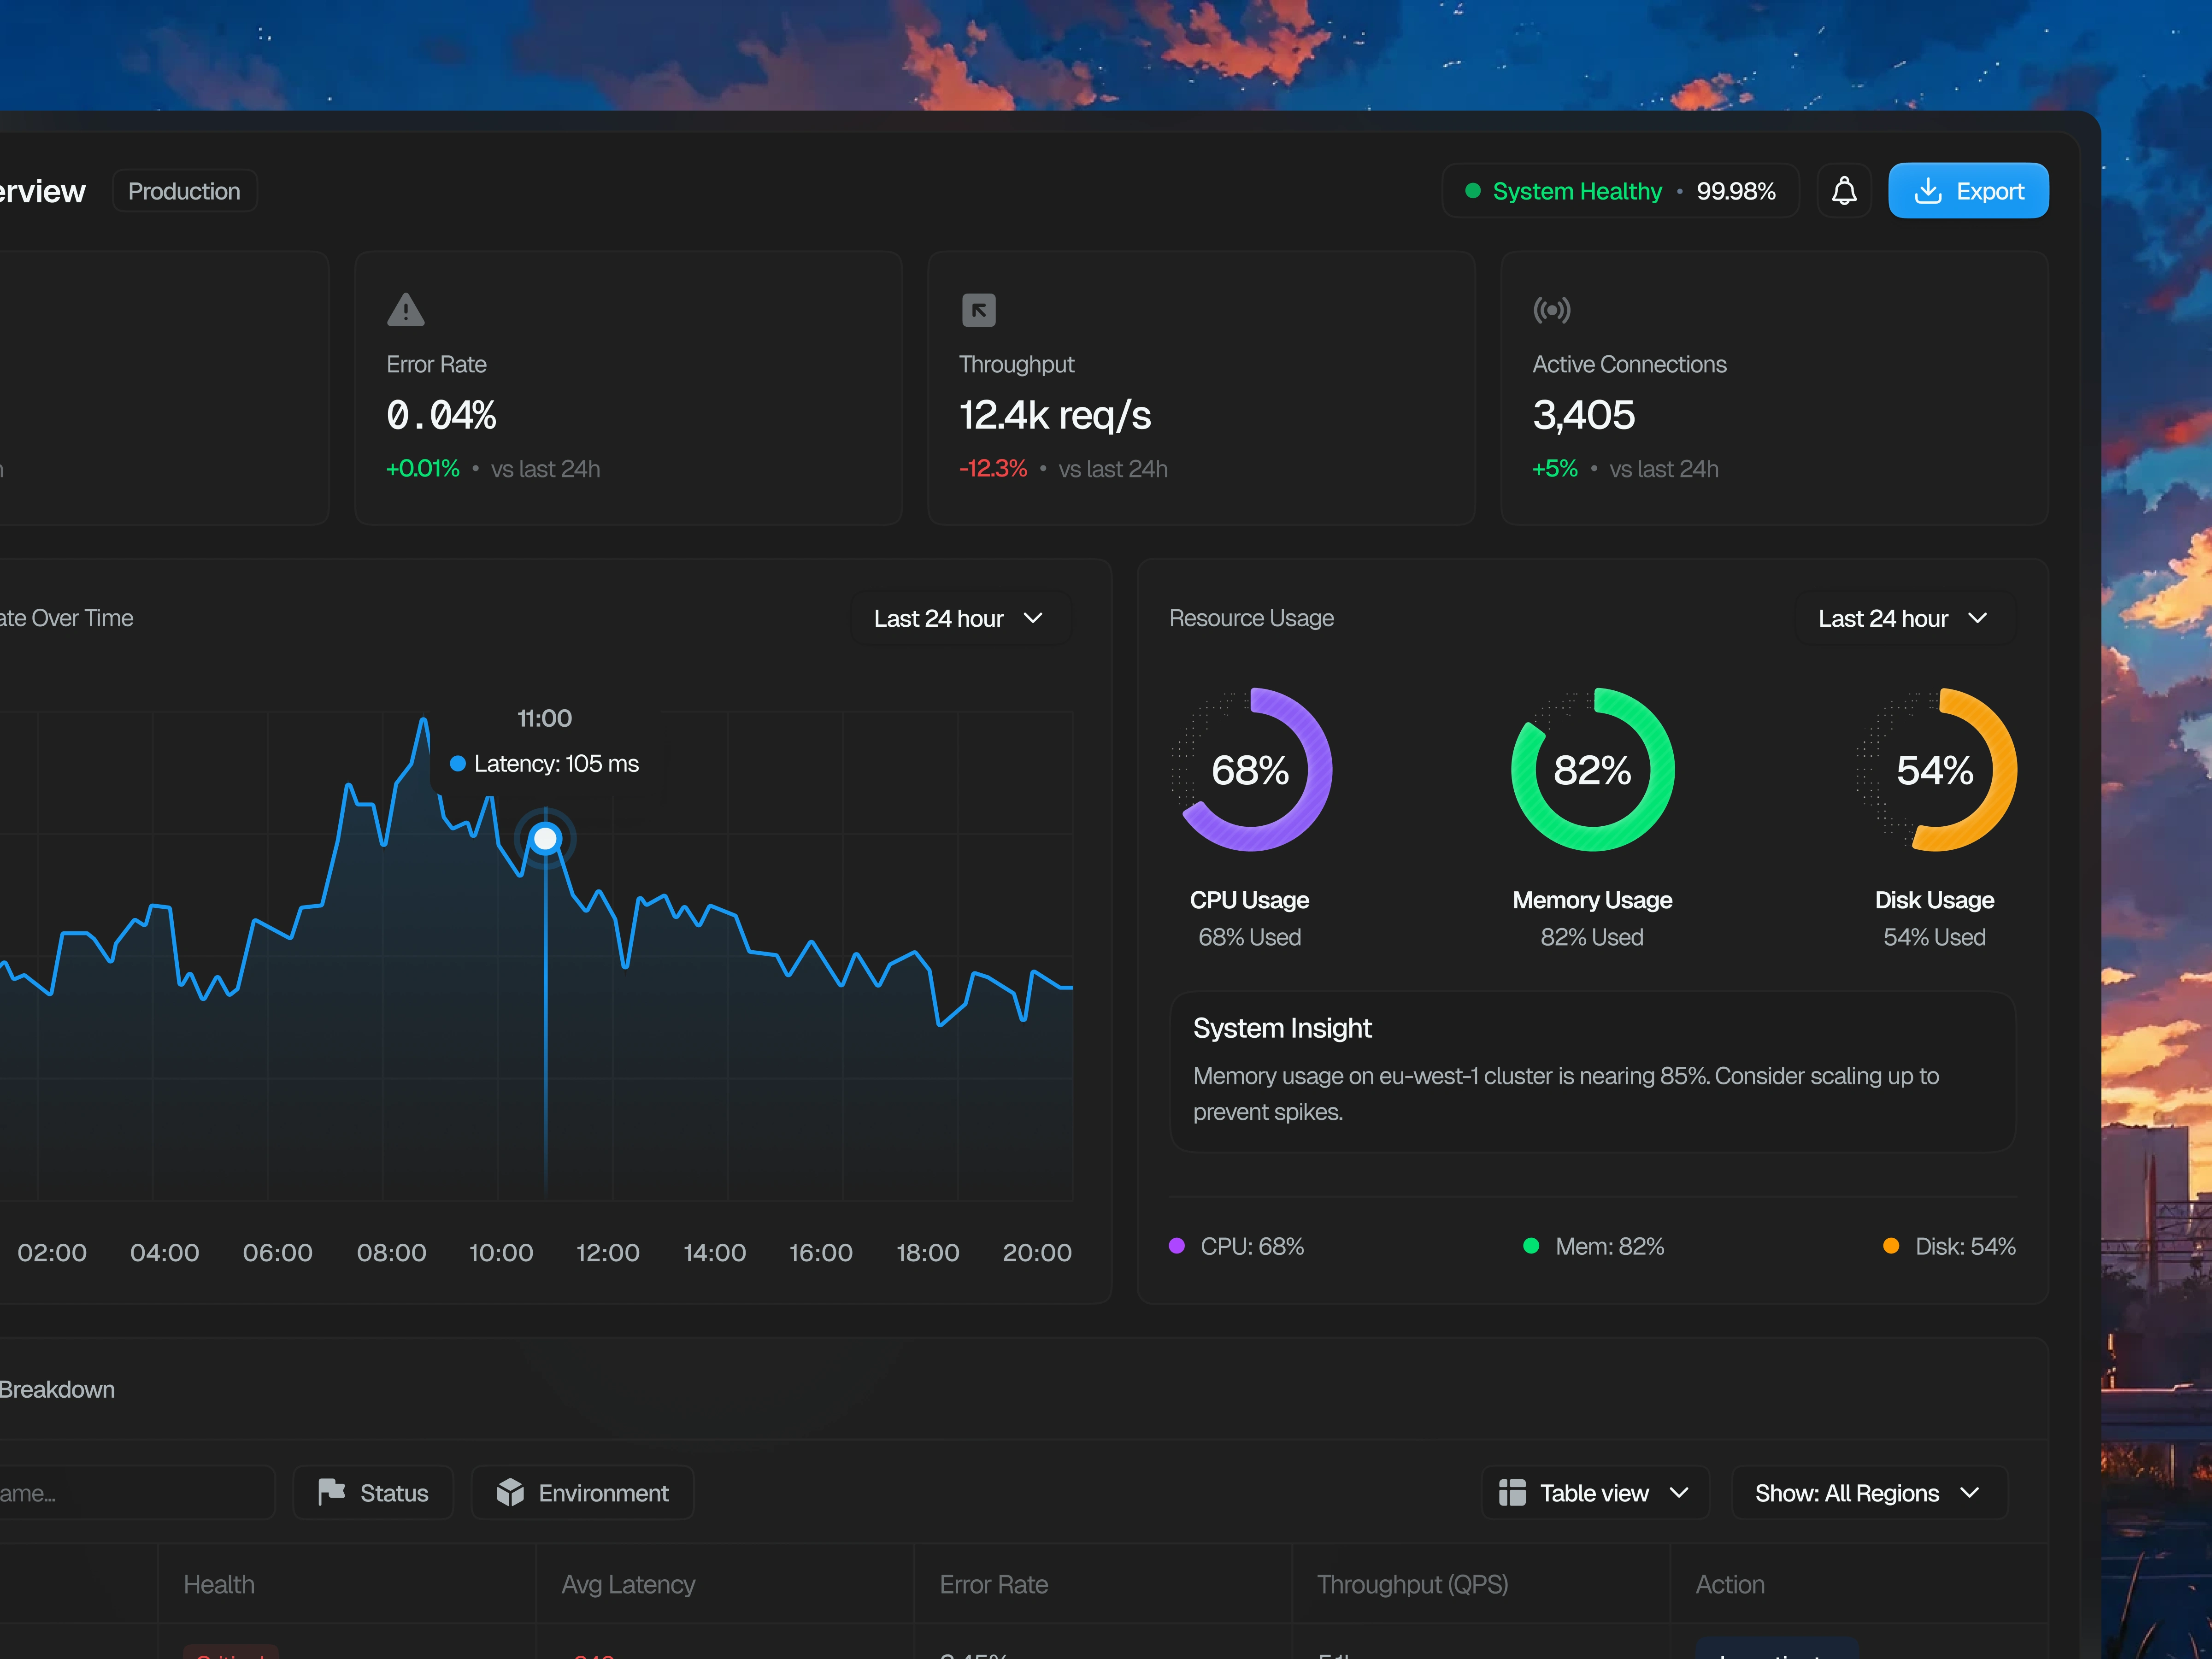
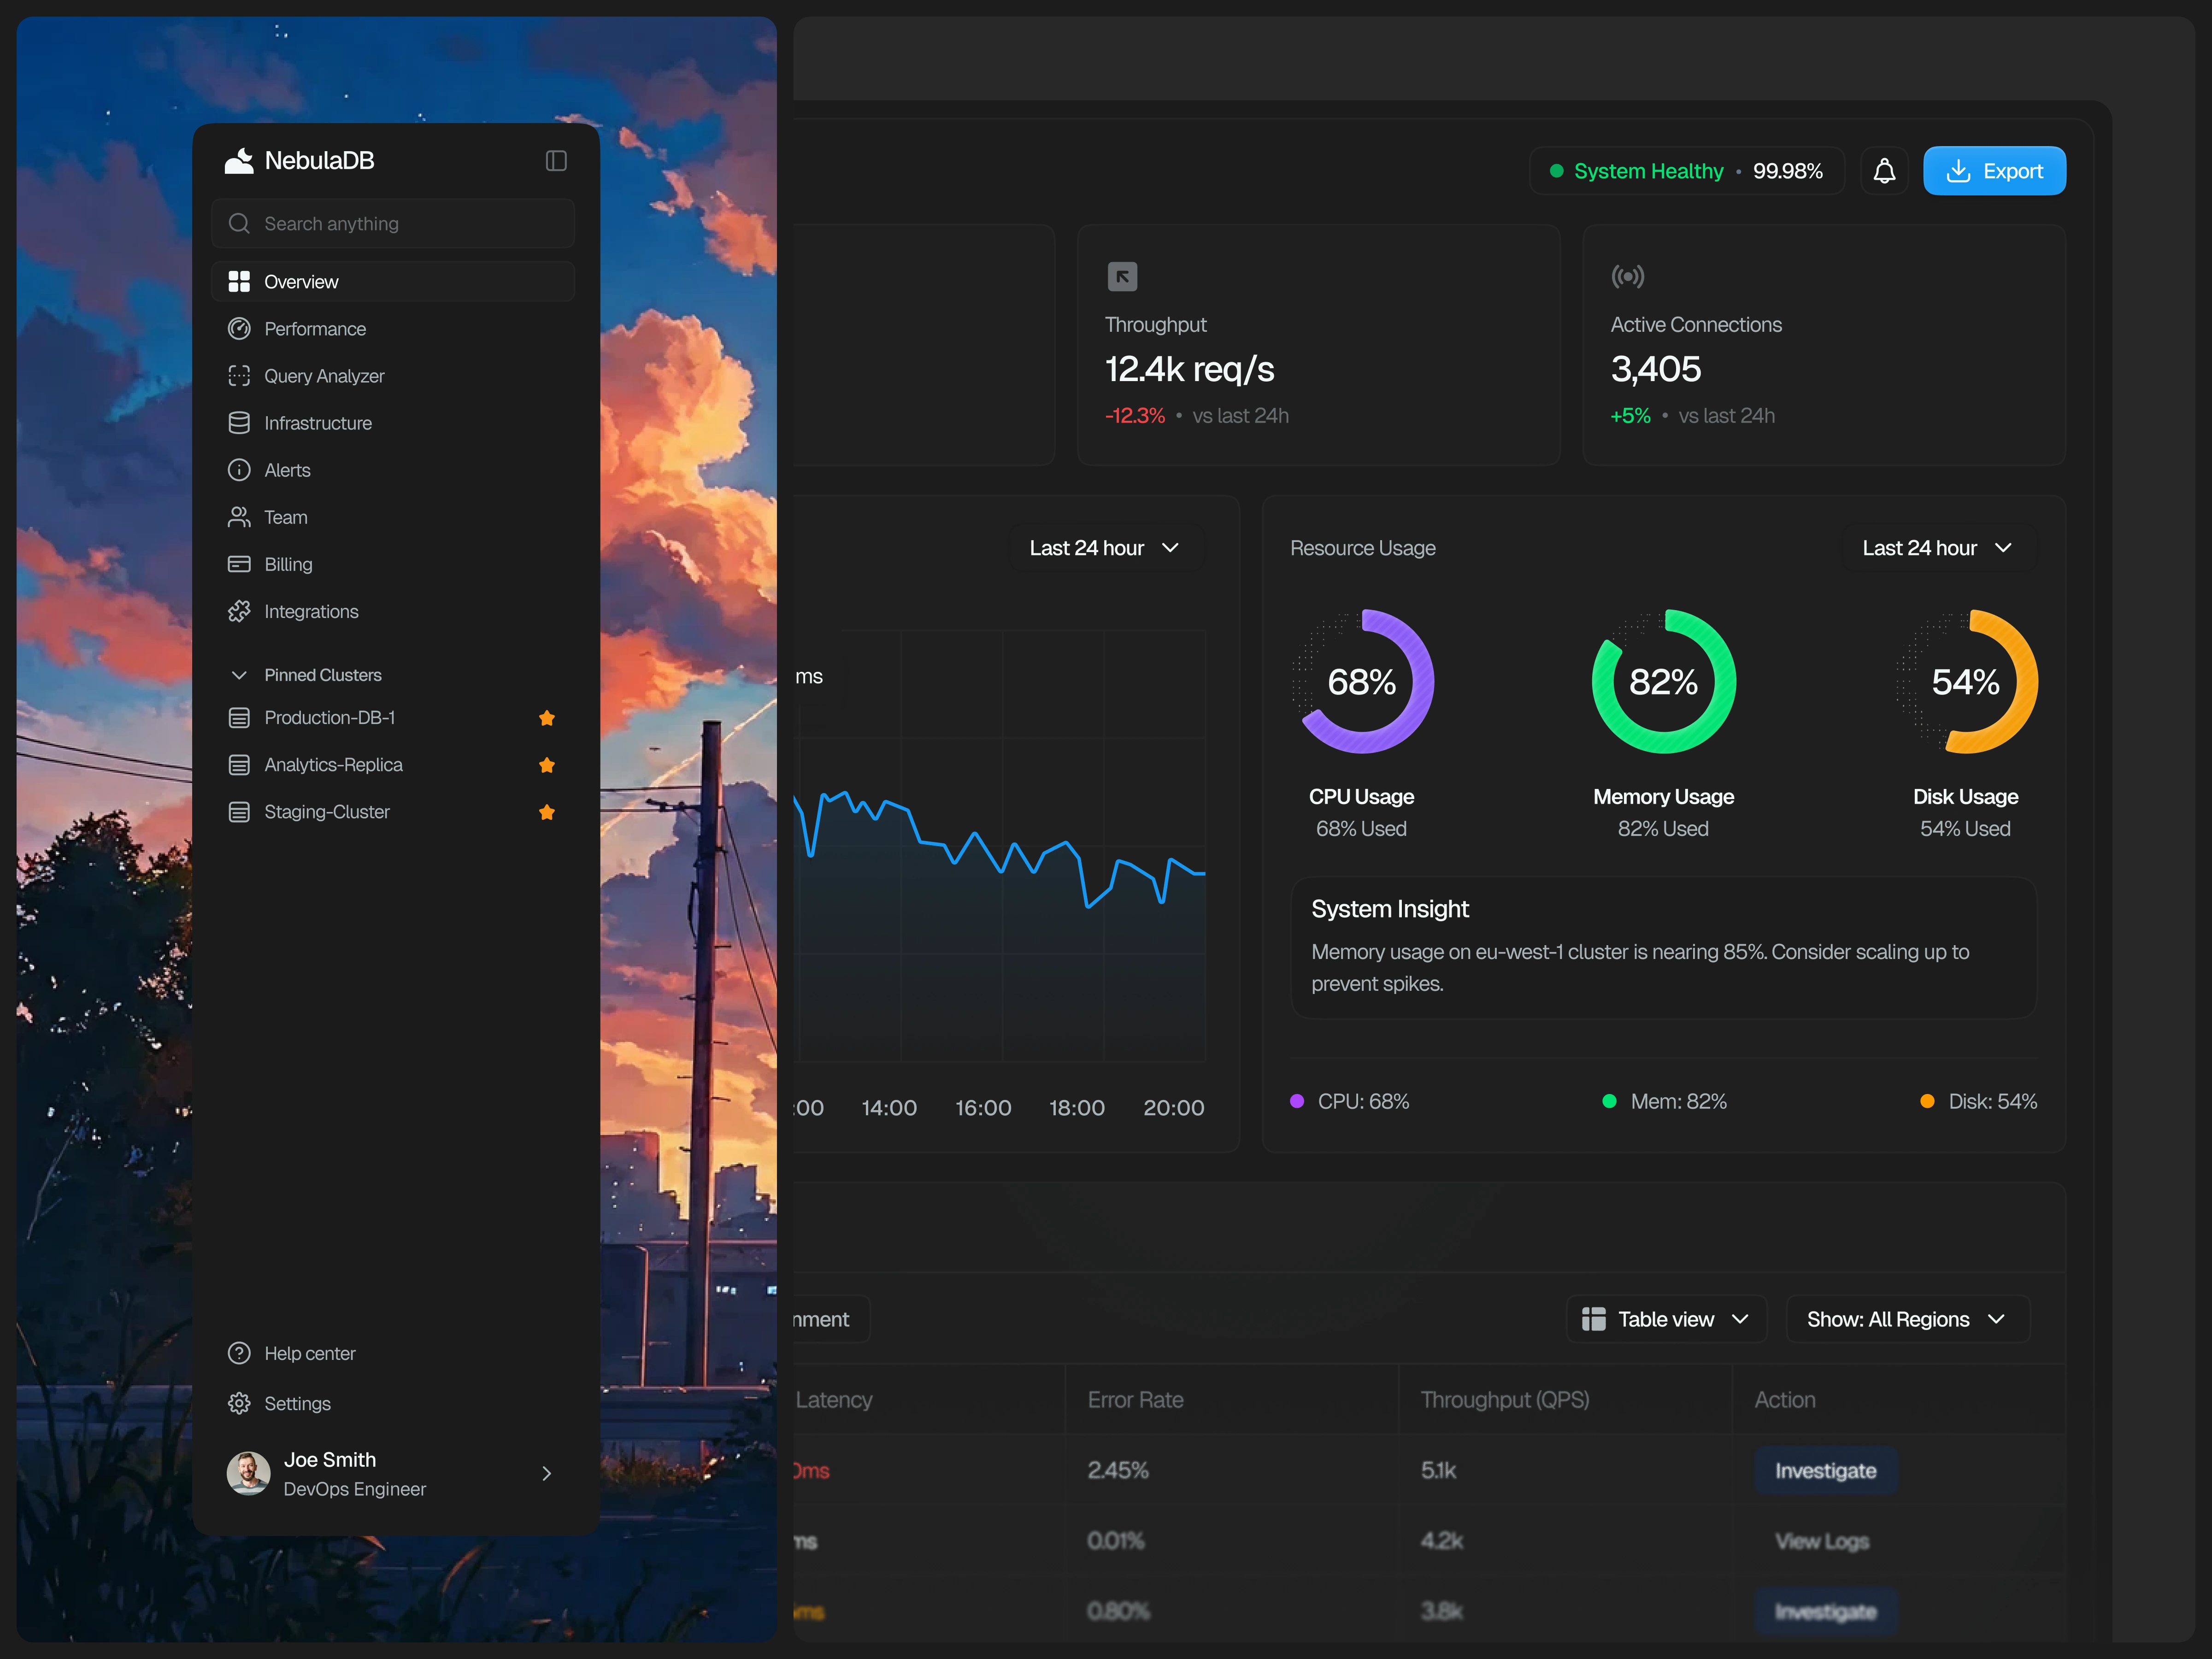
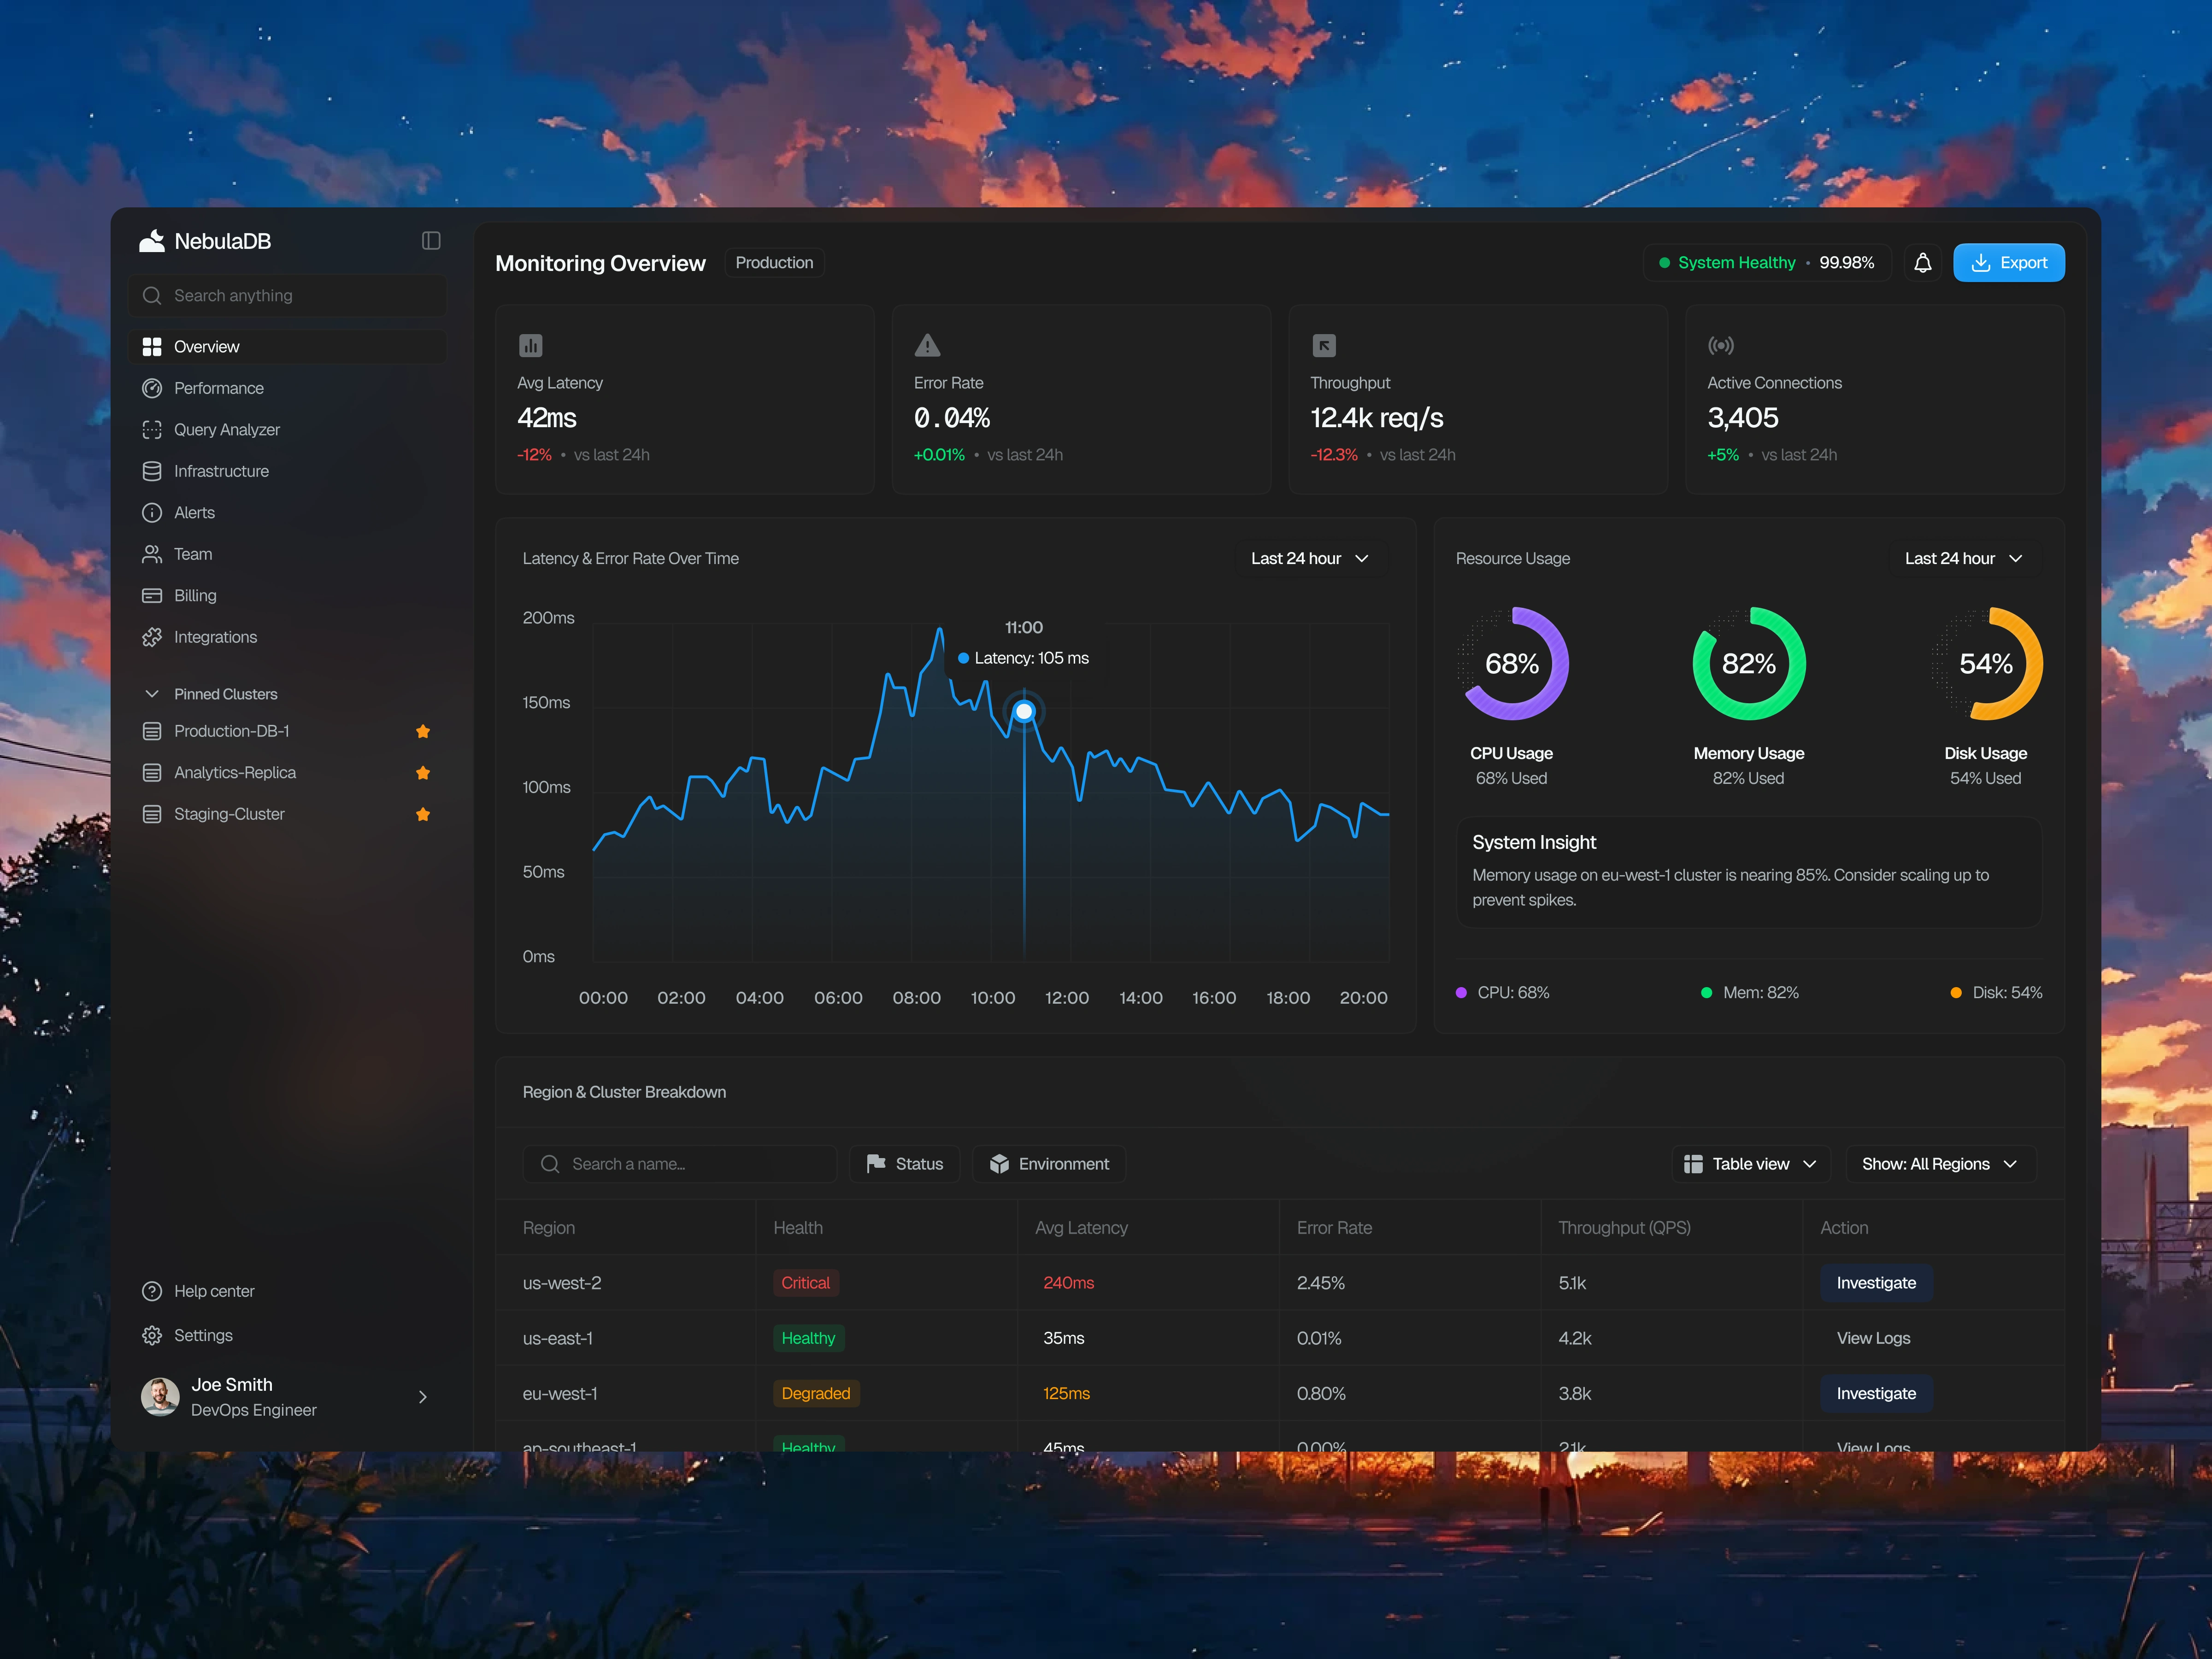
The dashboard follows a progressive information hierarchy, guiding users from a high-level overview toward deeper investigation. Key performance indicators appear first to provide an immediate system health snapshot. Below that, a time-series analytics chart visualizes latency and error rate trends, helping teams quickly identify performance spikes. Supporting components like resource usage charts and cluster health tables provide additional insights into CPU, memory, disk usage, and infrastructure stability.
The Outcome
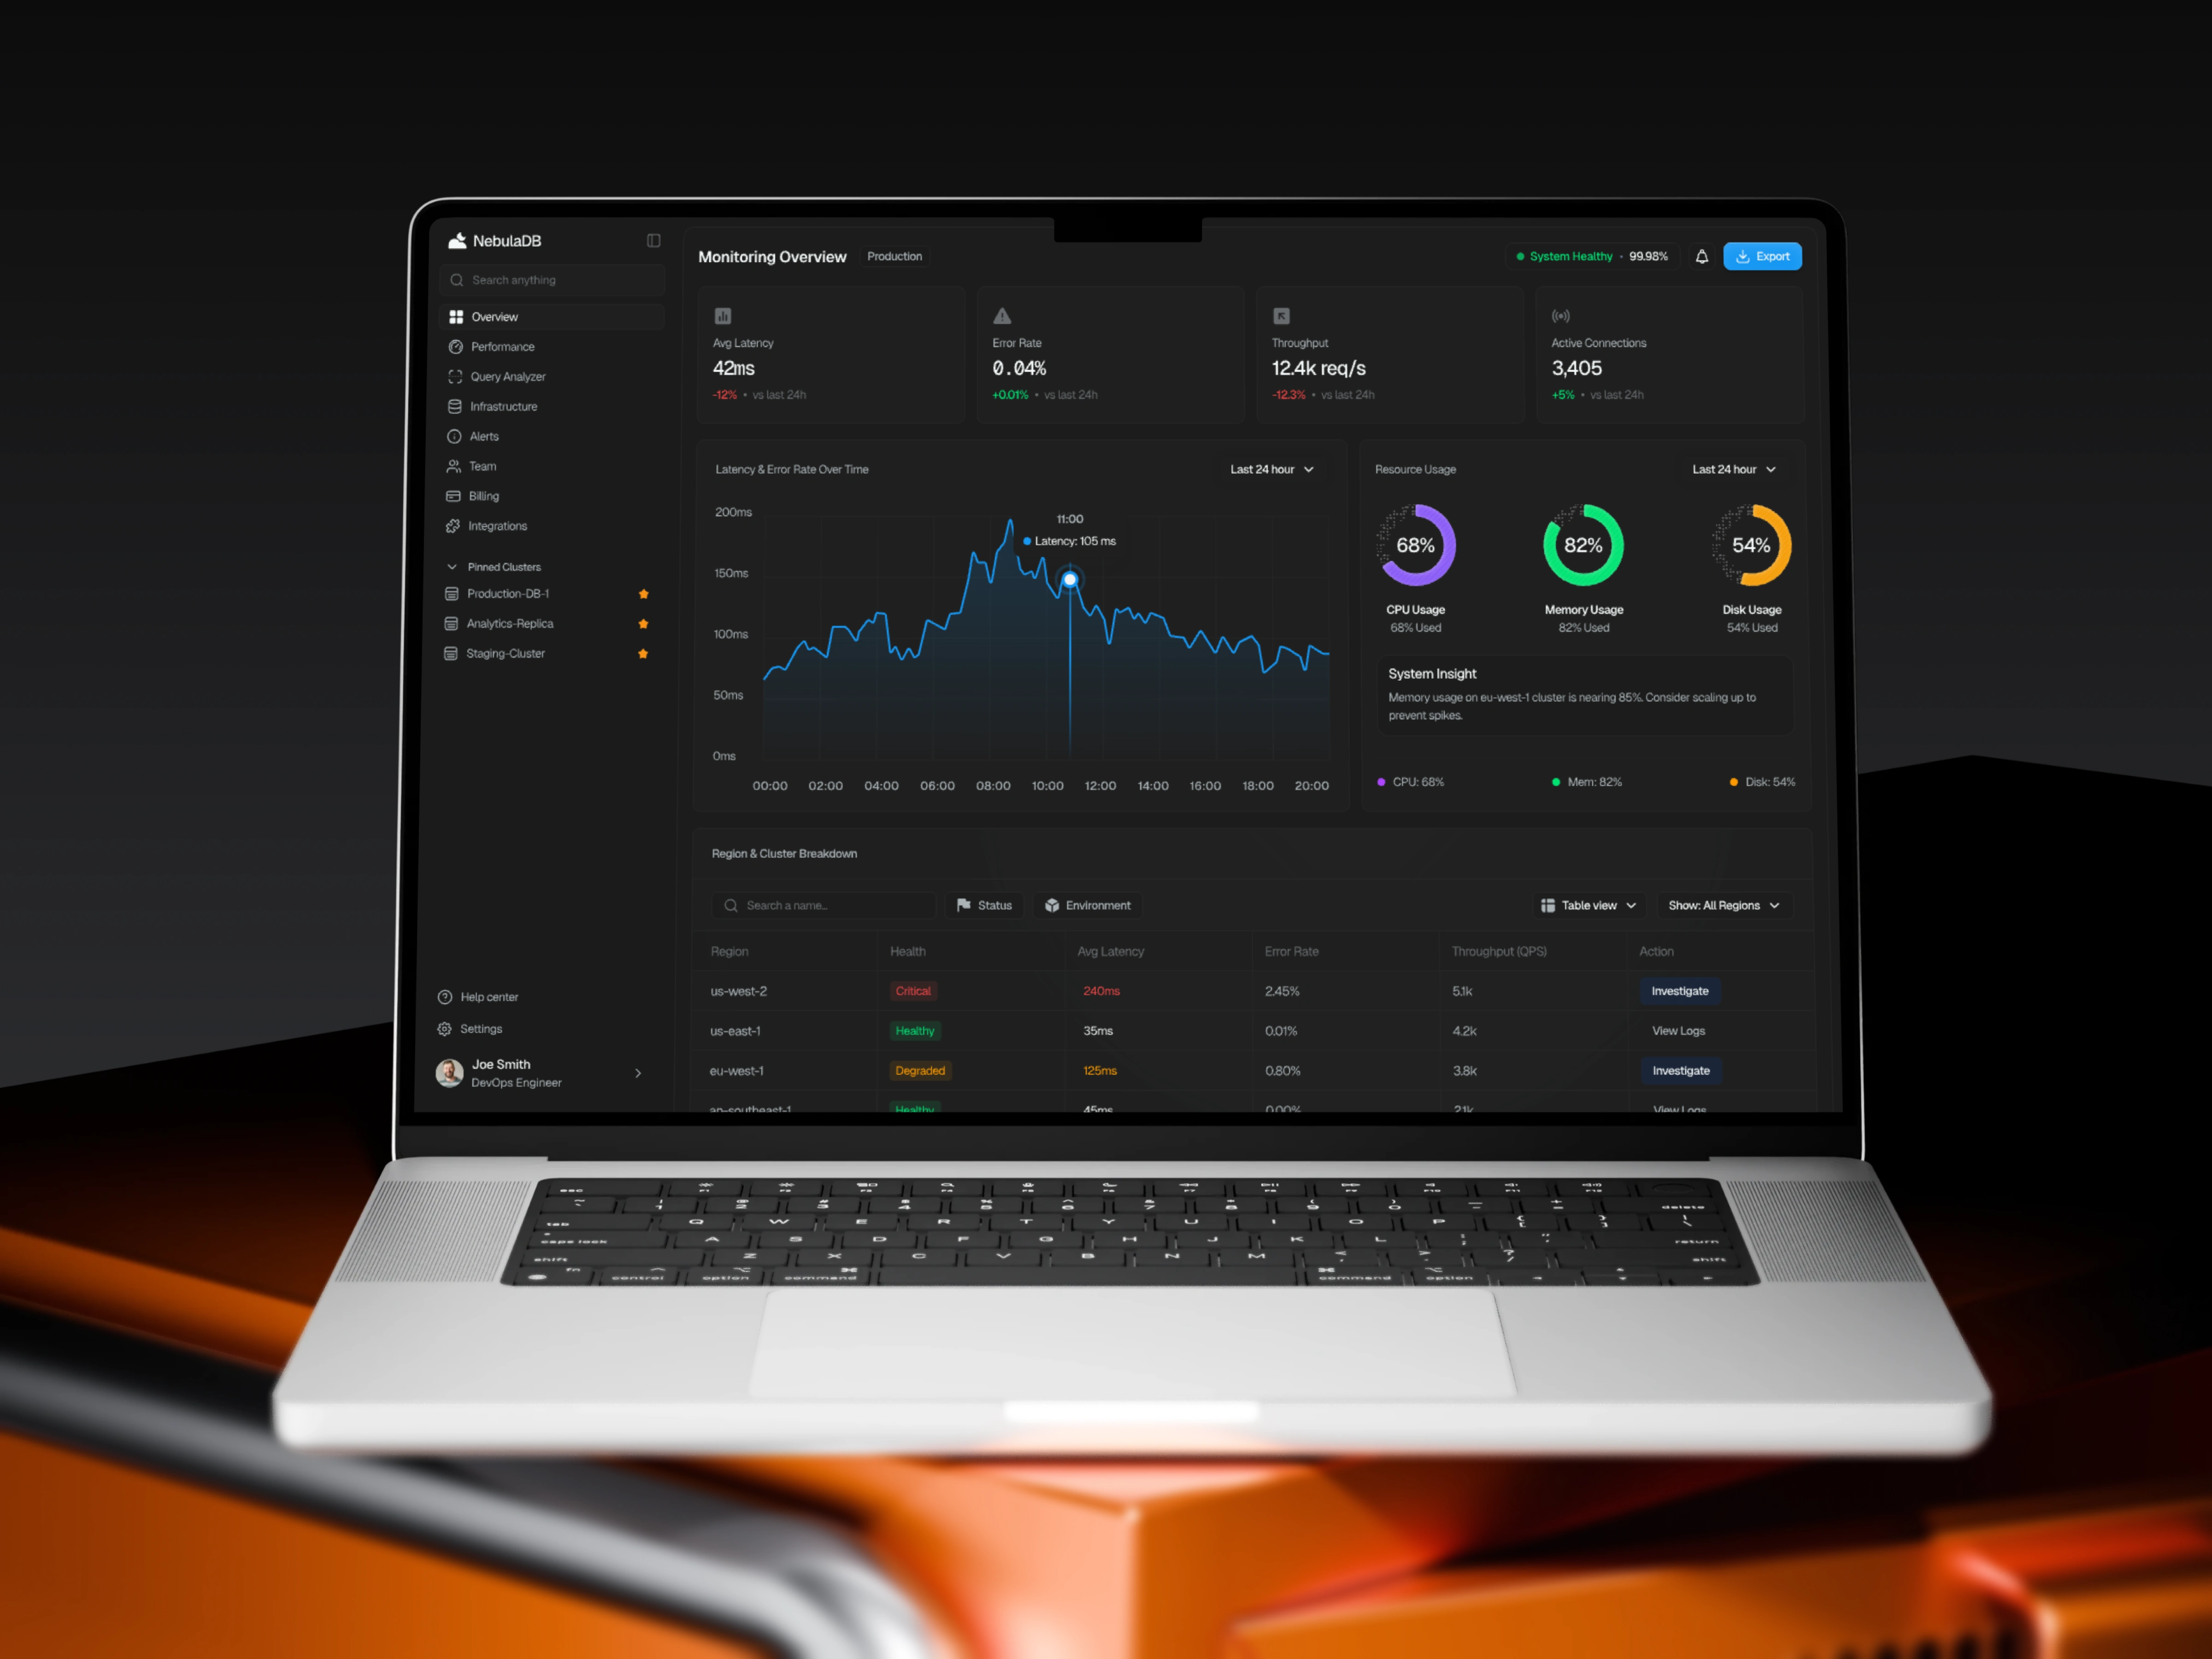
By consolidating infrastructure metrics into a single monitoring dashboard UI, the NebulaDB Console helps engineering teams detect performance issues faster and understand system behavior across regions and clusters. The result is a clean, data-driven SaaS dashboard design that improves observability while maintaining an intuitive user experience for DevOps teams and cloud engineers.
Like this project
Posted Mar 5, 2026
Modern serverless database dashboard for monitoring latency, errors, and infrastructure performance across clusters in real time.