Healthcare Analytics Visualization
Pratishthit Choudhary
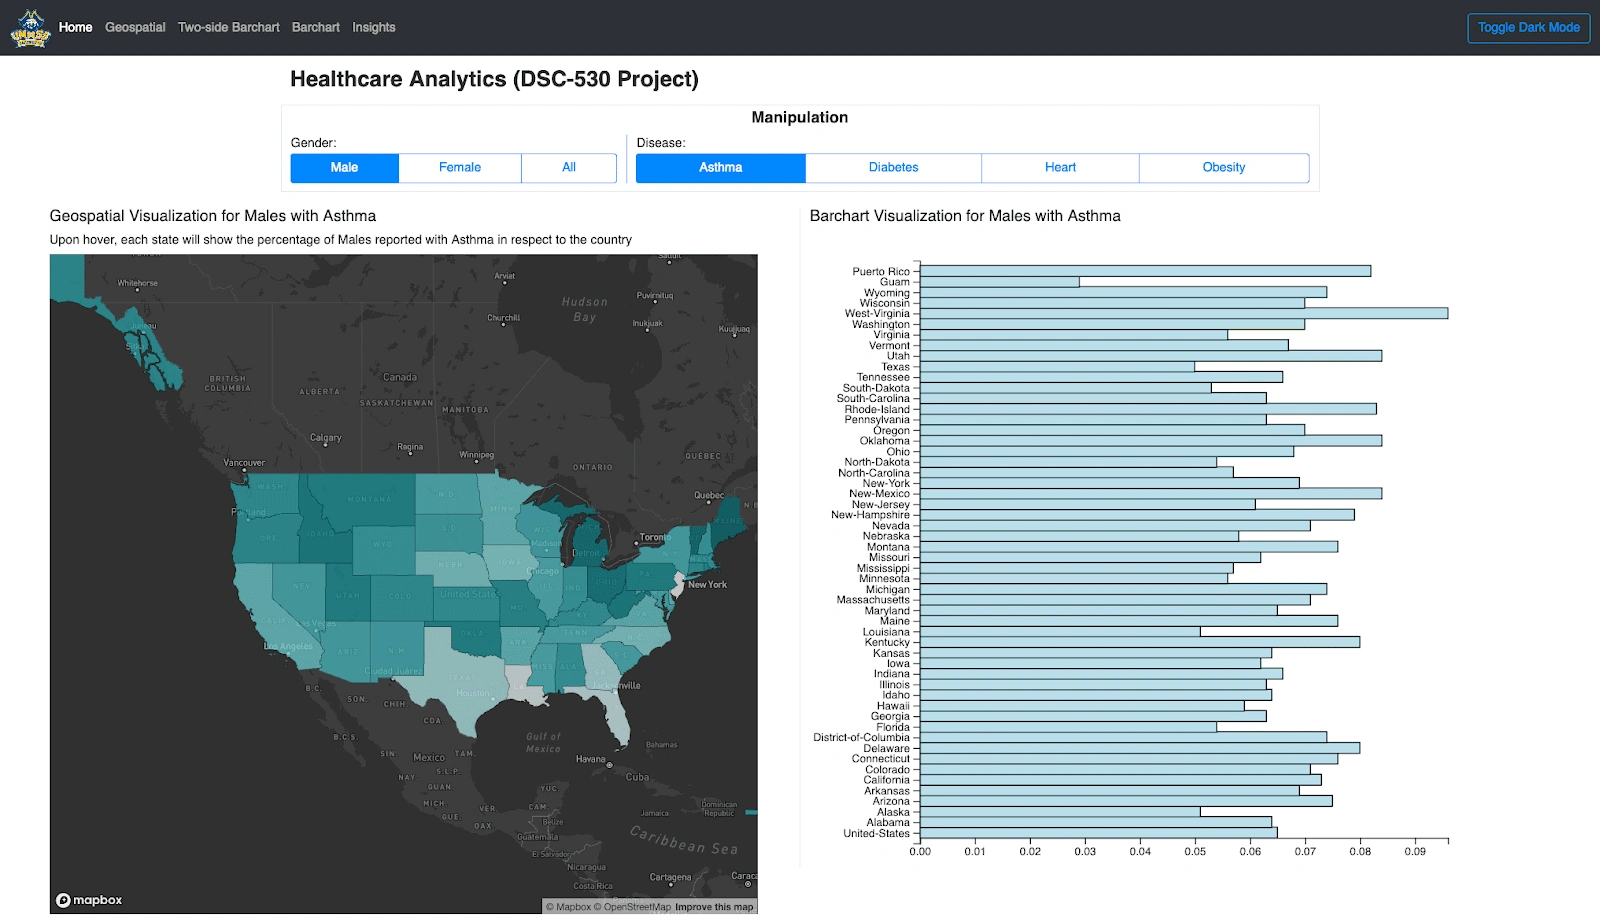
Addressed the change in disease statistics over the United States by each body part with the help of data visualization.
Incorporated JavaScript libraries such as D3.js, and Geospatial frameworks such as Deck.GL and Mapbox into a web-based visualization with HTML and CSS at the root.
The final project was then pushed to a Docker container and was then published to the Docker hub as a public image.
Like this project
Posted Jan 20, 2022
Likes
0
Views
46