VC Fund Management Platform Development

Ugo Chukwu


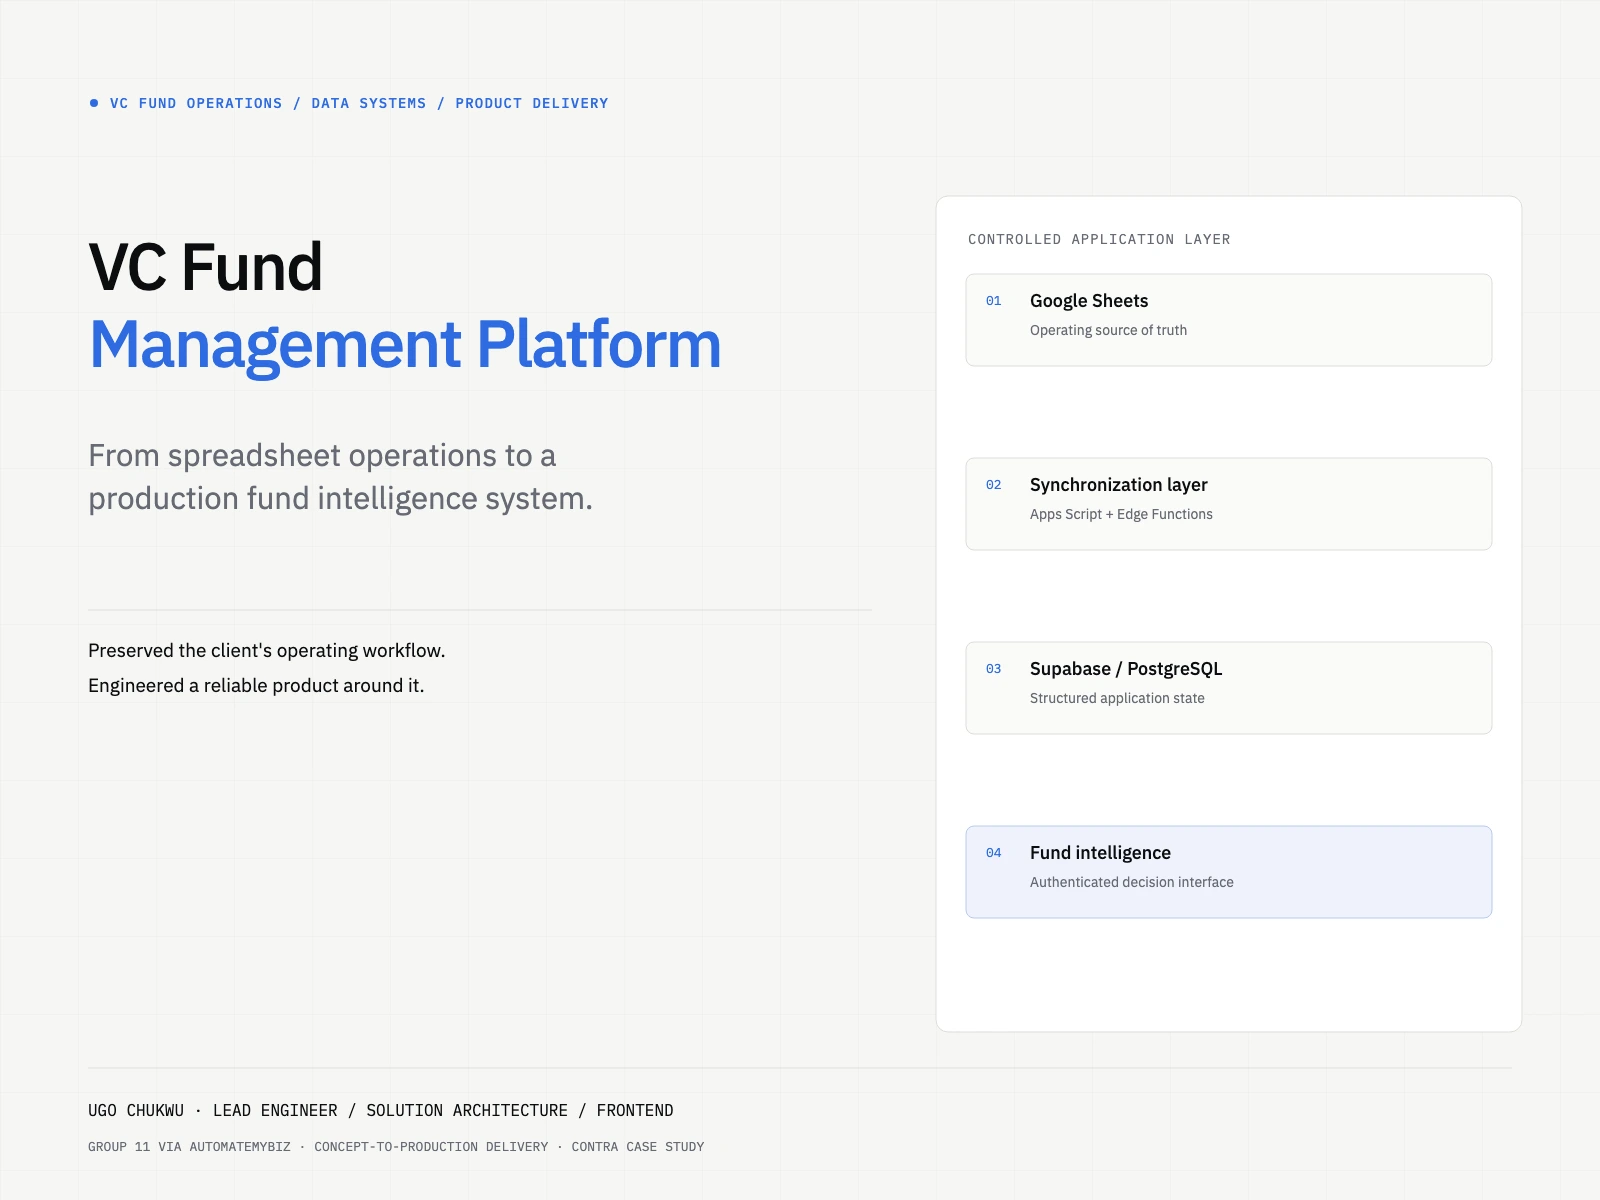
VC Fund Management Platform — From Spreadsheet Operations to a Production Fund Intelligence System
Client: Group 11 (via AutomateMyBiz)
Role: Lead Engineer · Solution Architecture · Frontend Engineering · Technical Delivery
Team: Ugo Chukwu — Lead Engineer / Frontend · Chinaza Mbonu — Backend Engineering
Delivery: Production-deployed client platform
Stack: Next.js · React · Supabase/PostgreSQL · Supabase Edge Functions · Google Apps Script · Google Sheets · Netlify
Domain: Venture Capital · Fund Operations · Portfolio Intelligence · Financial Reporting
A production fund-management platform that turned operational spreadsheets into a secure, continuously synchronized web application for fund performance, portfolio-company intelligence, investment history, revenue tracking, and investor-grade financial visibility.
Group 11 VC Fund Management Platform: preserving the client's operating workflow while engineering a reliable product around it.
Executive outcome
I led the Group 11 fund-management platform from the initial product idea through requirements definition, solution architecture, implementation leadership, frontend engineering, testing, deployment, and operational handover.
The core challenge was not simply to build a dashboard. Group 11 already had a working operating model: critical fund and portfolio information lived across structured Google Sheets used by the team. Replacing those workflows outright would have introduced unnecessary migration risk and adoption friction.
The system therefore had to preserve the spreadsheets as the operating source of truth while creating a reliable application layer around them.
The delivered architecture automatically synchronized fund and portfolio data from Google Sheets through Google Apps Script and Supabase Edge Functions into PostgreSQL, where a Next.js application exposed the information through authenticated dashboards and drill-down views.
The result was a production system that:
kept existing spreadsheet workflows intact;
synchronized monitored data automatically on edits and on a scheduled cadence;
centralized fund, portfolio-company, investment, benchmark, and revenue information in a structured cloud data layer;
gave authorized users a dedicated web interface rather than requiring them to interpret raw operational spreadsheets;
supported fund-level and company-level drill-downs, historical performance, benchmarking, investment history, and document links;
introduced role-aware authentication and profile management;
documented failure modes, breaking changes, maintenance procedures, and deployment steps for long-term operation.
This was an enterprise delivery problem: financial data had to move correctly, stale or incorrectly mapped values had to be detectable, and the final system had to remain understandable to the client after handover.
Client context
Group 11 is a US venture-capital firm focused on technology and fintech. The firm publicly reports more than $686 million deployed across six flagship funds and SPVs, with investments in companies including Navan, Tipalti, Next Insurance, HomeLight, Sunbit, and others.
The internal operating environment behind the project included multiple funds, portfolio companies, investment rounds, performance histories, benchmarks, revenue projections, and financial metrics such as AUM, TVPI, IRR, DPI, FMV, realized gains, and unrealized gains.
The product therefore sat directly in the flow of high-value fund and portfolio information. Accuracy and traceability mattered more than visual novelty.
The problem: important fund intelligence was trapped inside operating spreadsheets
Group 11's team already maintained extensive financial and portfolio data in Google Sheets. Those sheets were useful for data entry and internal operations, but they were not an ideal product interface for navigating the firm's information as a connected system.
The data was spread across separate structures representing:
fund-level performance and capital metrics;
portfolio-company master records;
Schedule of Investments data;
round-by-round investment history;
historical fund performance;
benchmark comparisons;
actual and projected portfolio-company revenue;
valuations and ownership information; and
supporting company documents.
The engineering problem had several layers.
1. Preserve the team's operating workflow
The spreadsheets were already embedded in the client's workflow. Forcing the organization to abandon them would have turned a software project into a process-migration project.
2. Convert semi-structured spreadsheet data into a reliable application model
Spreadsheet layouts are easy for humans to modify and easy for software to misread. Columns move, rows are inserted, new companies appear, sections grow, formats change, and formulas update without a manual edit event.
3. Keep the dashboard current without manual exports
The application could not rely on someone periodically downloading CSV files or copying values into another database.
4. Make fund data navigable as a product
A senior user should be able to move from firm-level metrics into a fund, from a fund into its holdings, and from a portfolio company into its investment history, revenue trajectory, documents, and fund associations.
5. Design for operational failure, not only the happy path
A sync trigger could stop. A header could be renamed. An Edge Function could fail. A frontend deployment could break. A source spreadsheet could change structure.
The system needed an explicit operating model for identifying those failures and recovering from them.
My role and ownership
I served as Lead Engineer for the engagement through AutomateMyBiz.
I owned the project from the initial concept through final deployment, including:
translating the client's operating needs into a product and system definition;
identifying the source-of-truth model and integration constraints;
defining the end-to-end architecture;
decomposing the system into data synchronization, API, database, authentication, and frontend concerns;
defining the frontend information architecture and user flows;
building the Next.js/React frontend and integrating it with the application APIs;
directing technical implementation across the project;
coordinating and reviewing the backend work implemented by the supporting backend engineer;
resolving data-mapping and integration issues across frontend and backend boundaries;
validating the deployed system against real client workflows;
leading deployment and final handover; and
producing operational documentation for maintenance and breaking changes.
Chinaza Mbonu supported the engagement as Backend Engineer, implementing the backend/data synchronization layer while I led architecture, product direction, integration, and delivery and built the frontend.
That division of responsibility is important: my contribution was both hands-on engineering and technical leadership, not an attempt to claim sole authorship of every line of the system.
Architecture: keep the source of truth, add a controlled application layer
The core architecture was intentionally straightforward:
Why this architecture
The key decision was to avoid creating a second operational truth.
The client continued to update the spreadsheets they already understood. The application layer synchronized those changes into structured database records and presented them through a controlled product interface.
That separation created three useful boundaries:
Google Sheets remained the editing surface.
PostgreSQL became the structured application state.
The web application became the consumption and analysis surface.
This reduced retraining and migration risk while still giving the organization a proper software product around the data.
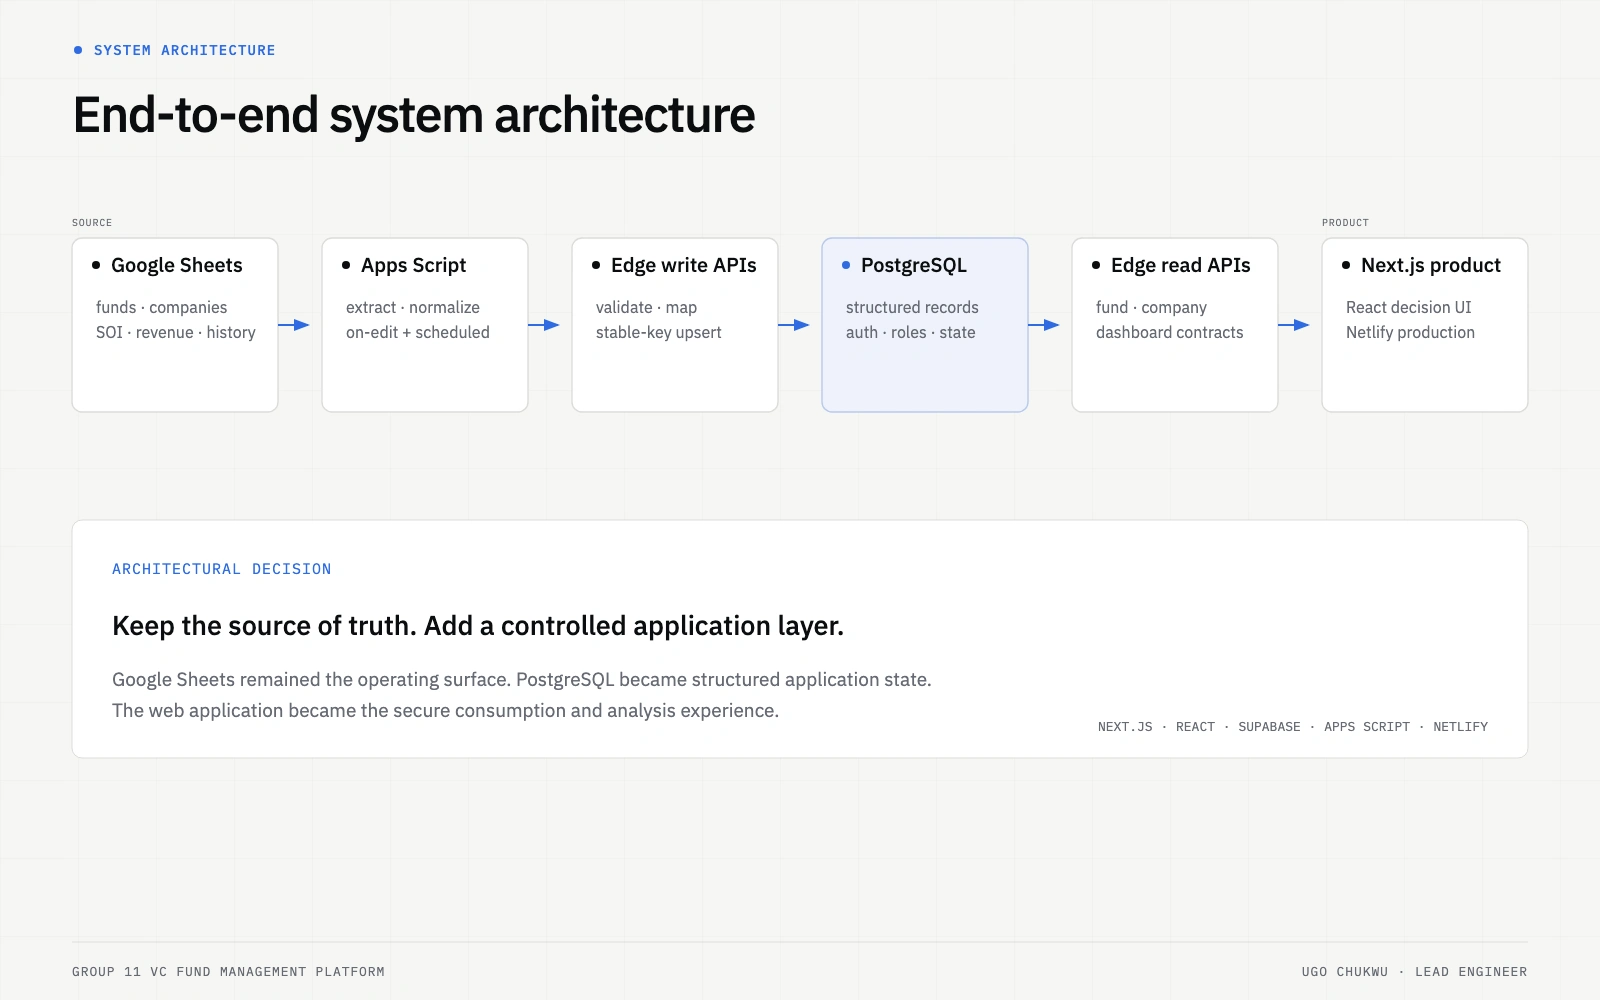
The architecture retained Google Sheets as the editing surface, PostgreSQL as application state, and the web platform as the secure decision interface.
Data synchronization: designing around a fragile source without pretending it was a database
The system synchronized data from the client's master spreadsheets through a set of Google Apps Script extractors and Supabase Edge Functions.
The documented implementation included separate sync paths for:
fund performance, totals, benchmarks, and historical financials;
portfolio-company master data;
Schedule of Investments;
investment history;
detailed flagship investment history; and
actual/projected portfolio-company revenue.
Event-driven + scheduled synchronization
The pipeline used two synchronization modes:
on-edit synchronization for direct changes to monitored sheets; and
scheduled synchronization every 15 minutes to capture formula-driven or indirect changes that may not produce a normal manual edit event.
For monitored manual edits, the system documentation records dashboard updates typically appearing within 5–15 seconds.
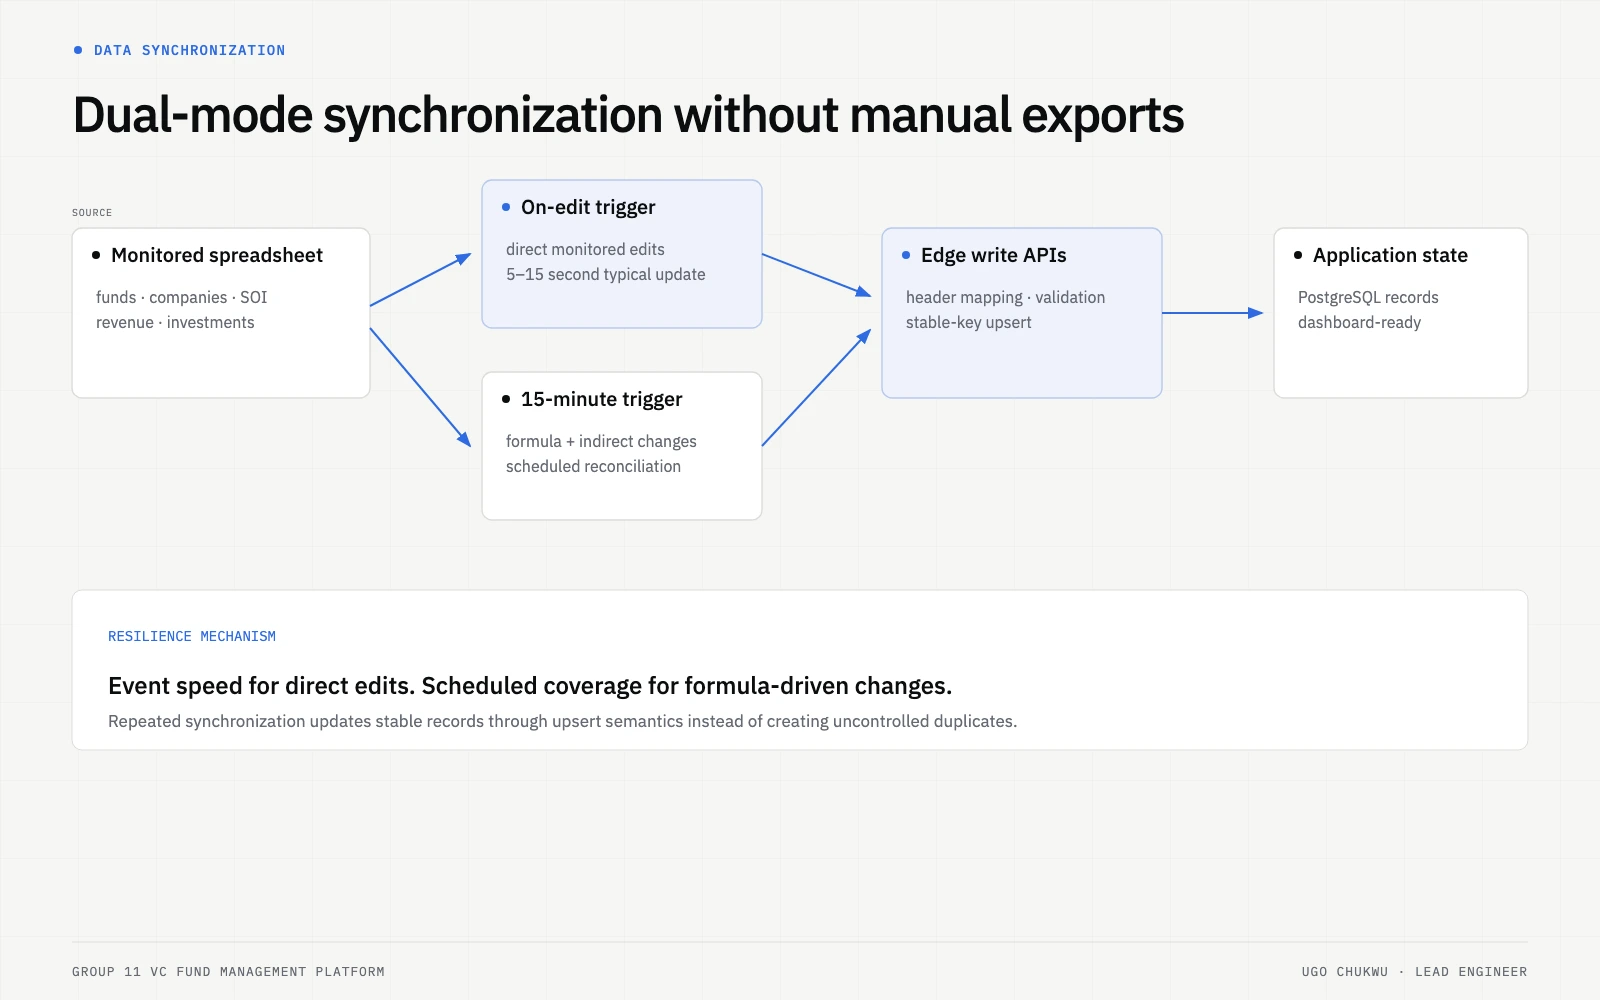
Direct edits moved quickly through the on-edit path, while scheduled synchronization captured formula-driven and indirect changes.
Dynamic column mapping
One of the most consequential implementation decisions was avoiding hard-coded column numbers wherever the source structure permitted it.
The extraction logic resolved columns by header name at runtime. This meant that:
columns could be reordered without corrupting the sync;
unrelated new columns could be introduced safely;
many row-position changes could be tolerated; and
the client did not have to freeze the entire spreadsheet layout permanently.
This was not possible for every source section. Where a spreadsheet contained structurally brittle areas, the project documented those dependencies explicitly rather than pretending they did not exist.
Data model and APIs
The application converted the spreadsheet structures into explicit data contracts inside Supabase/PostgreSQL.
Core entities included:
funds — fund identity, vintage, TVPI, IRR, benchmark and performance data;fund_totals — aggregate portfolio metrics;portfolio_companies — company master data, valuation, FMV and investment-history metadata;schedule_of_investments_soi — per-fund holdings and position structures;company_revenue_data — actual and projected revenue by company and year;investment_history — round-level investment events; andusers — identity, role, and profile state.Write APIs used upsert semantics around stable conflict keys so repeated syncs updated existing records rather than creating uncontrolled duplicates.
Read APIs were separated by product concern, including:
dashboard metrics;
fund totals and fund performance;
fund detail views;
portfolio-company lists and breakdowns;
company detail views;
authentication and profile management; and
editable fund/company commentary.
This gave the frontend a predictable interface rather than coupling React components directly to spreadsheet-specific structures.
Frontend engineering: turning investment data into a navigable operating product
I built the frontend around the way a fund team needs to move through information rather than around the shape of the source spreadsheets.
The delivered application included six primary product surfaces:
Home — firm-level overview and headline metrics.
Portfolio — high-level portfolio visibility.
Performance — fund and revenue performance views.
Companies — portfolio-company search, filtering, sorting, and comparison.
Company Detail — company profile, valuation, fund associations, revenue, investment history, and supporting document links.
Fund Detail — fund performance, benchmarks, Schedule of Investments, and position-level drill-down.
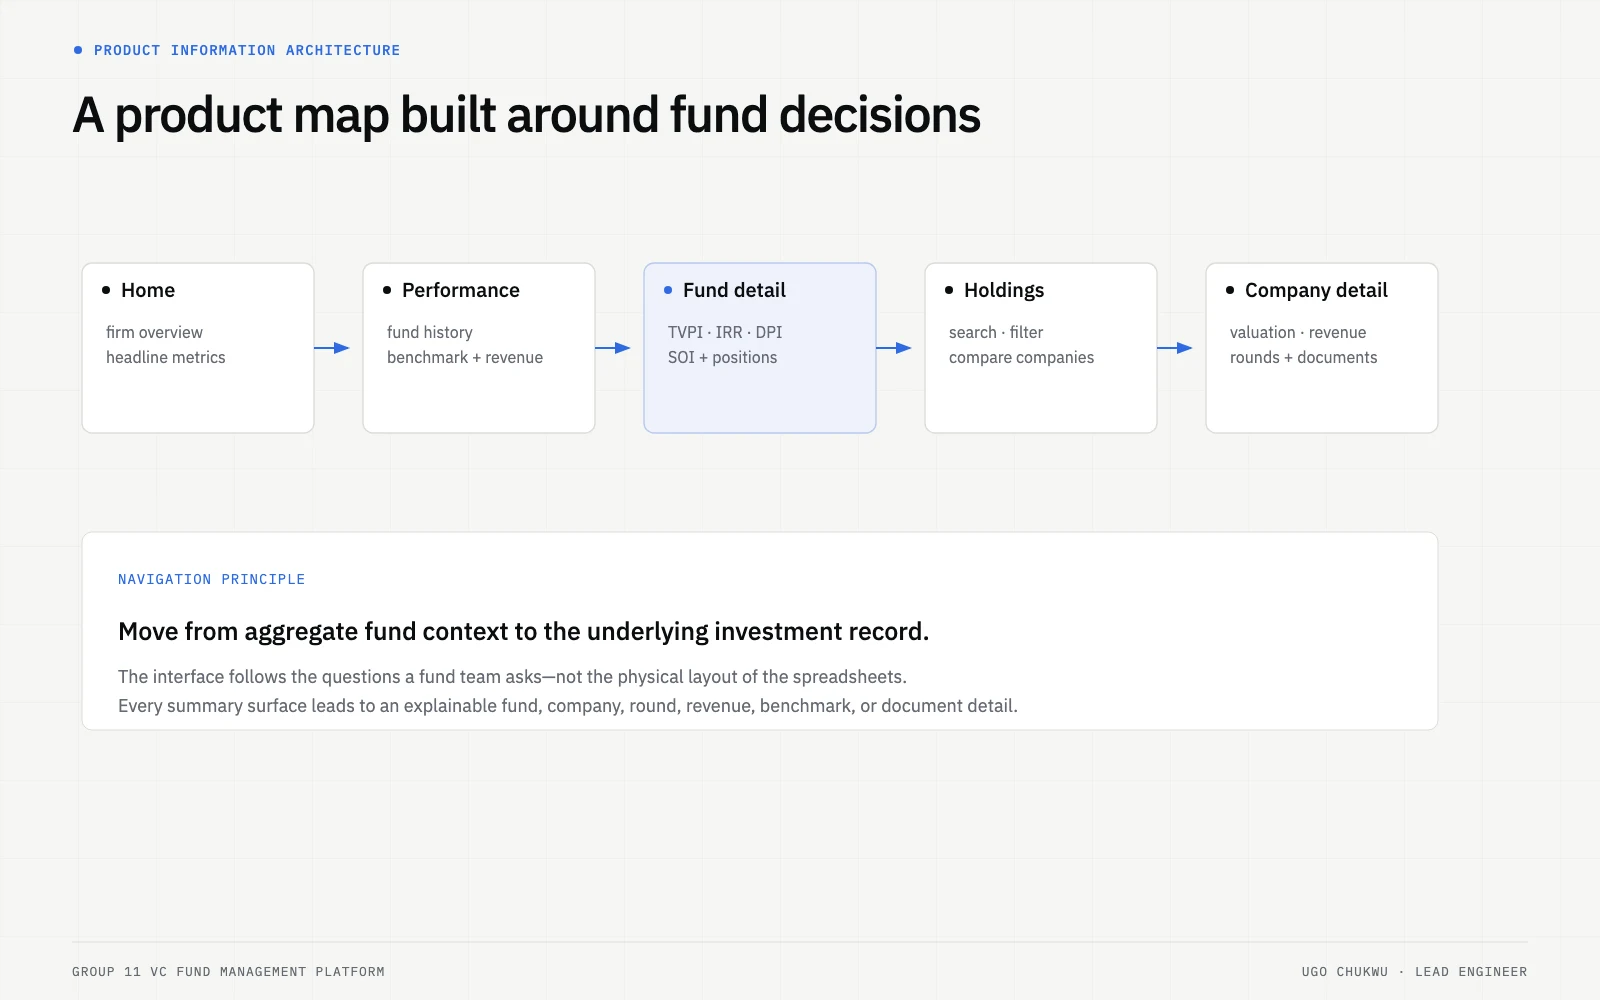
The information architecture follows the fund team's decision path rather than reproducing the physical layout of the source spreadsheets.
The frontend consumed dedicated React hooks mapped to the Edge Function read APIs rather than placing data-fetching logic directly inside presentation components.
Product-level details included
authenticated sign-in and session handling;
role-aware access and user profiles;
firm and fund-level financial metric cards;
fund performance tables;
historical performance and revenue charts;
portfolio-company search, filters, and sorting;
company and fund commentary controls;
drill-down from aggregate views into underlying fund/company data; and
responsive handling of large, uneven financial tables.
The interface was deployed through Netlify and integrated with the production Supabase environment.
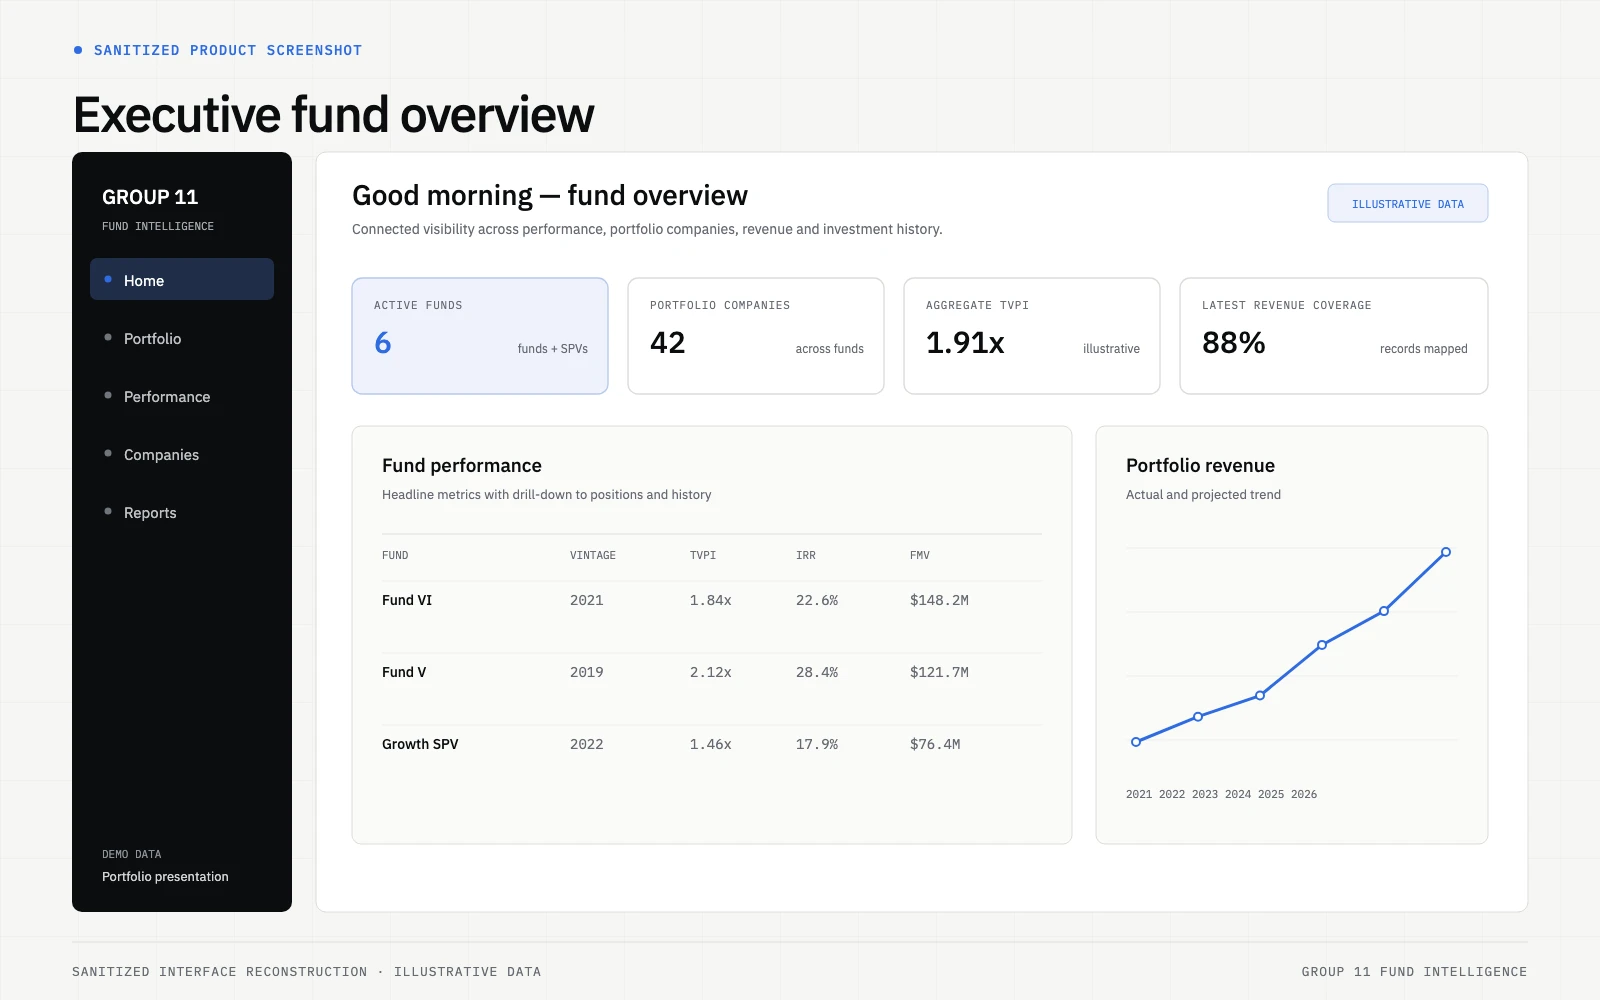
Sanitized interface reconstruction with illustrative data: a firm-level view of funds, portfolio coverage, performance and revenue.
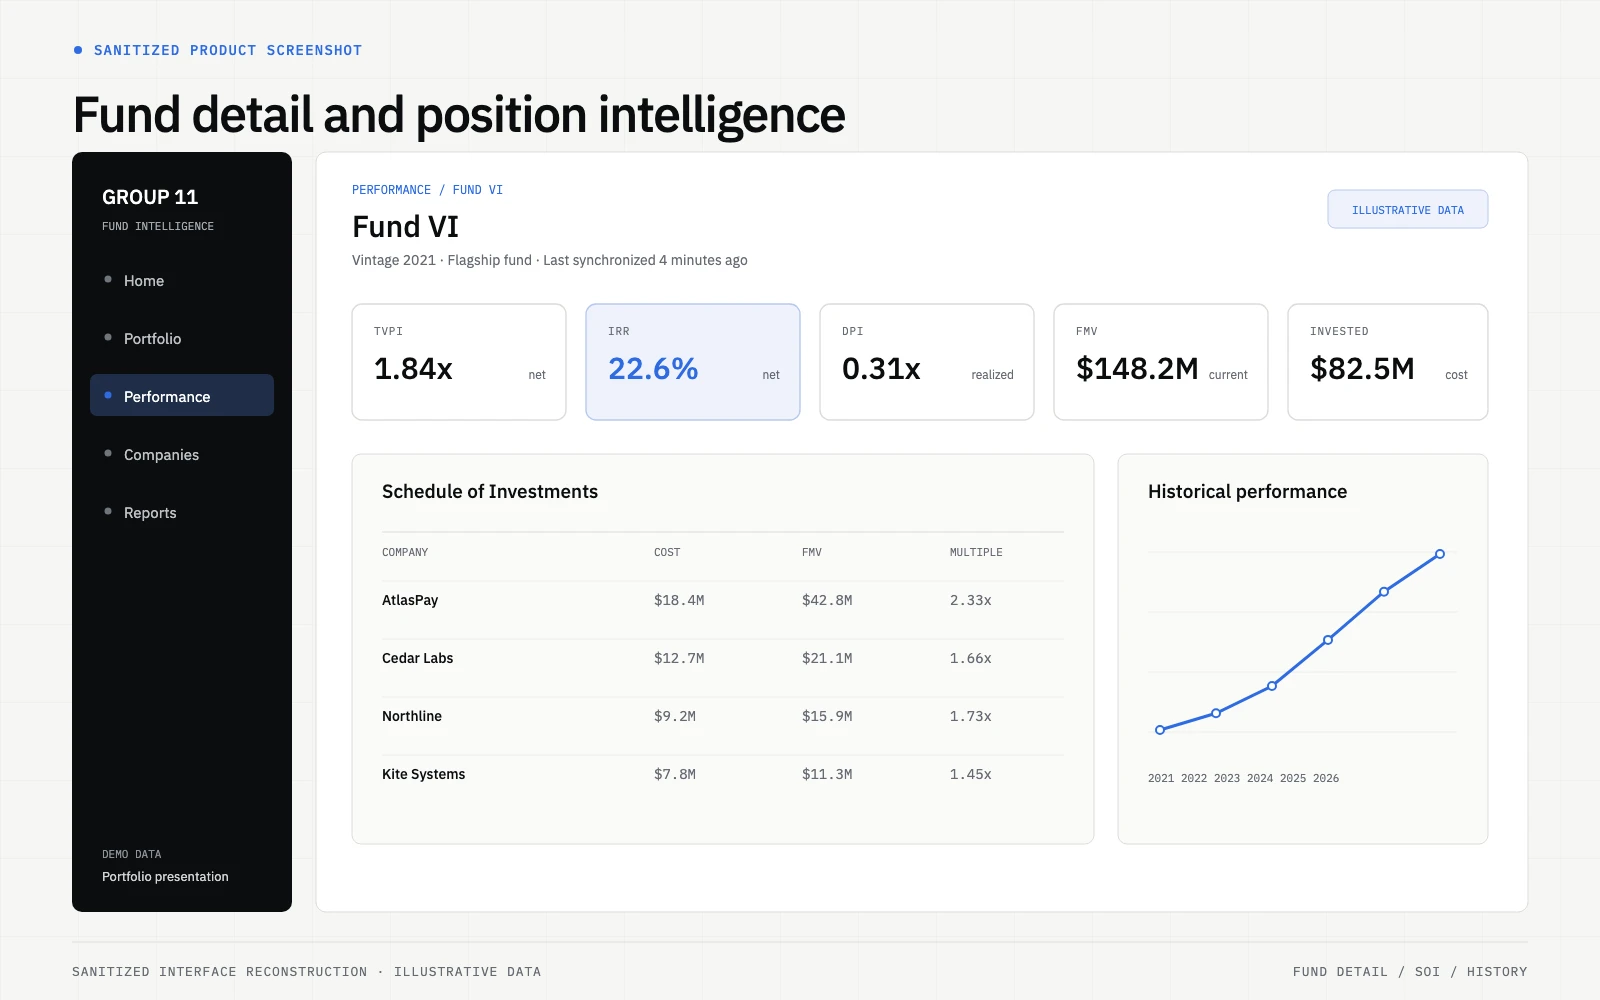
Sanitized interface reconstruction with illustrative data: fund-level metrics connected to underlying holdings and performance history.
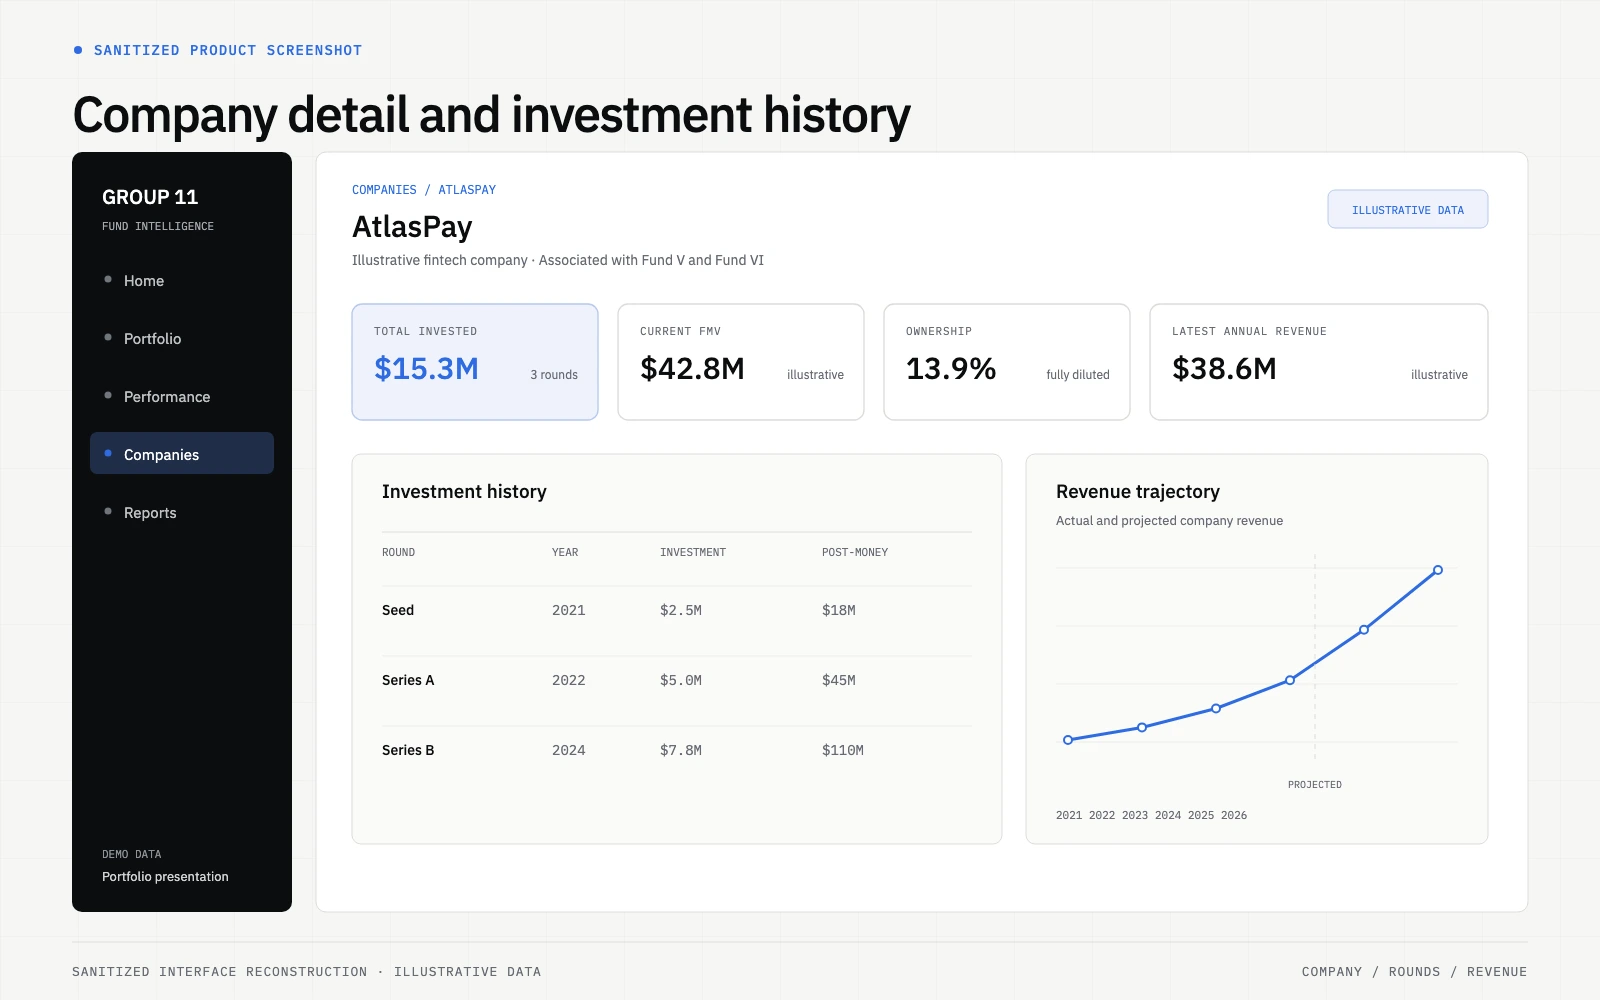
Sanitized interface reconstruction with illustrative data: a portfolio company connected to its fund associations, round history and revenue trajectory.
Reliability: documenting the places where spreadsheet-backed systems break
A major part of engineering this system responsibly was acknowledging that Google Sheets is flexible precisely because it does not enforce application contracts.
Instead of relying on tribal knowledge, we produced a Breaking Changes Reference Guide that separated changes into two categories:
Safe structural changes
Depending on the sheet, the pipeline was designed to tolerate changes such as:
moving columns left or right;
adding unrelated columns;
reordering company rows;
adding/removing portfolio companies;
inserting rows above dynamically discovered sections;
changing number formatting; and
adding new historical date columns.
Explicit breaking changes
The documentation identified specific changes that could break mapping, including:
renaming required sheet tabs;
renaming required headers;
moving required header rows in certain sources;
changing fund-section naming patterns;
removing structural section markers; and
modifying hard-coded positions inside especially irregular spreadsheet regions.
This turned a fragile integration into an operable integration: the remaining brittleness was known, documented, and diagnosable.
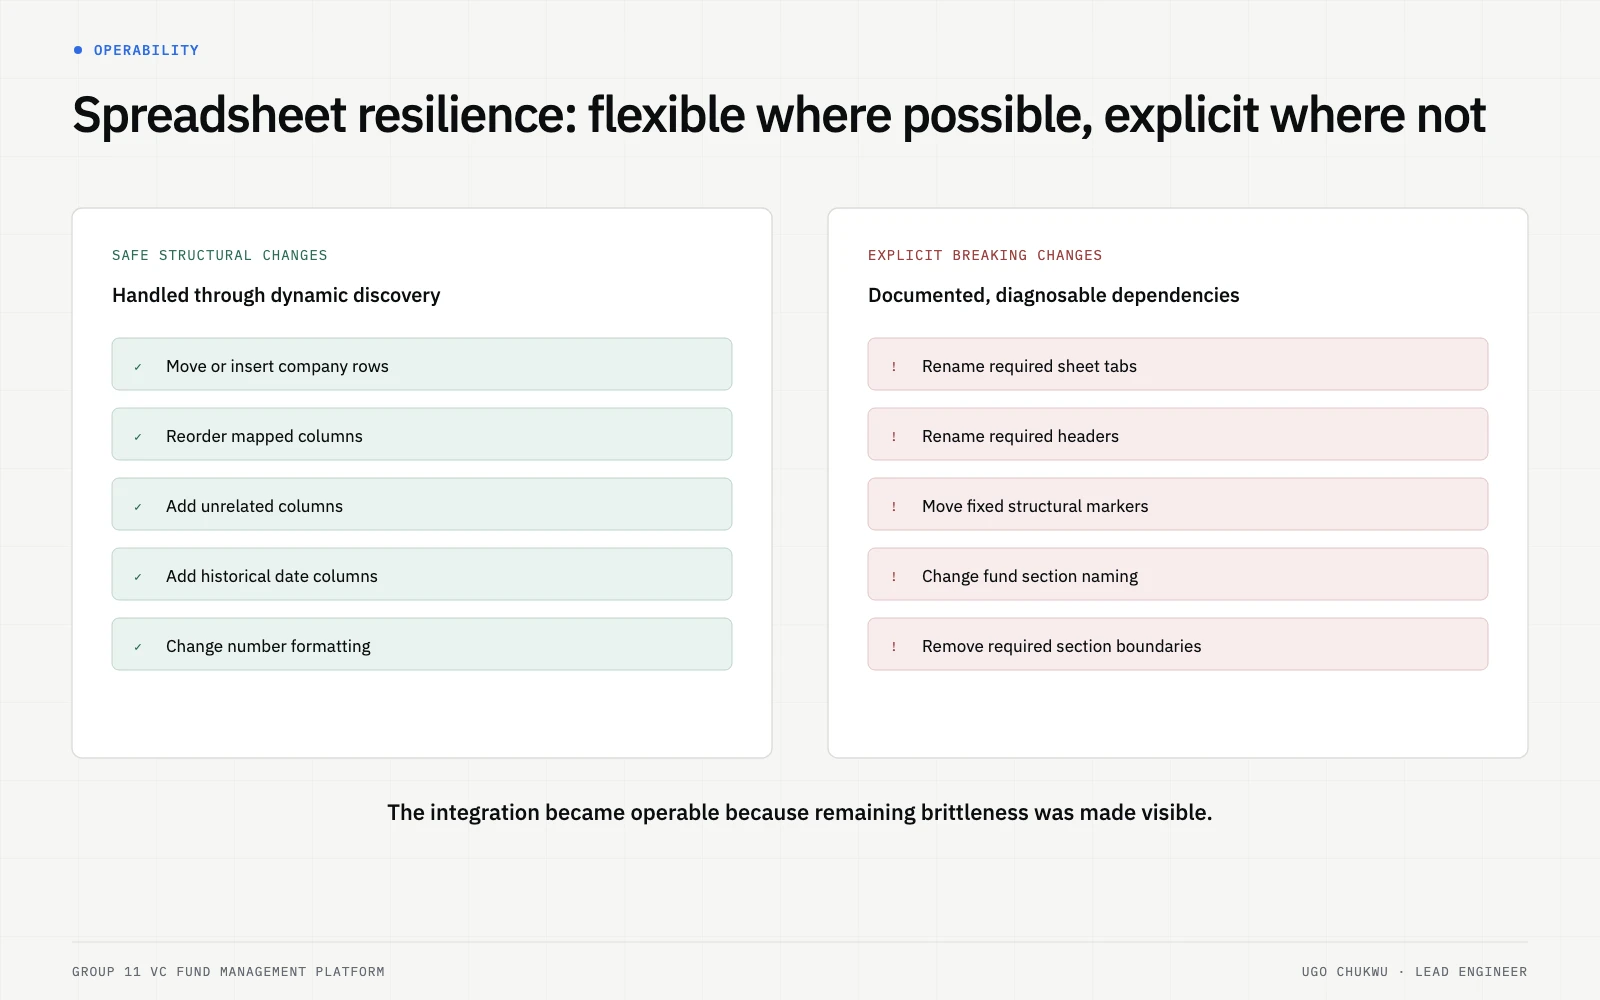
Dynamic discovery absorbed common spreadsheet changes; the remaining structural dependencies were documented instead of hidden.
Authentication and access boundaries
The product included email/password authentication through Supabase Auth.
The authentication flow returned both the user session and application profile. Subsequent API calls included the access token, with session refresh handled through the Supabase client.
The application supported administrative and viewer roles and included profile-management functions.
Sensitive service-role access remained inside Edge Functions rather than being exposed directly to the browser.
The goal was not to over-engineer enterprise IAM. It was to create a clear boundary between authenticated application users, frontend requests, API functions, and privileged database operations.
Operational handover: deployment was not the end of the project
A system handling fund information needs an operating model after launch.
The handover package therefore included both technical documentation and a recurring maintenance checklist.
The monthly maintenance process covered four areas:
Data pipeline
confirm all six synchronization triggers remain active;
perform a test edit and verify the dashboard updates;
inspect Apps Script logs for recurring failures;
inspect Edge Function logs for server errors; and
verify critical spreadsheet headers have not been renamed.
Frontend and UI
verify all six core product pages load with real data;
check browser-console health;
test company search, filtering, and sorting;
verify chart rendering; and
confirm the Netlify production deployment is healthy.
Authentication
test sign-in, redirect, and sign-out;
manage pending users and role changes; and
confirm admin editing capabilities.
Database
verify the Supabase project and API configuration;
spot-check dashboard values against database records; and
inspect unusual invocation or storage patterns.
The maintenance checklist also captured actual post-deployment issues and fixes, including UI alignment, a broken brand asset, and data-health checks.
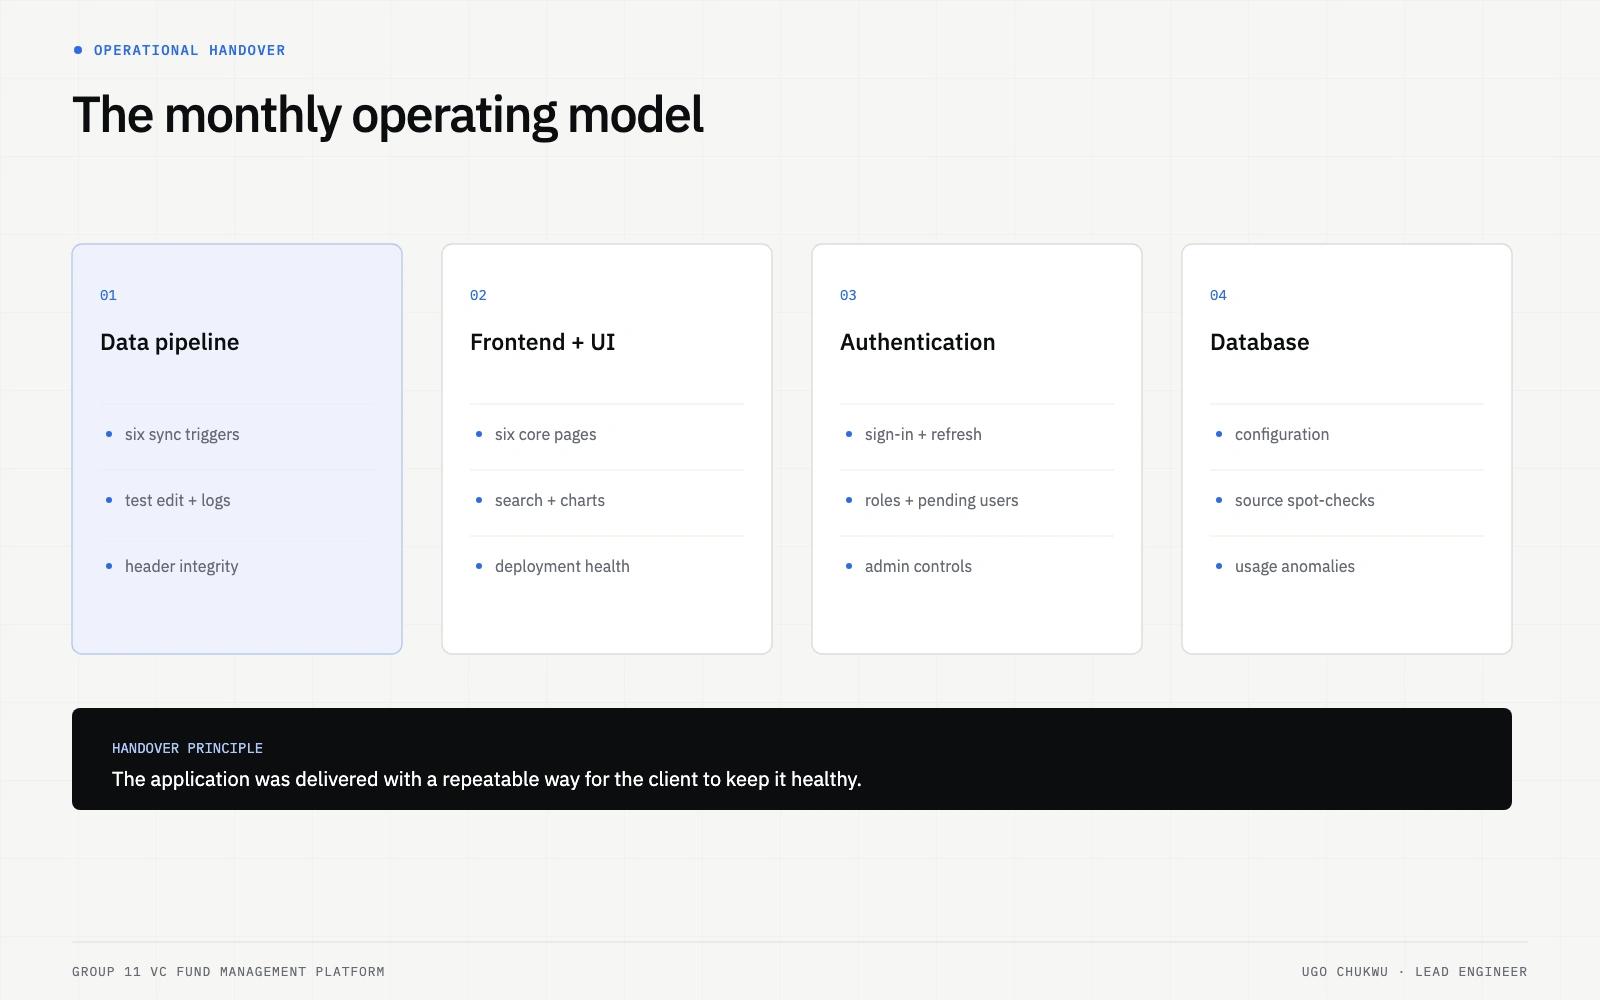
Operational handover covered the four systems the client needed to monitor to keep the platform healthy.
That operational layer matters because a successful enterprise delivery is not just "the application launched." It is "the client can understand how to keep it healthy."
Delivery lifecycle
The project followed the complete delivery path:
There has not yet been a formal commercial expansion phase. I therefore describe the engagement publicly as concept-to-production delivery, not concept-to-expansion.
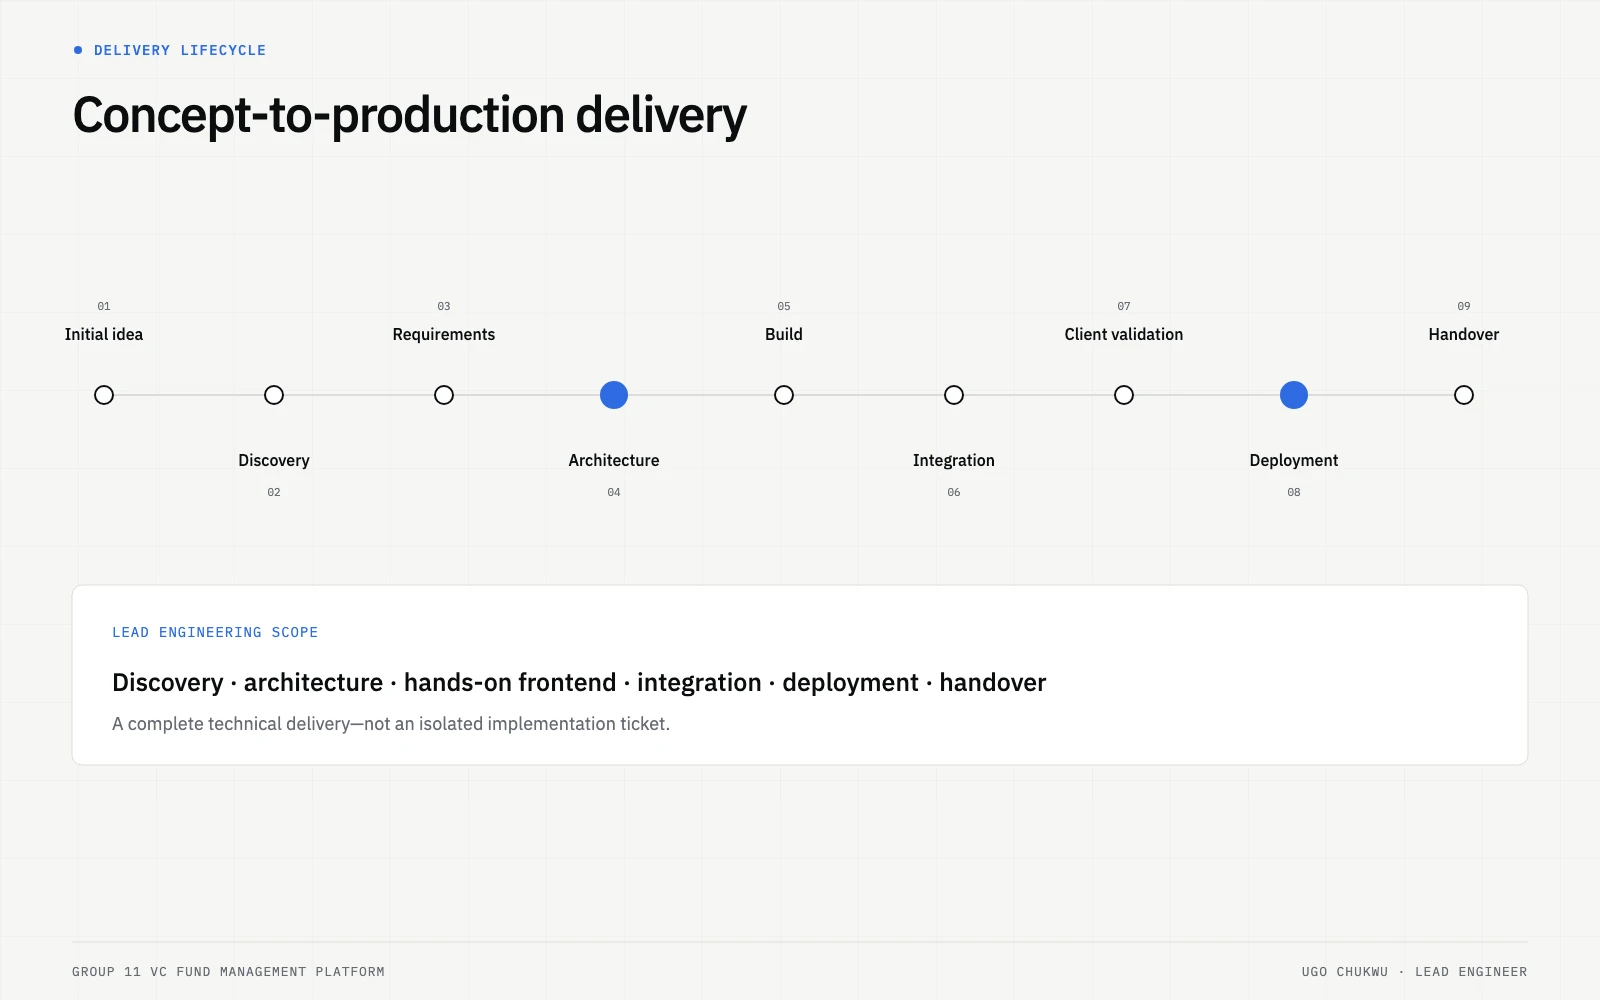
The engagement covered the complete delivery lifecycle: discovery, architecture, hands-on implementation, integration, deployment and handover.
What made the project high-stakes
The complexity was not primarily algorithmic. It came from the consequences of integration errors and the need to preserve client trust.
The application represented information used to understand:
fund performance;
capital deployment;
investment holdings;
valuations;
investor returns;
benchmark performance;
portfolio-company revenue; and
investment history.
In that environment, a visually impressive dashboard with stale or incorrectly mapped data is worse than no dashboard at all.
The engineering standard therefore had to prioritize:
source traceability;
predictable data contracts;
safe synchronization;
failure visibility;
access control;
maintainability; and
honest documentation of system boundaries.
The result
The delivered system converted a spreadsheet-centered operating process into a production web platform without forcing the client to abandon the tools already embedded in its workflow.
The system provided:
automated source-to-dashboard synchronization;
a structured PostgreSQL application layer;
authenticated fund and portfolio intelligence;
connected fund, company, investment, benchmark, and revenue views;
explicit integration resilience around changing spreadsheets;
production deployment; and
client-facing technical, operational, and maintenance documentation.
The strongest result is not a marketing percentage. It is that an ambiguous operating problem was taken from idea → architecture → coordinated build → deployed system → maintainable handover.
Leadership and engineering judgment demonstrated
1. Preserve useful client behavior instead of redesigning for engineering convenience
A greenfield database-first workflow would have been cleaner technically, but it would have imposed a larger process change on the client. The architecture respected the client's existing operating model and created a safer transition path.
2. Separate source, application state, and presentation
The spreadsheets remained the editing system; PostgreSQL became structured application state; the frontend became the decision interface. Each layer had a clear responsibility.
3. Treat messy input systems as explicit engineering constraints
The project did not assume spreadsheets behaved like databases. It designed dynamic mapping where possible and documented brittle dependencies where it was not.
4. Build around contracts between frontend and backend workstreams
Because the project was delivered by a small engineering team, clear API and data boundaries were essential. I led the architecture and frontend while the backend engineer implemented the integration and data layer against those shared contracts.
5. Design handover as part of the product
The breaking-change guide, maintenance checklist, deployment guides, source maps, and troubleshooting paths were part of the engineering deliverable—not afterthoughts.
What this case study proves
This engagement demonstrates my ability to operate beyond the boundary of an individual implementation ticket.
I can:
enter an ambiguous operational environment and structure the problem;
translate business workflows into product requirements;
make architecture decisions that account for client adoption and operating constraints;
lead a small technical workstream across frontend/backend boundaries;
remain hands-on in production application development;
design for financial-data integrity and failure modes;
deploy the system and own the integration path; and
leave the client with an understandable operating model after delivery.
That combination—discovery, architecture, technical leadership, hands-on engineering, and production delivery—is the core of the work I want to continue doing for high-value clients and technical teams.
I didn't replace the client's operating workflow. I engineered a reliable product around it.
That is the central story of this engagement.
Public evidence and disclosure boundary
This case study intentionally avoids publishing client credentials, source spreadsheets, private portfolio-company records, internal database values, private URLs, or non-public fund metrics.
Public Group 11 context may be referenced from the firm's public website and company profile. Internal platform details are described only at the architectural and product-capability level necessary to explain the engineering work.
Like this project
Posted Aug 20, 2026
A secure, continuously synced fund-management app for performance, portfolio intelligence, investments, revenue, and investor reporting.
Likes
0
Views
14
Timeline
Oct 5, 2025 - Dec 30, 2025
Clients
Group 11