Monitoring with Prometheus and Grafana.
Role
Project goal In this project, we used Terraform to construct EC2 instances dedicated to the task of monitoring our AWS EC2 instances, all while using Prometheus for data collection and Grafana to visualize it.TaskSetup monitoring for two EC2 instances one hosting our containerized application managed by Docker, while the other serves as an Nginx server
Solution In this project, we'll harness the power of Terraform to build dedicated EC2 instances, designed for the essential task of monitoring our AWS EC2 instances. Our toolkit includes Prometheus for seamless data collection and Grafana for compelling data visualization.
Within this setup, one of our instances will be home to a containerized application, efficiently managed by Docker. Meanwhile, the other instance will don the hat of an Nginx server.
**Agenda:**
- Build your EC2 instances and security groups with Terraform
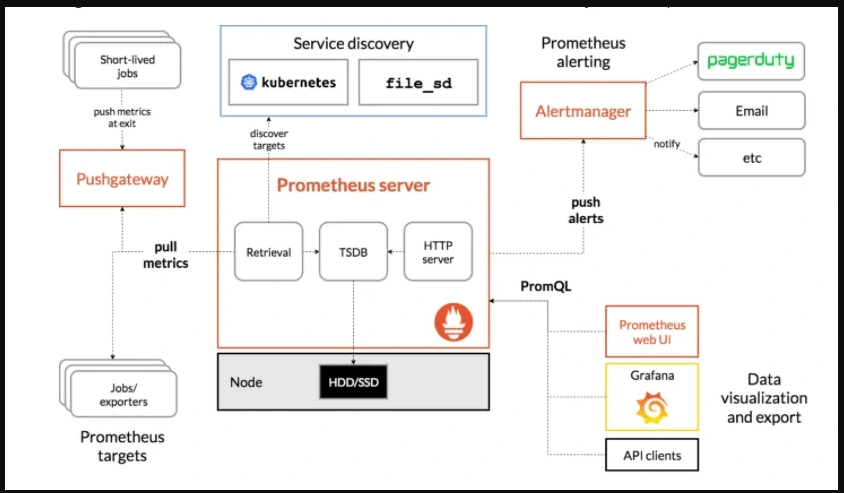
- Delve into Prometheus Architecture
- Install Prometheus and configure it to self-monitor
- Set up Node Exporter on additional EC2 Instances
- Fine-tune Prometheus for EC2 monitoring
- Implement EC2 Service Discovery for Prometheus
- The installation process for Grafana
**Prerequisite:**
- An AWS account
- IAM credentials with programmatic access
- AWS CLI configured with your local environment
- A pre-configured VPC for EC2
- A code or text editor
**Resource Allocation:**
- Prometheus EC2 instance: t2.micro
- Grafana EC2 instance: t2.micro
- Node EC2 instances for application monitoring
- Properly configured Security Groups
**Port Configurations:**
- Port 9090: Prometheus Server
- Port 9100: Prometheus Node Exporter
- Port 9323: Docker
- Port 9113: Nginx Prometheus Exporter
- Port 3000: Grafana
Let's embark on this journey of streamlined monitoring and visualization! 💡🚀 #Terraform #AWS #Prometheus #Grafana
Like this project
Posted Nov 24, 2023
Project goal In this project, we used Terraform to construct EC2 instances dedicated to the task of monitoring our AWS EC2 instances, all while using Prometheus

