
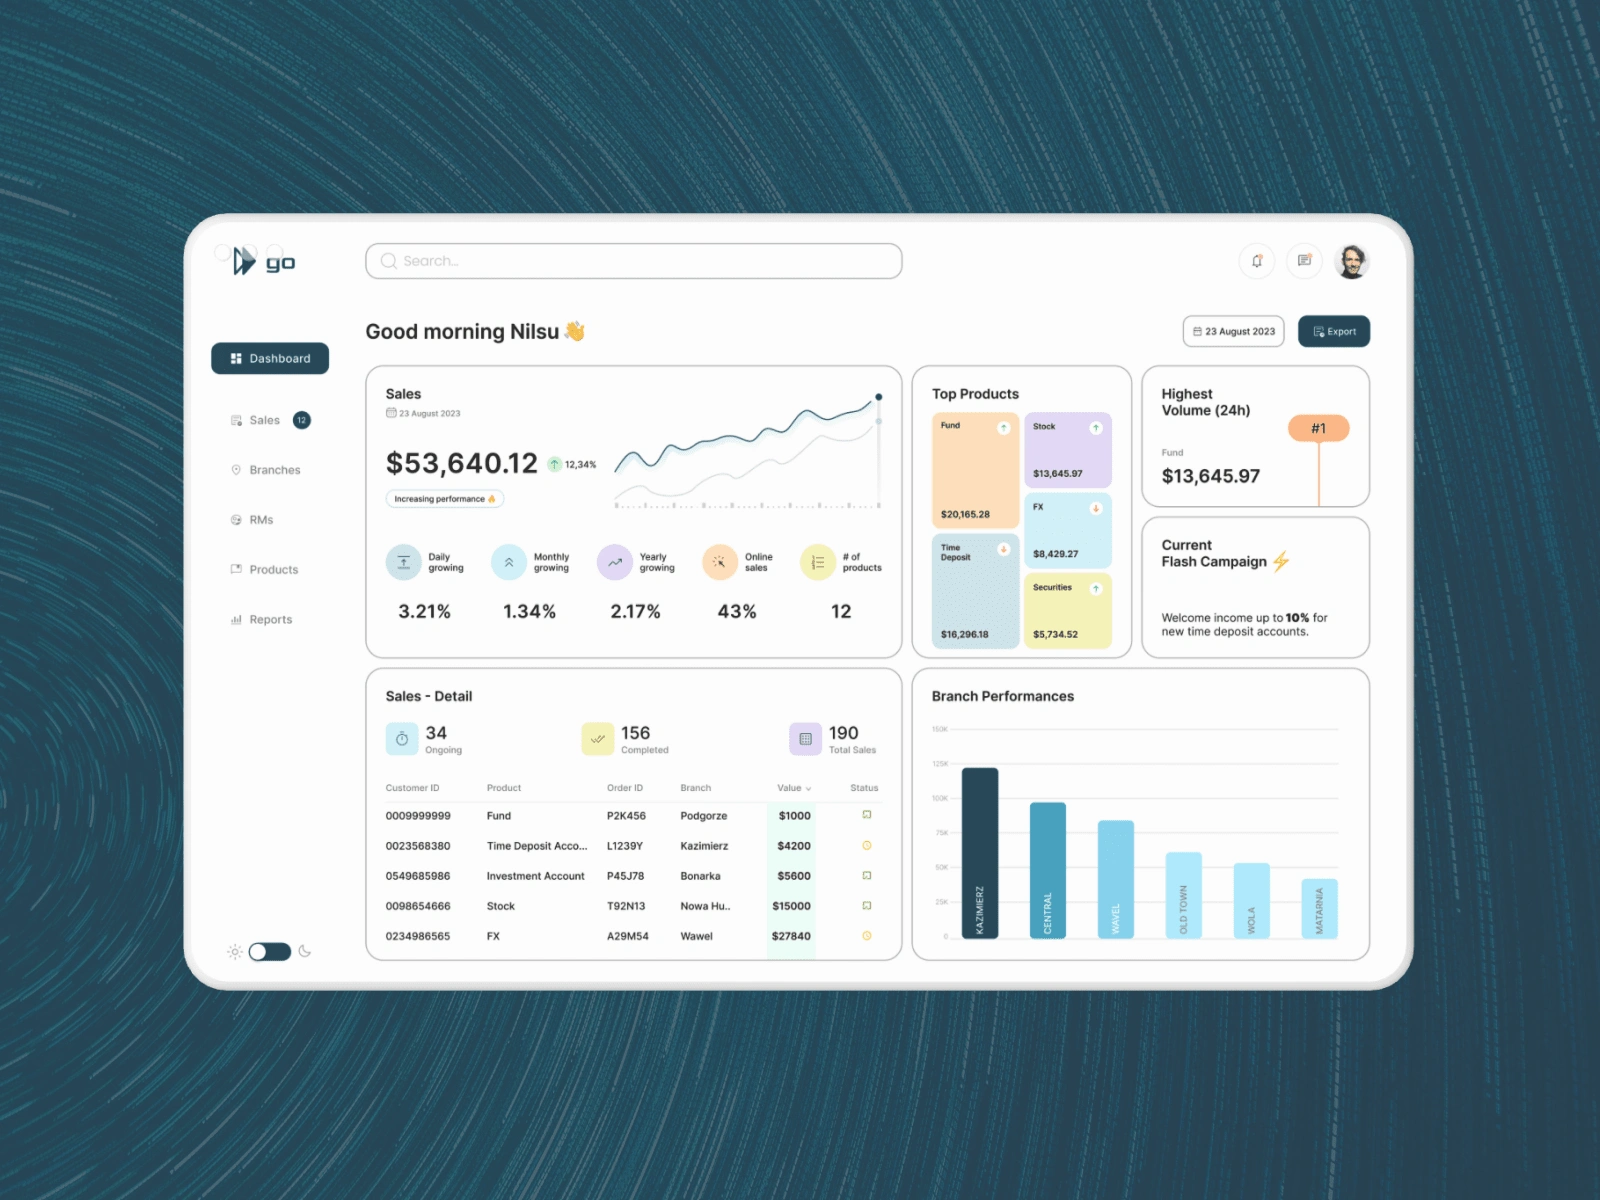
Overview 📌
As a UI/UX Designer, I had the opportunity to work on a challenging and vision-extended banking performance dashboard project with a fintech startup.
Project Goals 🎯
Creating a user-friendly, functional, and real-time dashboard that allows users to generate reports and track performance KPIs was our business goal.
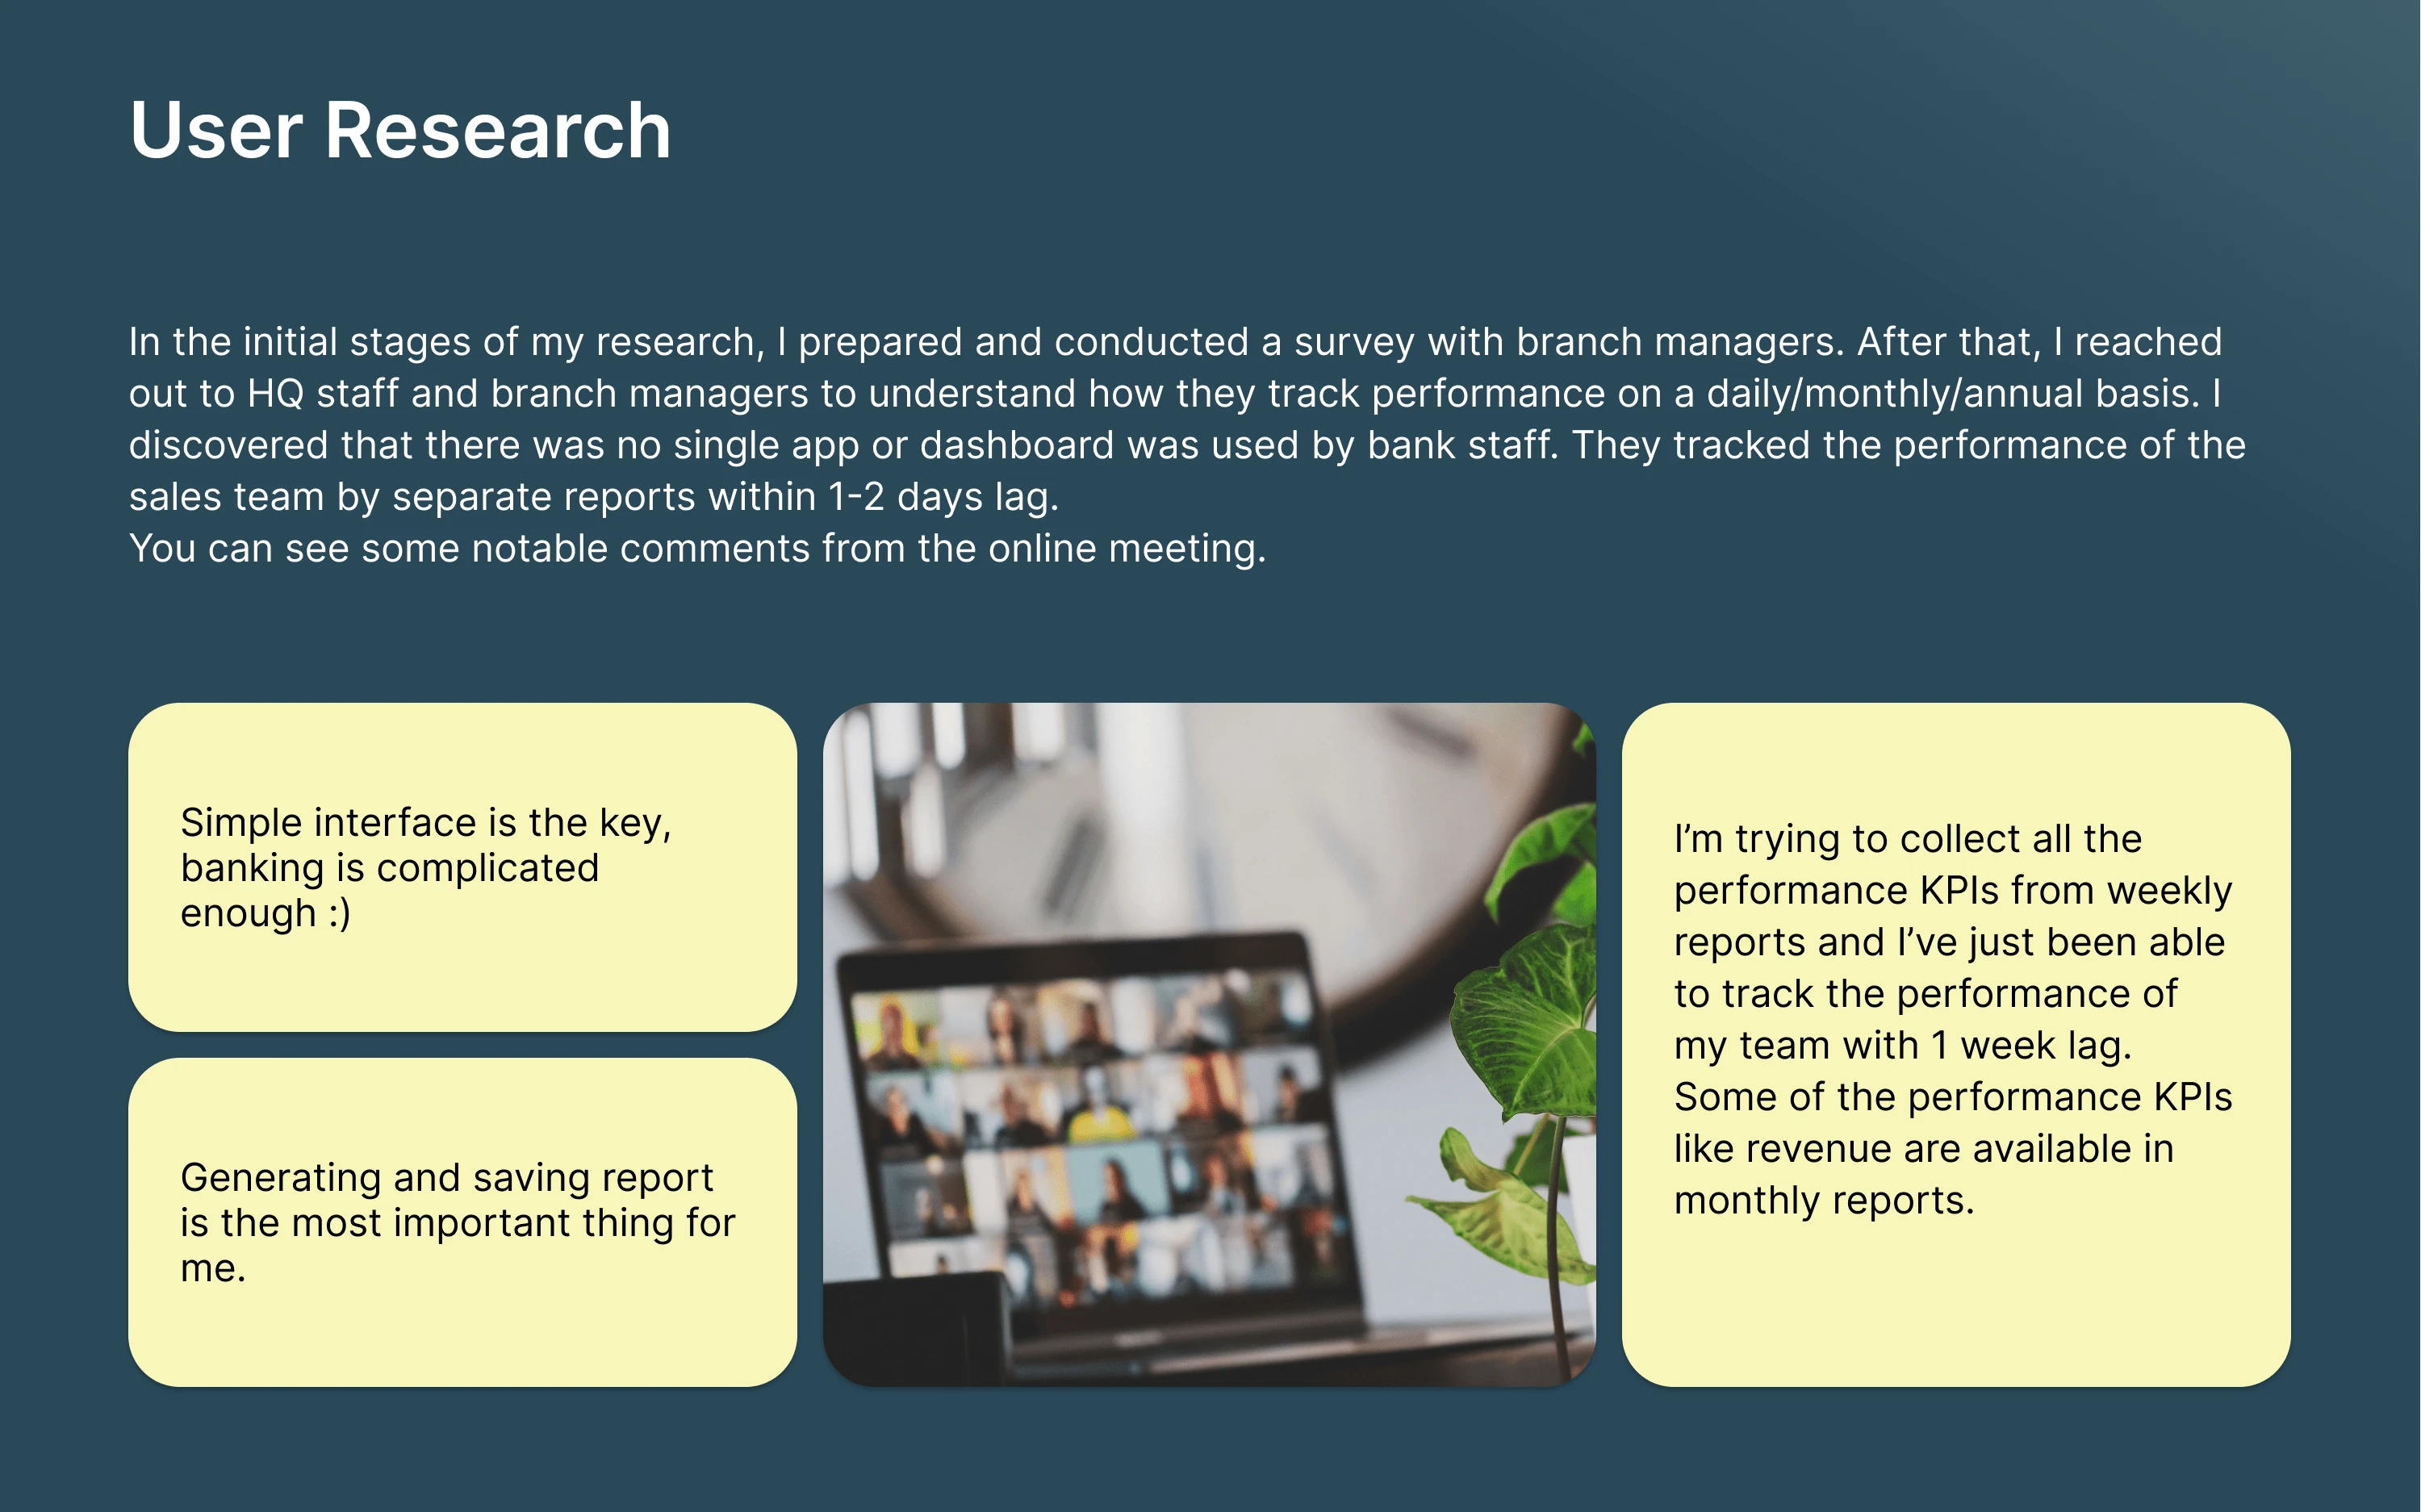
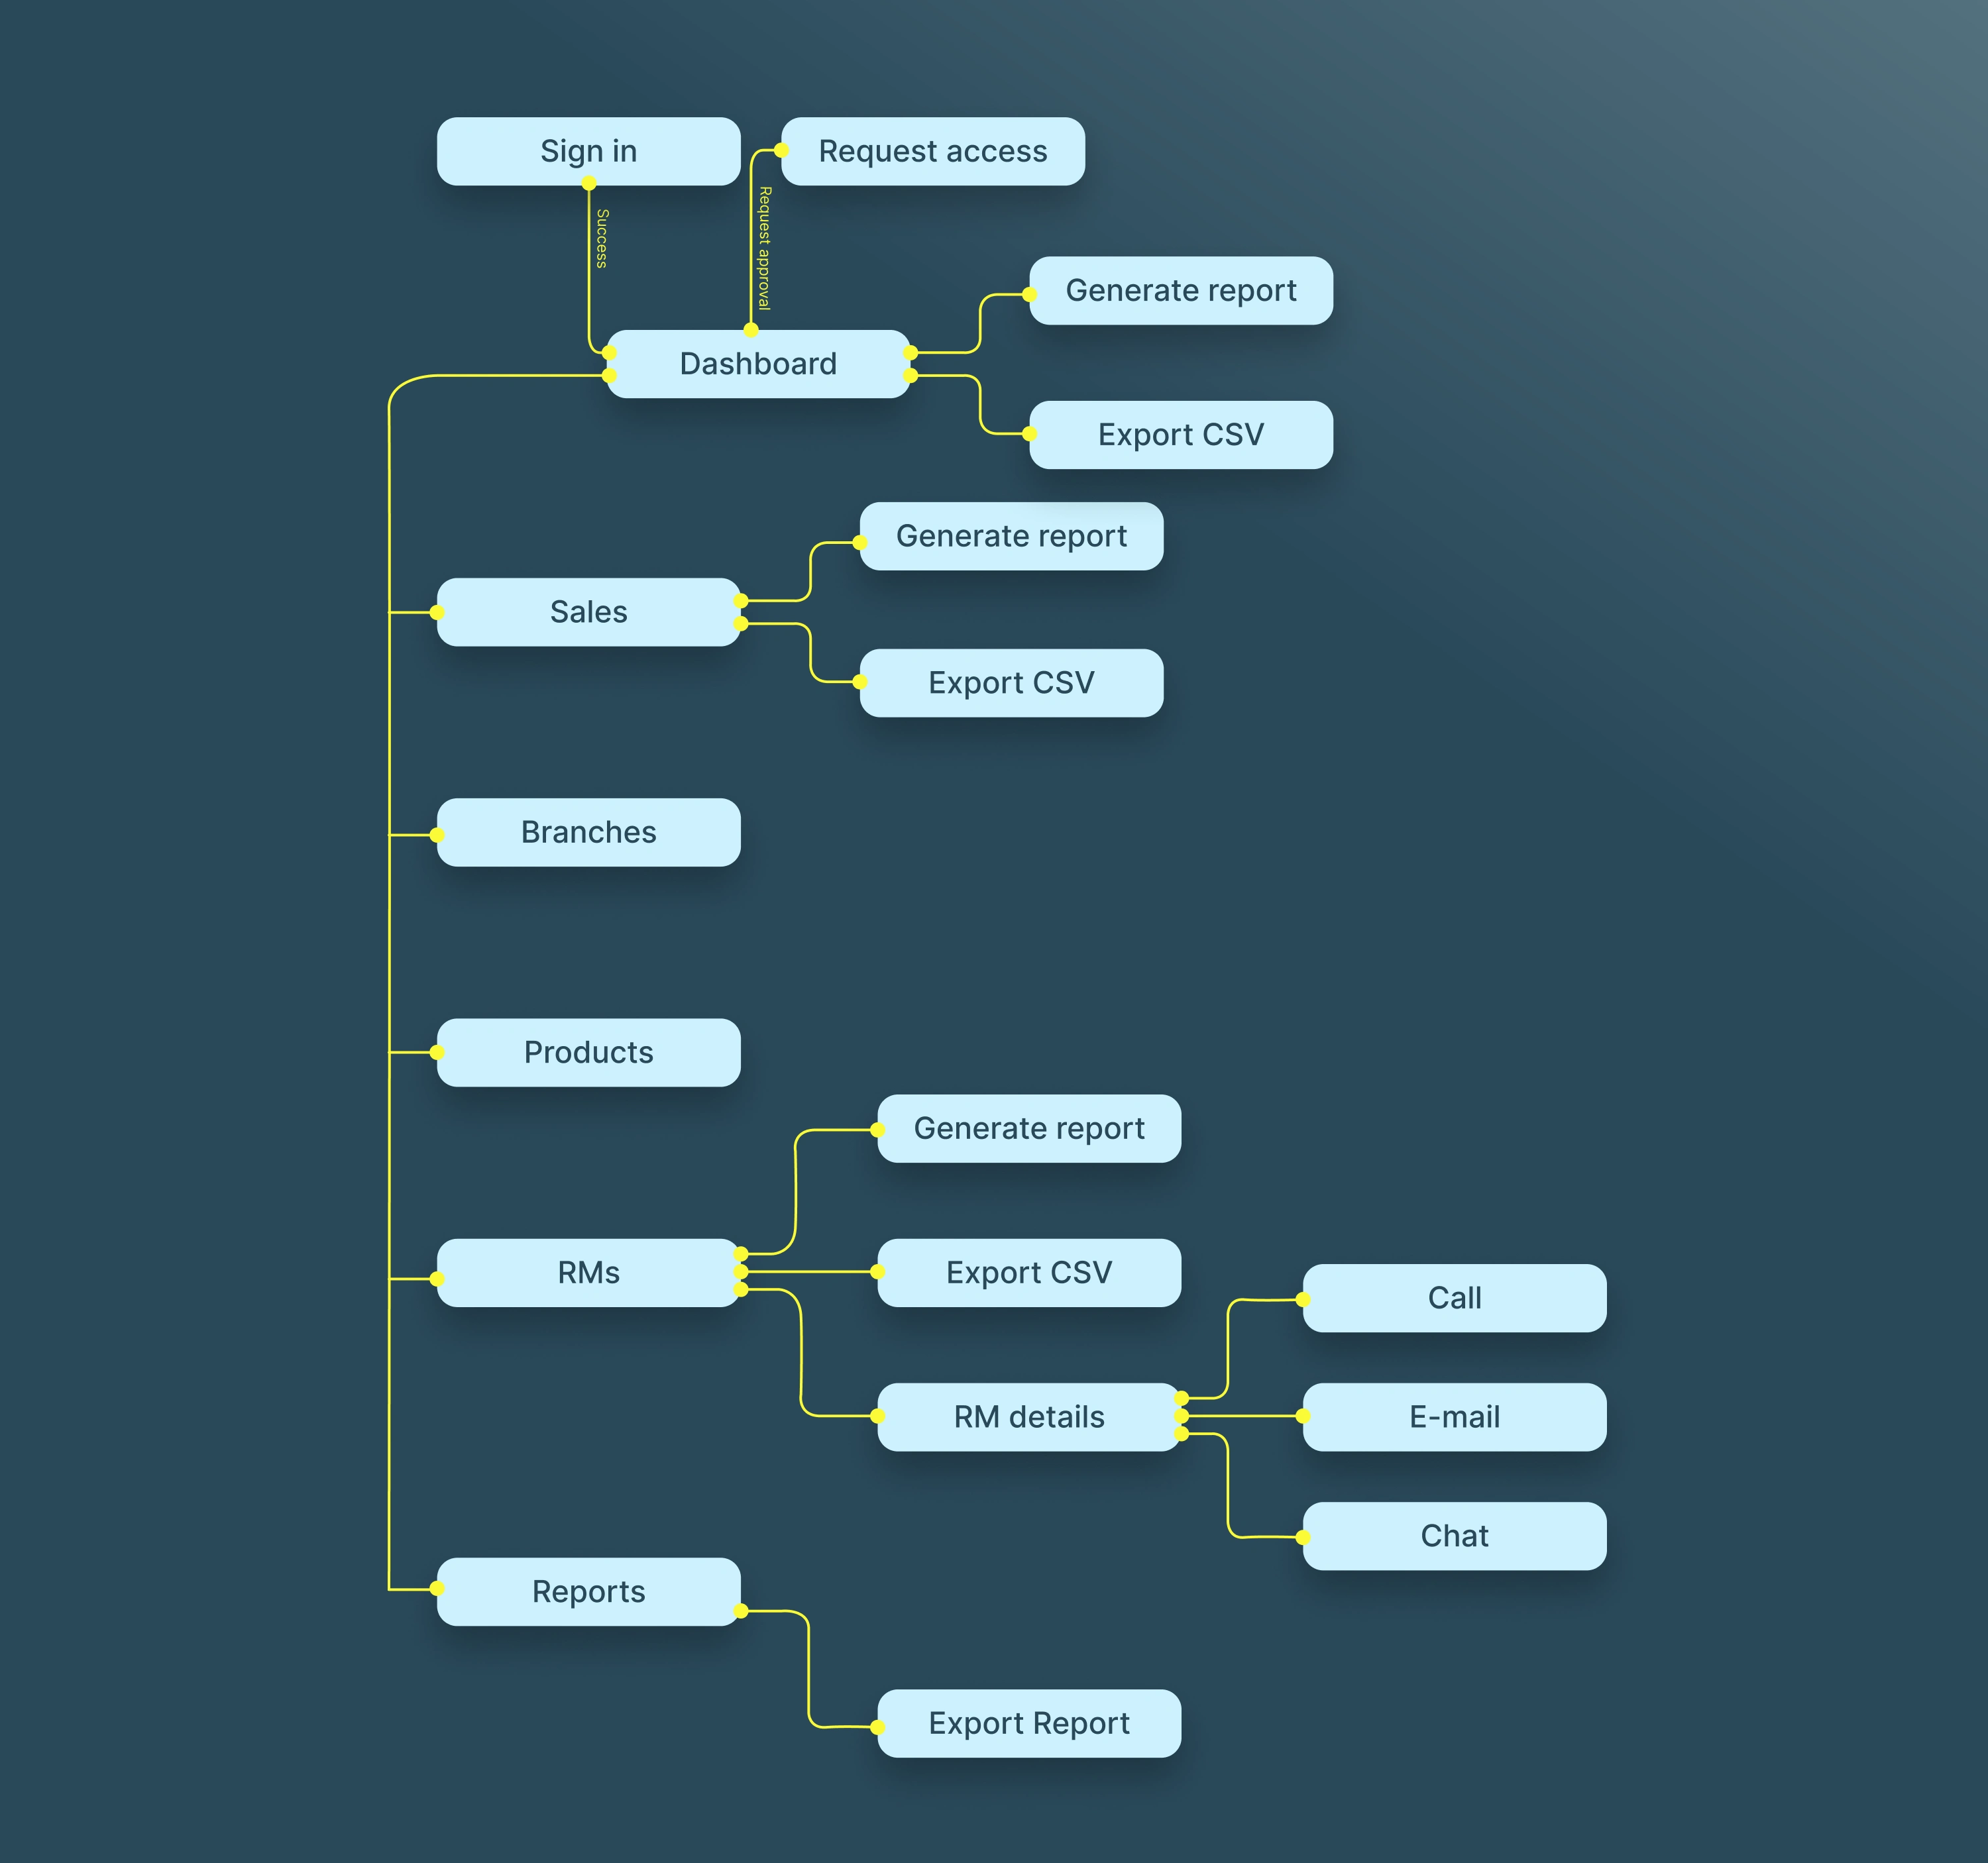
Flow diagram 🔗
To outline all the necessary functionality I created a simple flow diagram of the main tasks the user can do. One of the flows is shown below. Fail state flows were also created, but are not shown due to space constraints.
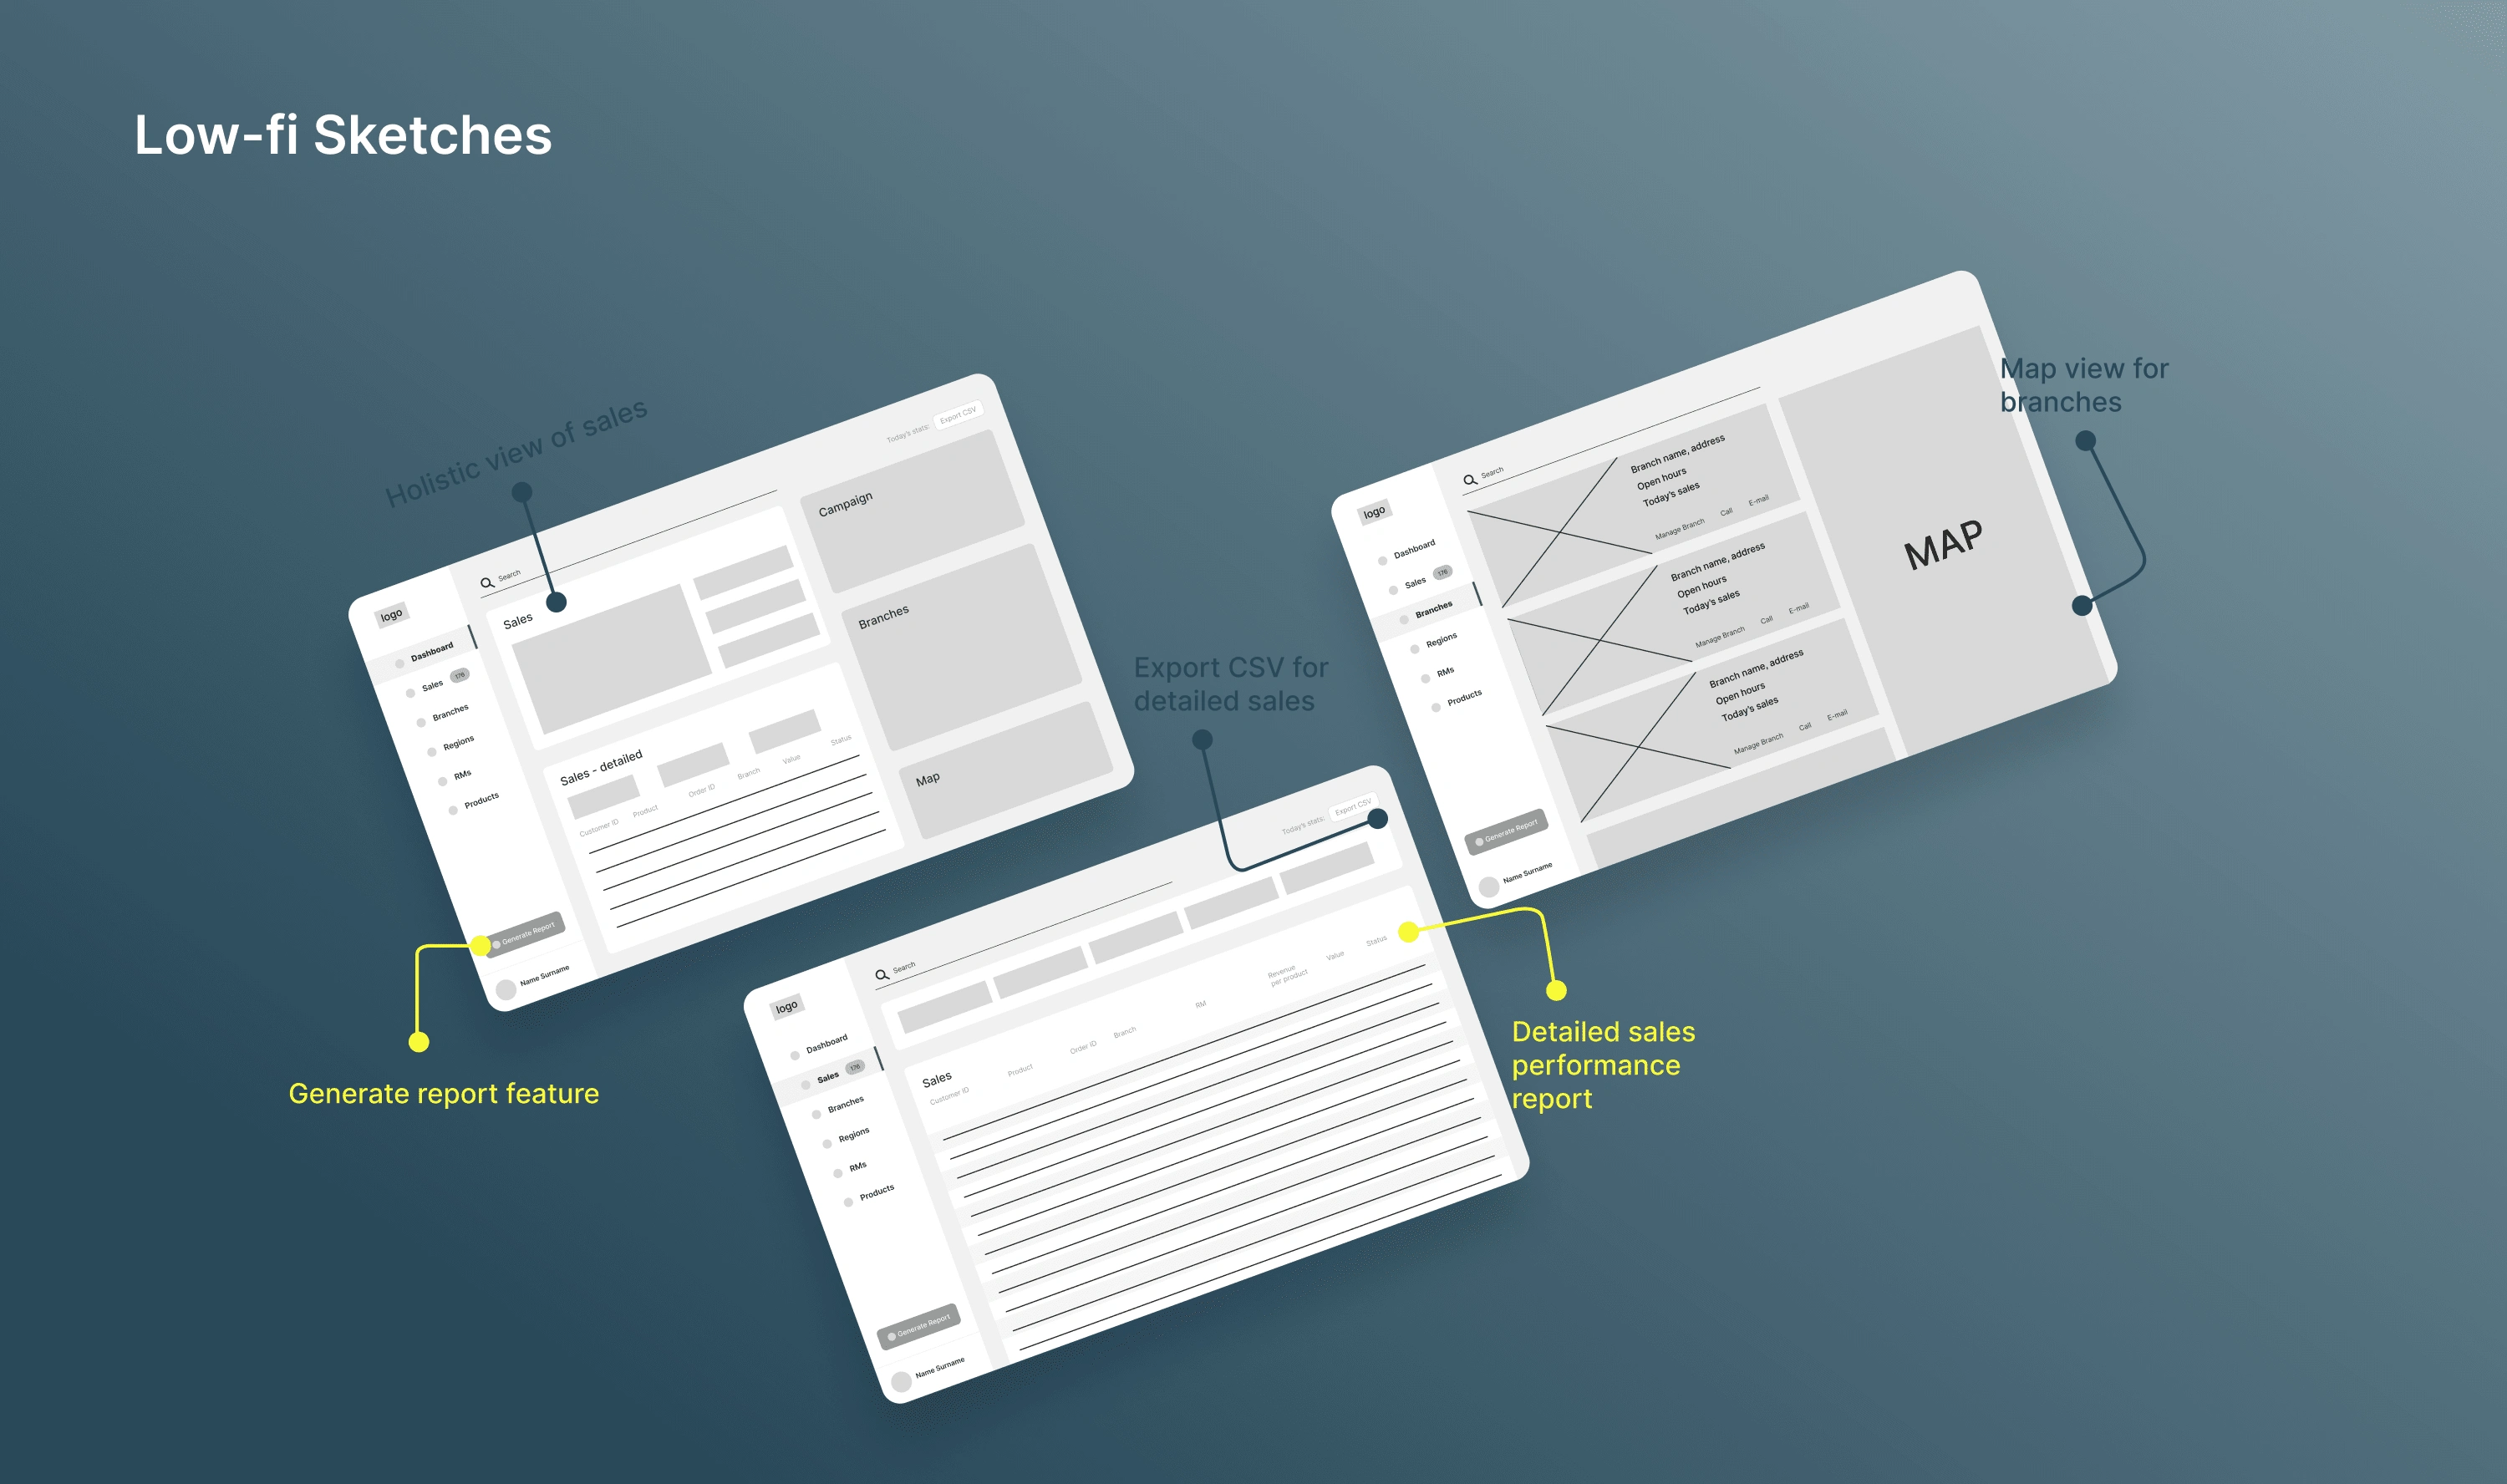
Low-fidelity wireframes 🗒️
Once the flow diagram was established, I started creating the low-fidelity wireframes of the main flow.
High-fidelity UI Design 🚀
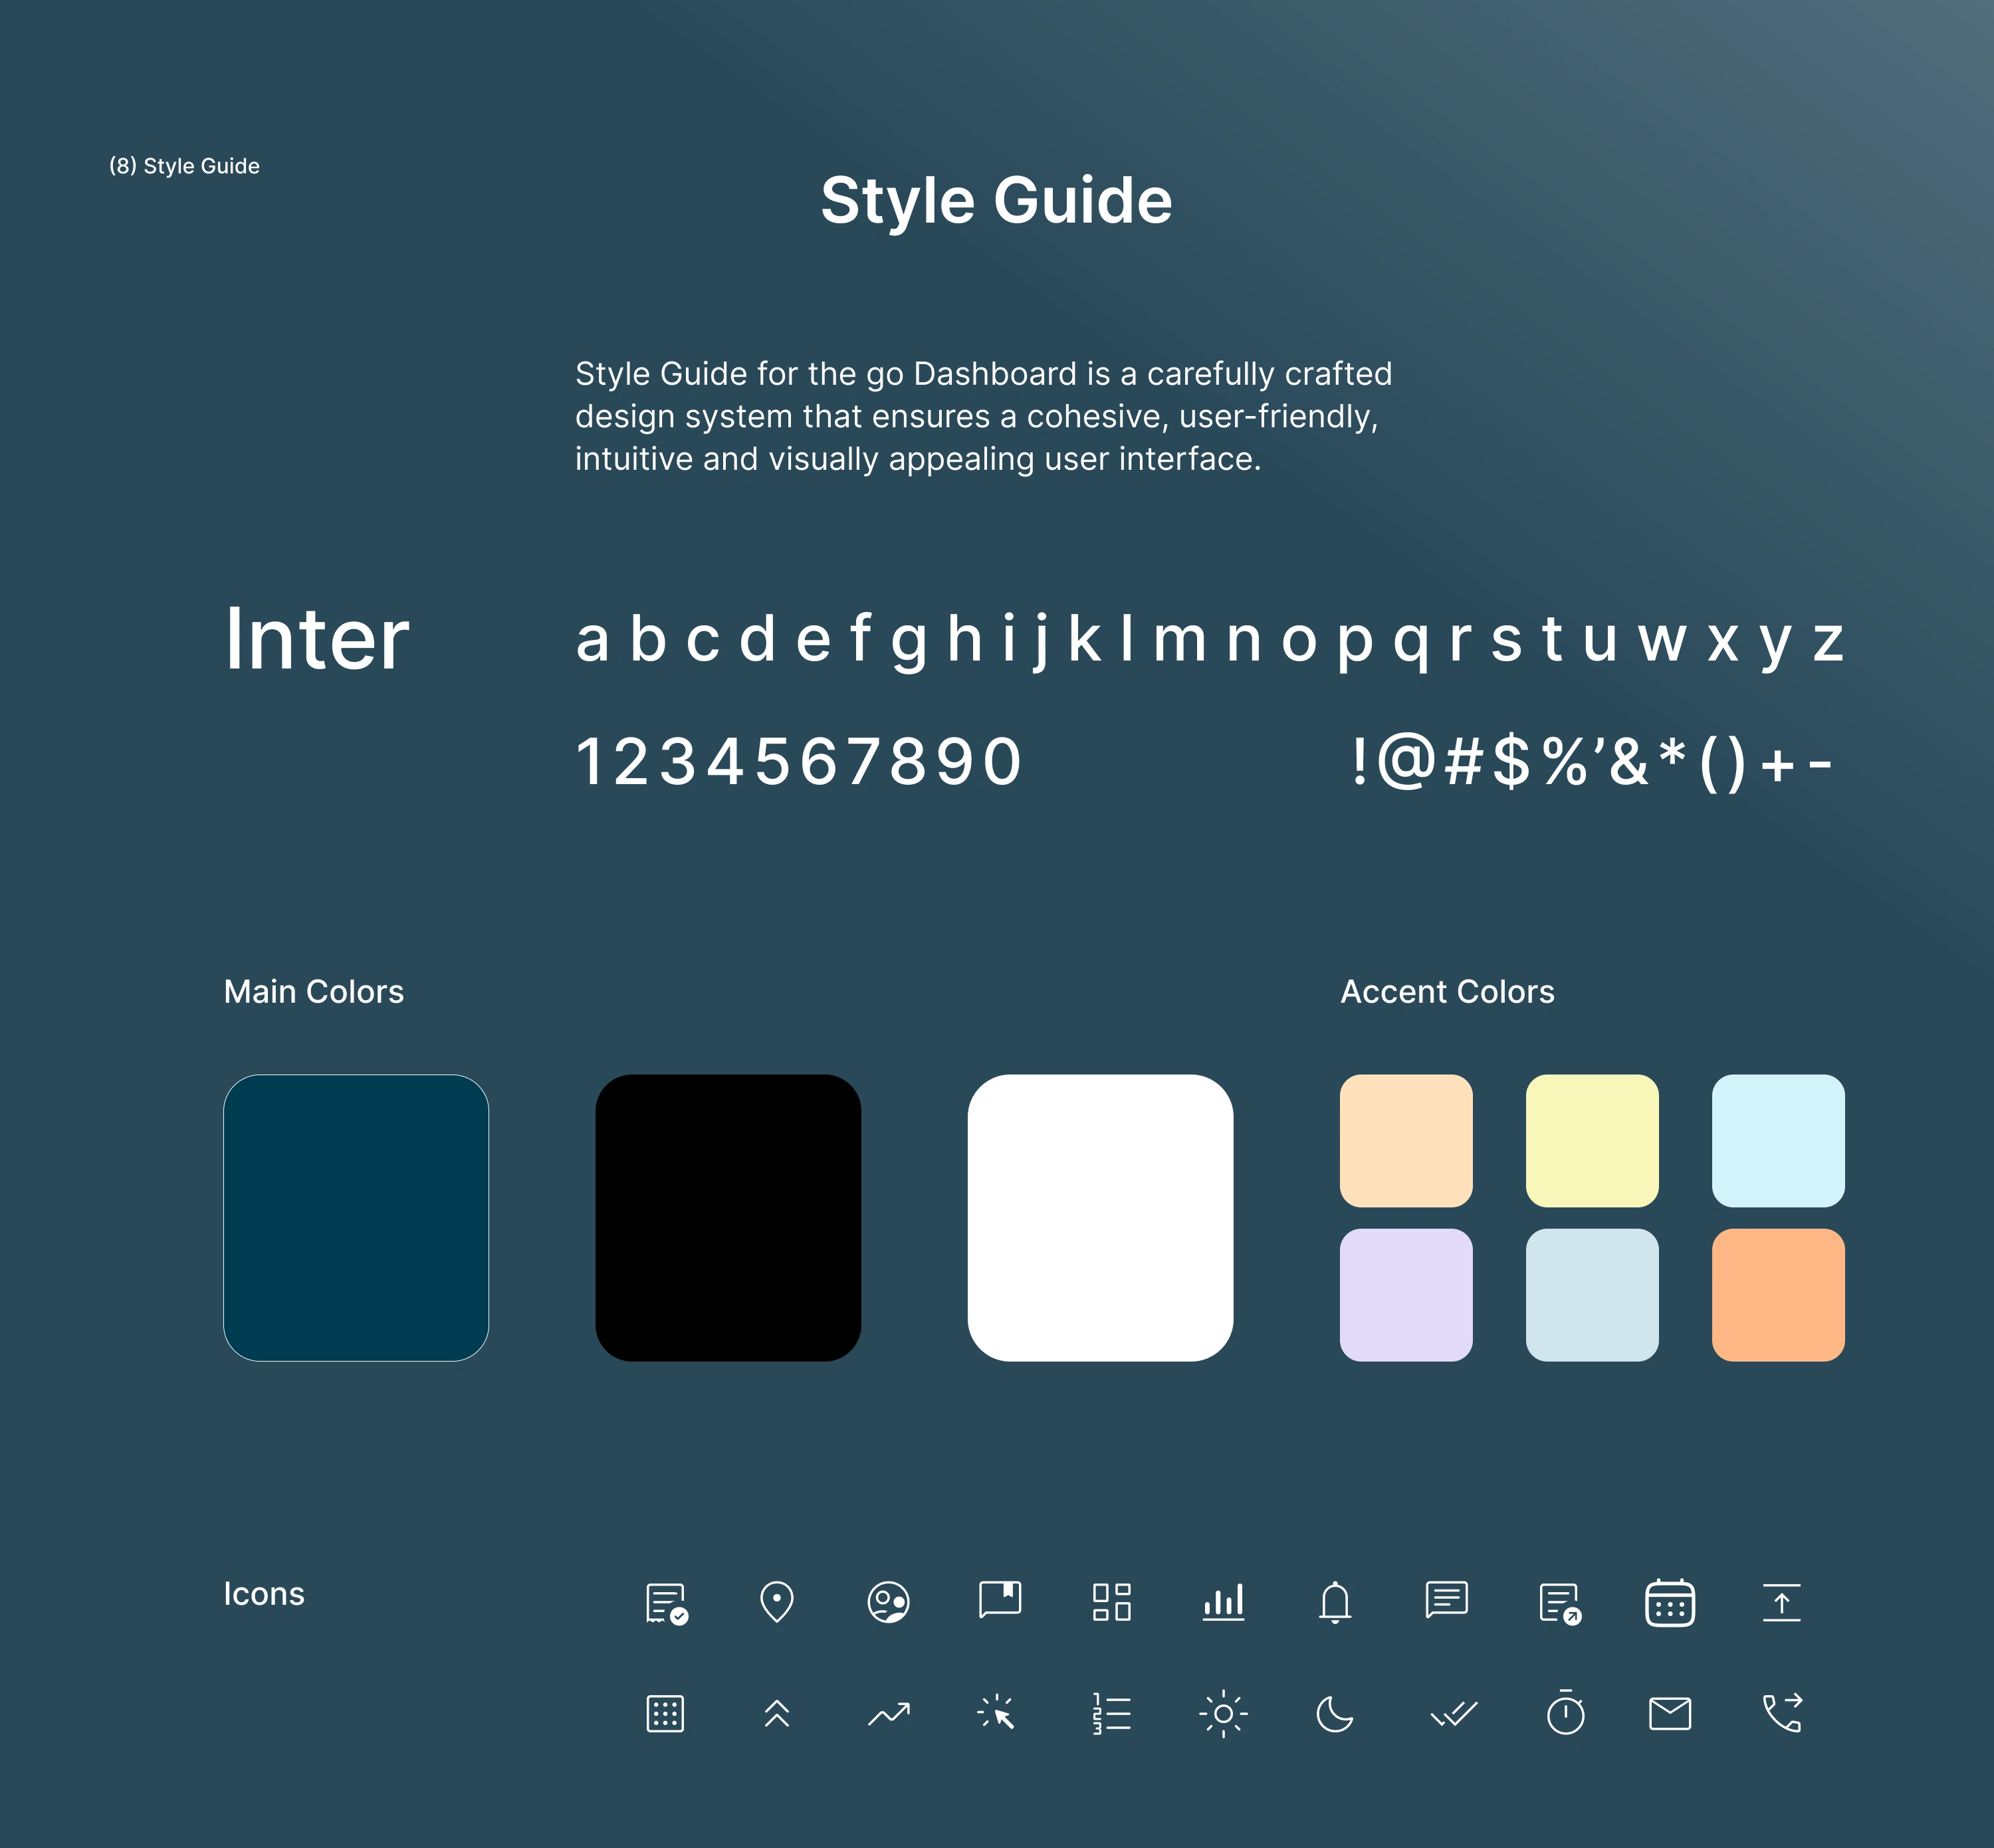
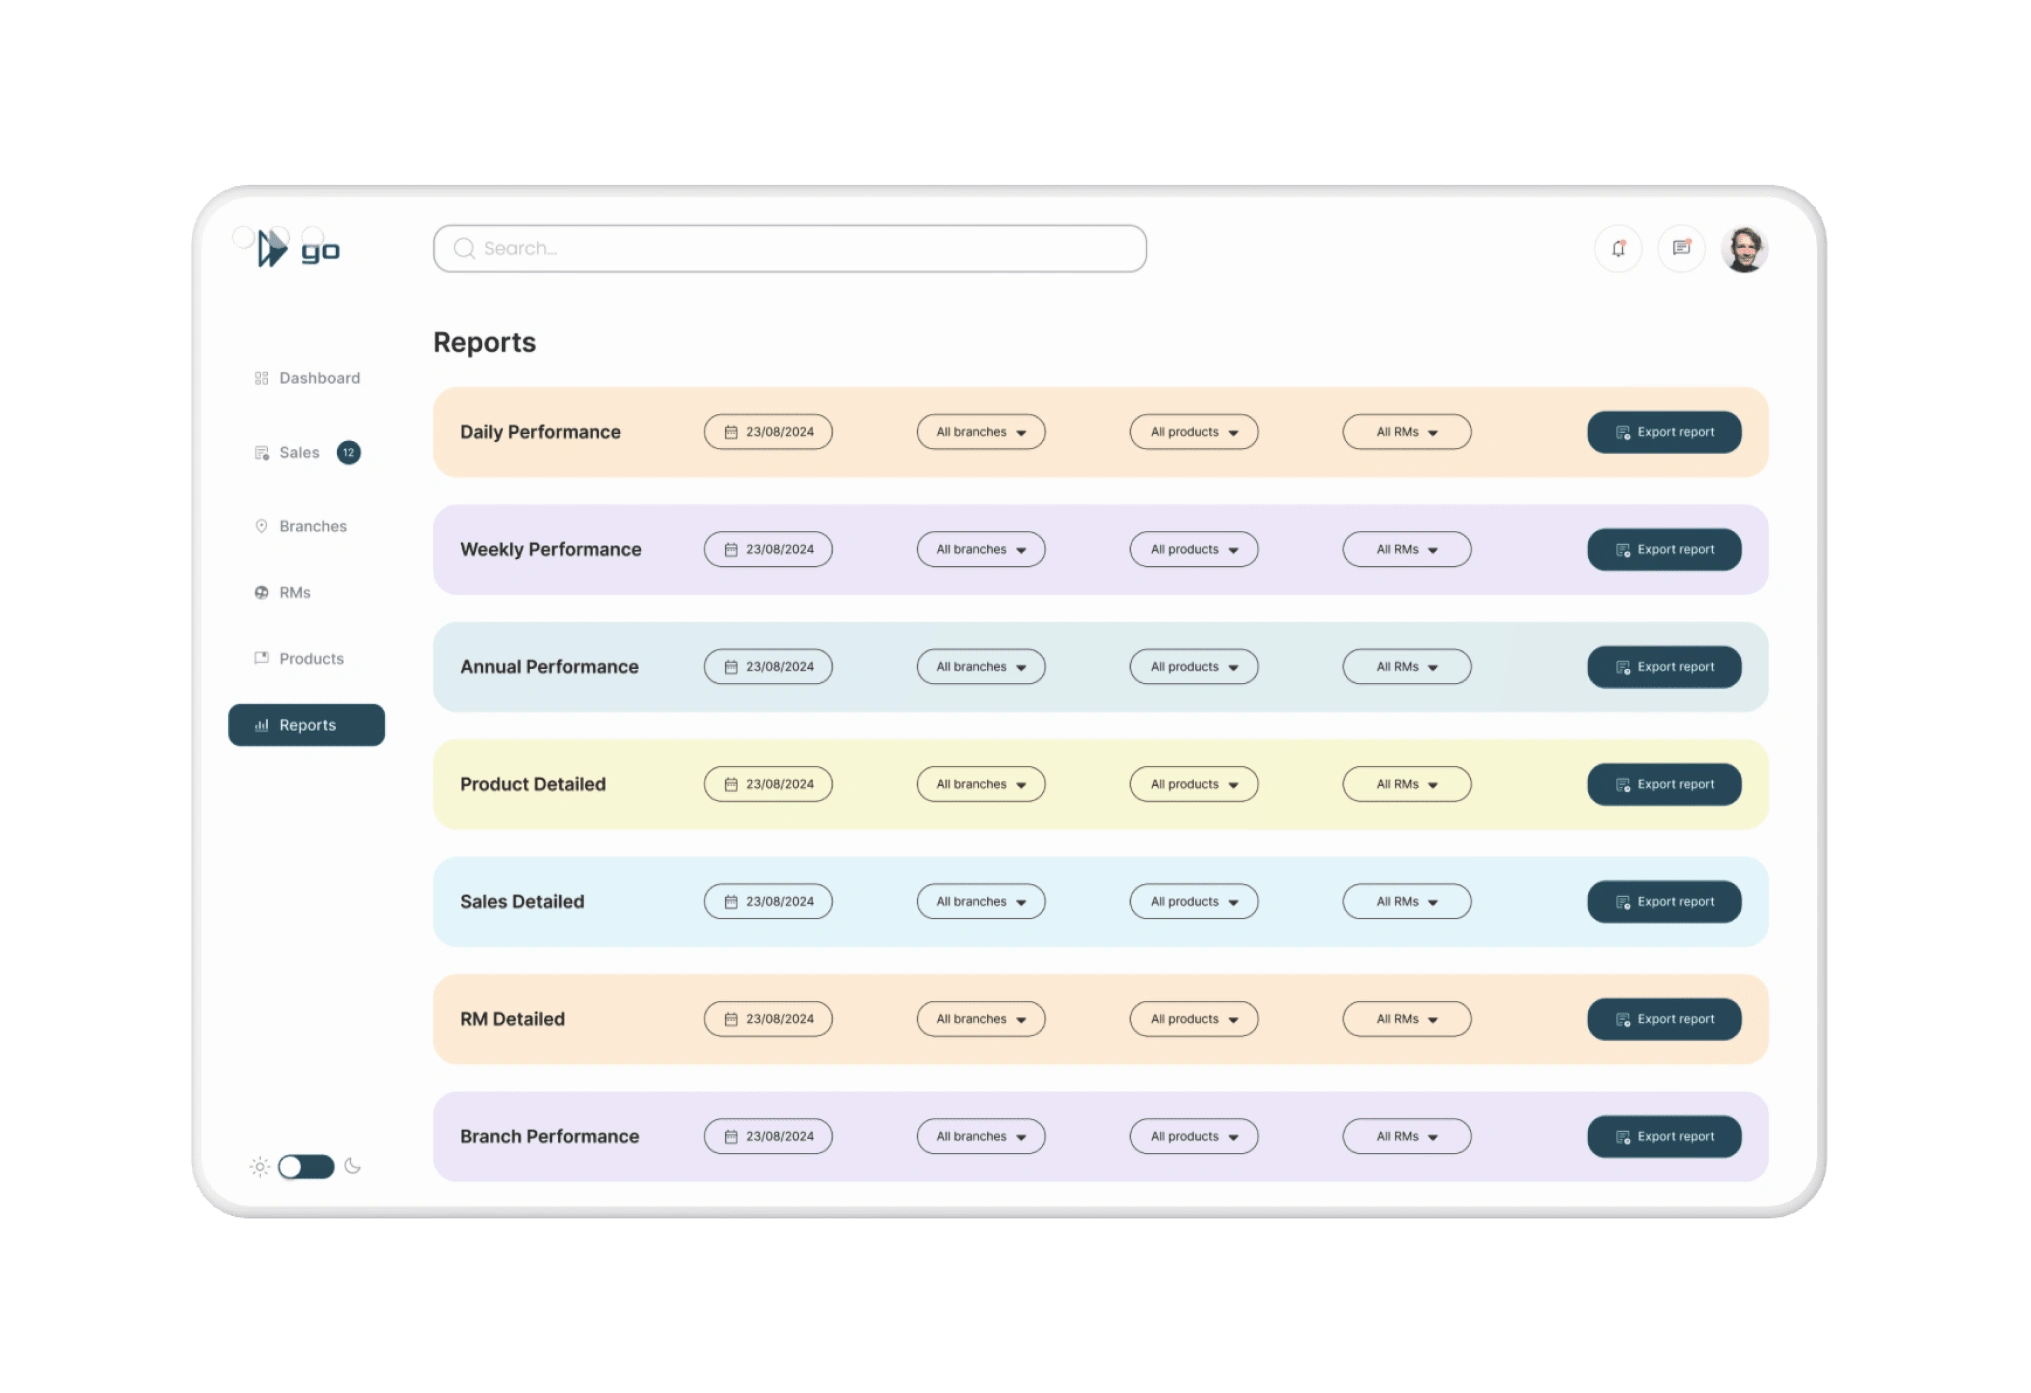
The platform needed to be intuitive, user-friendly, and efficient, while also incorporating a lot of functionality within a small number of screens. My main goal was to ensure that the platform would provide an exceptional user experience while making it easy for the bank’s staff and providing a solution for tracking the sales team's performance.
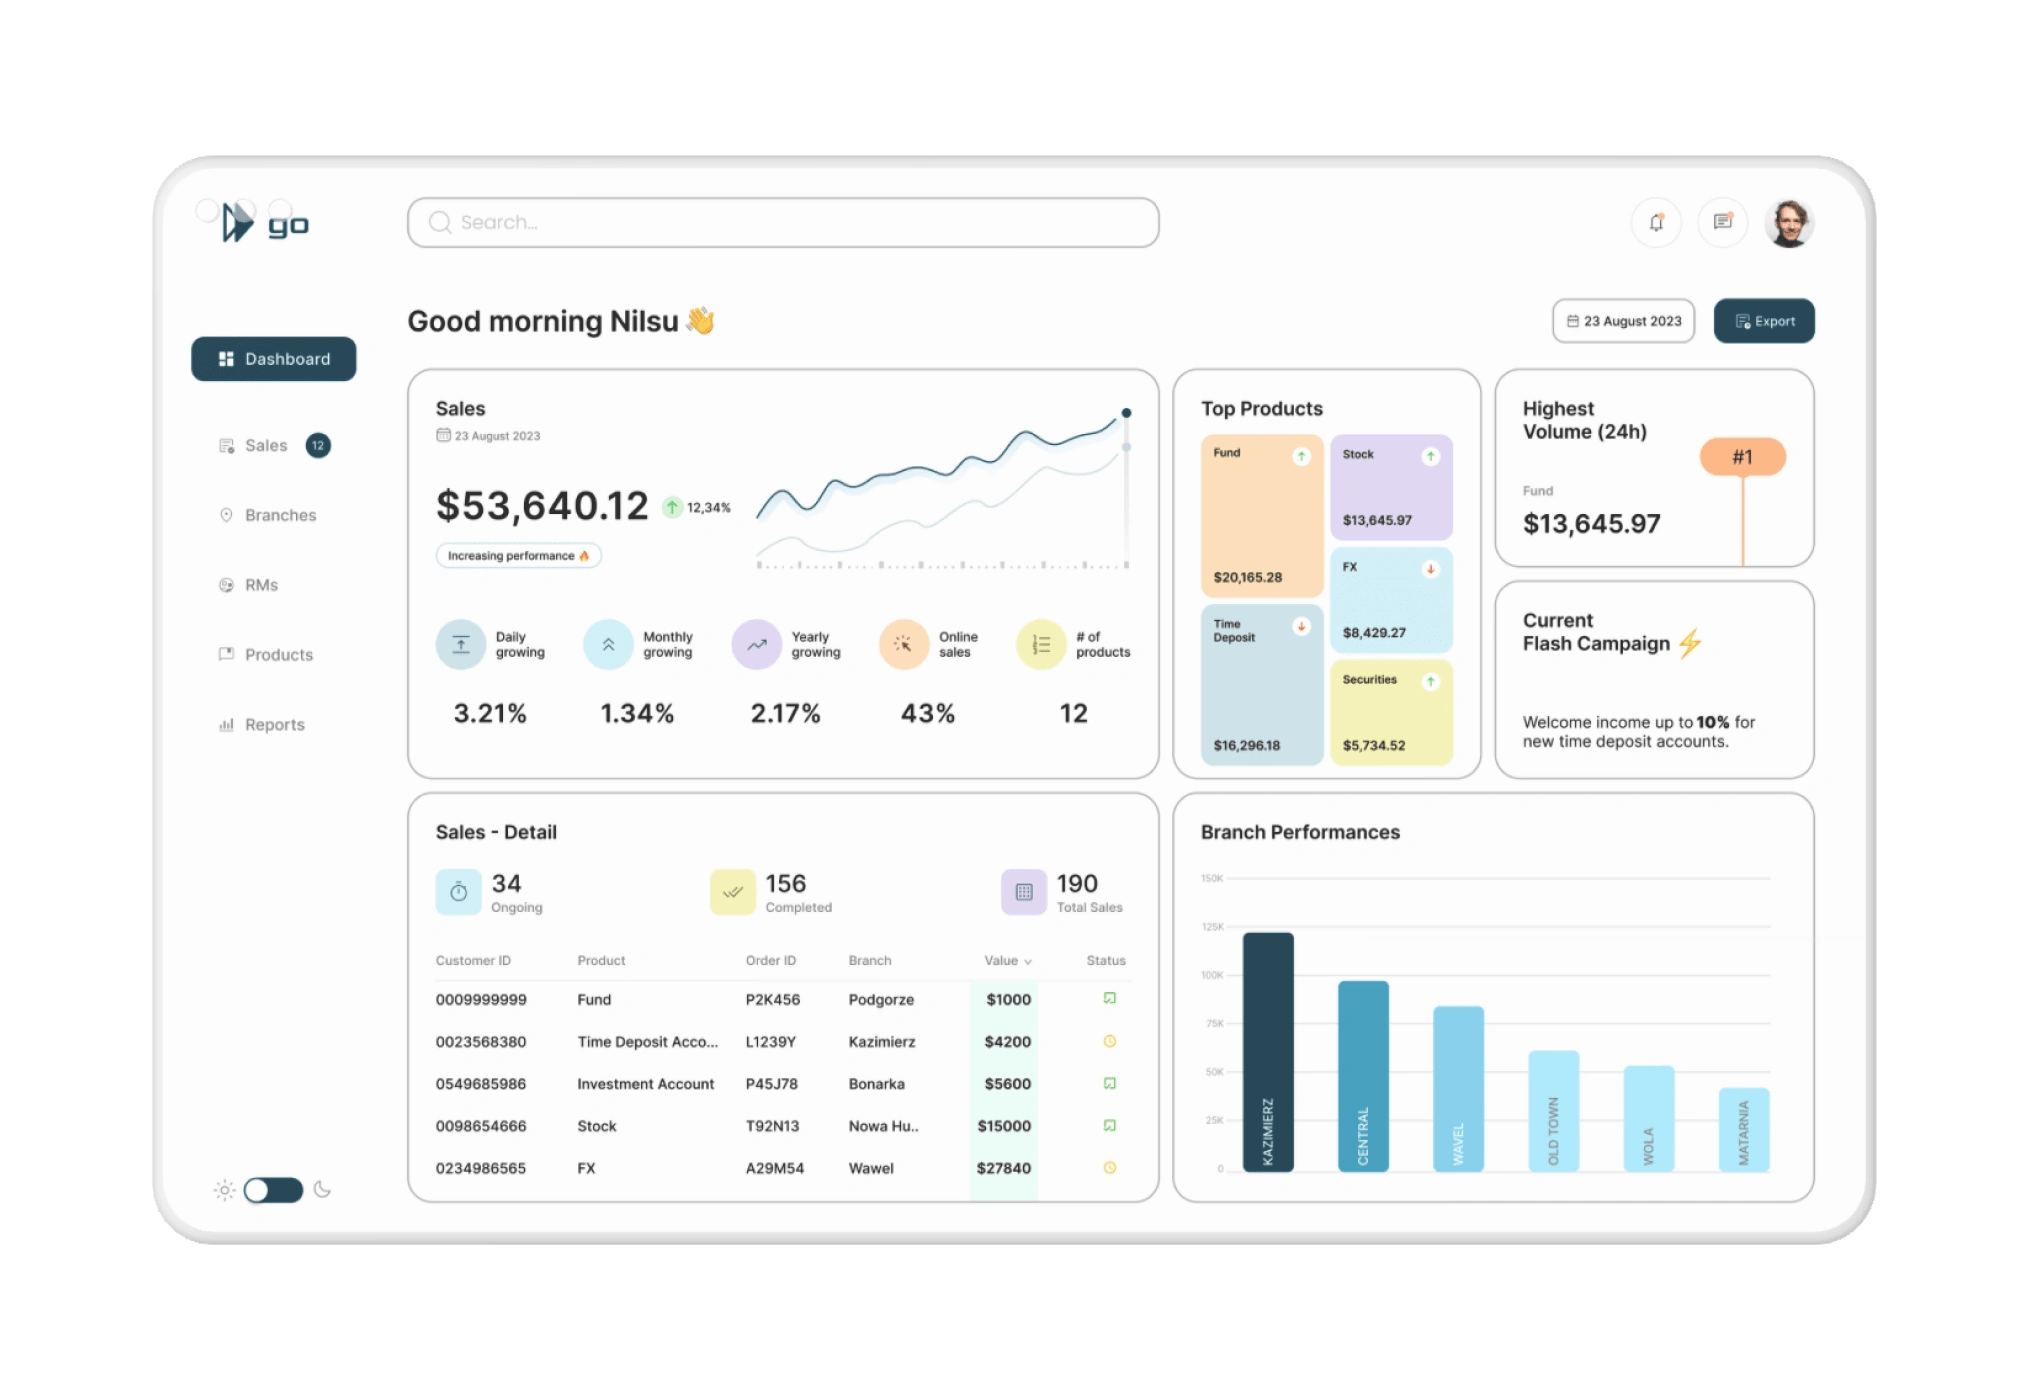
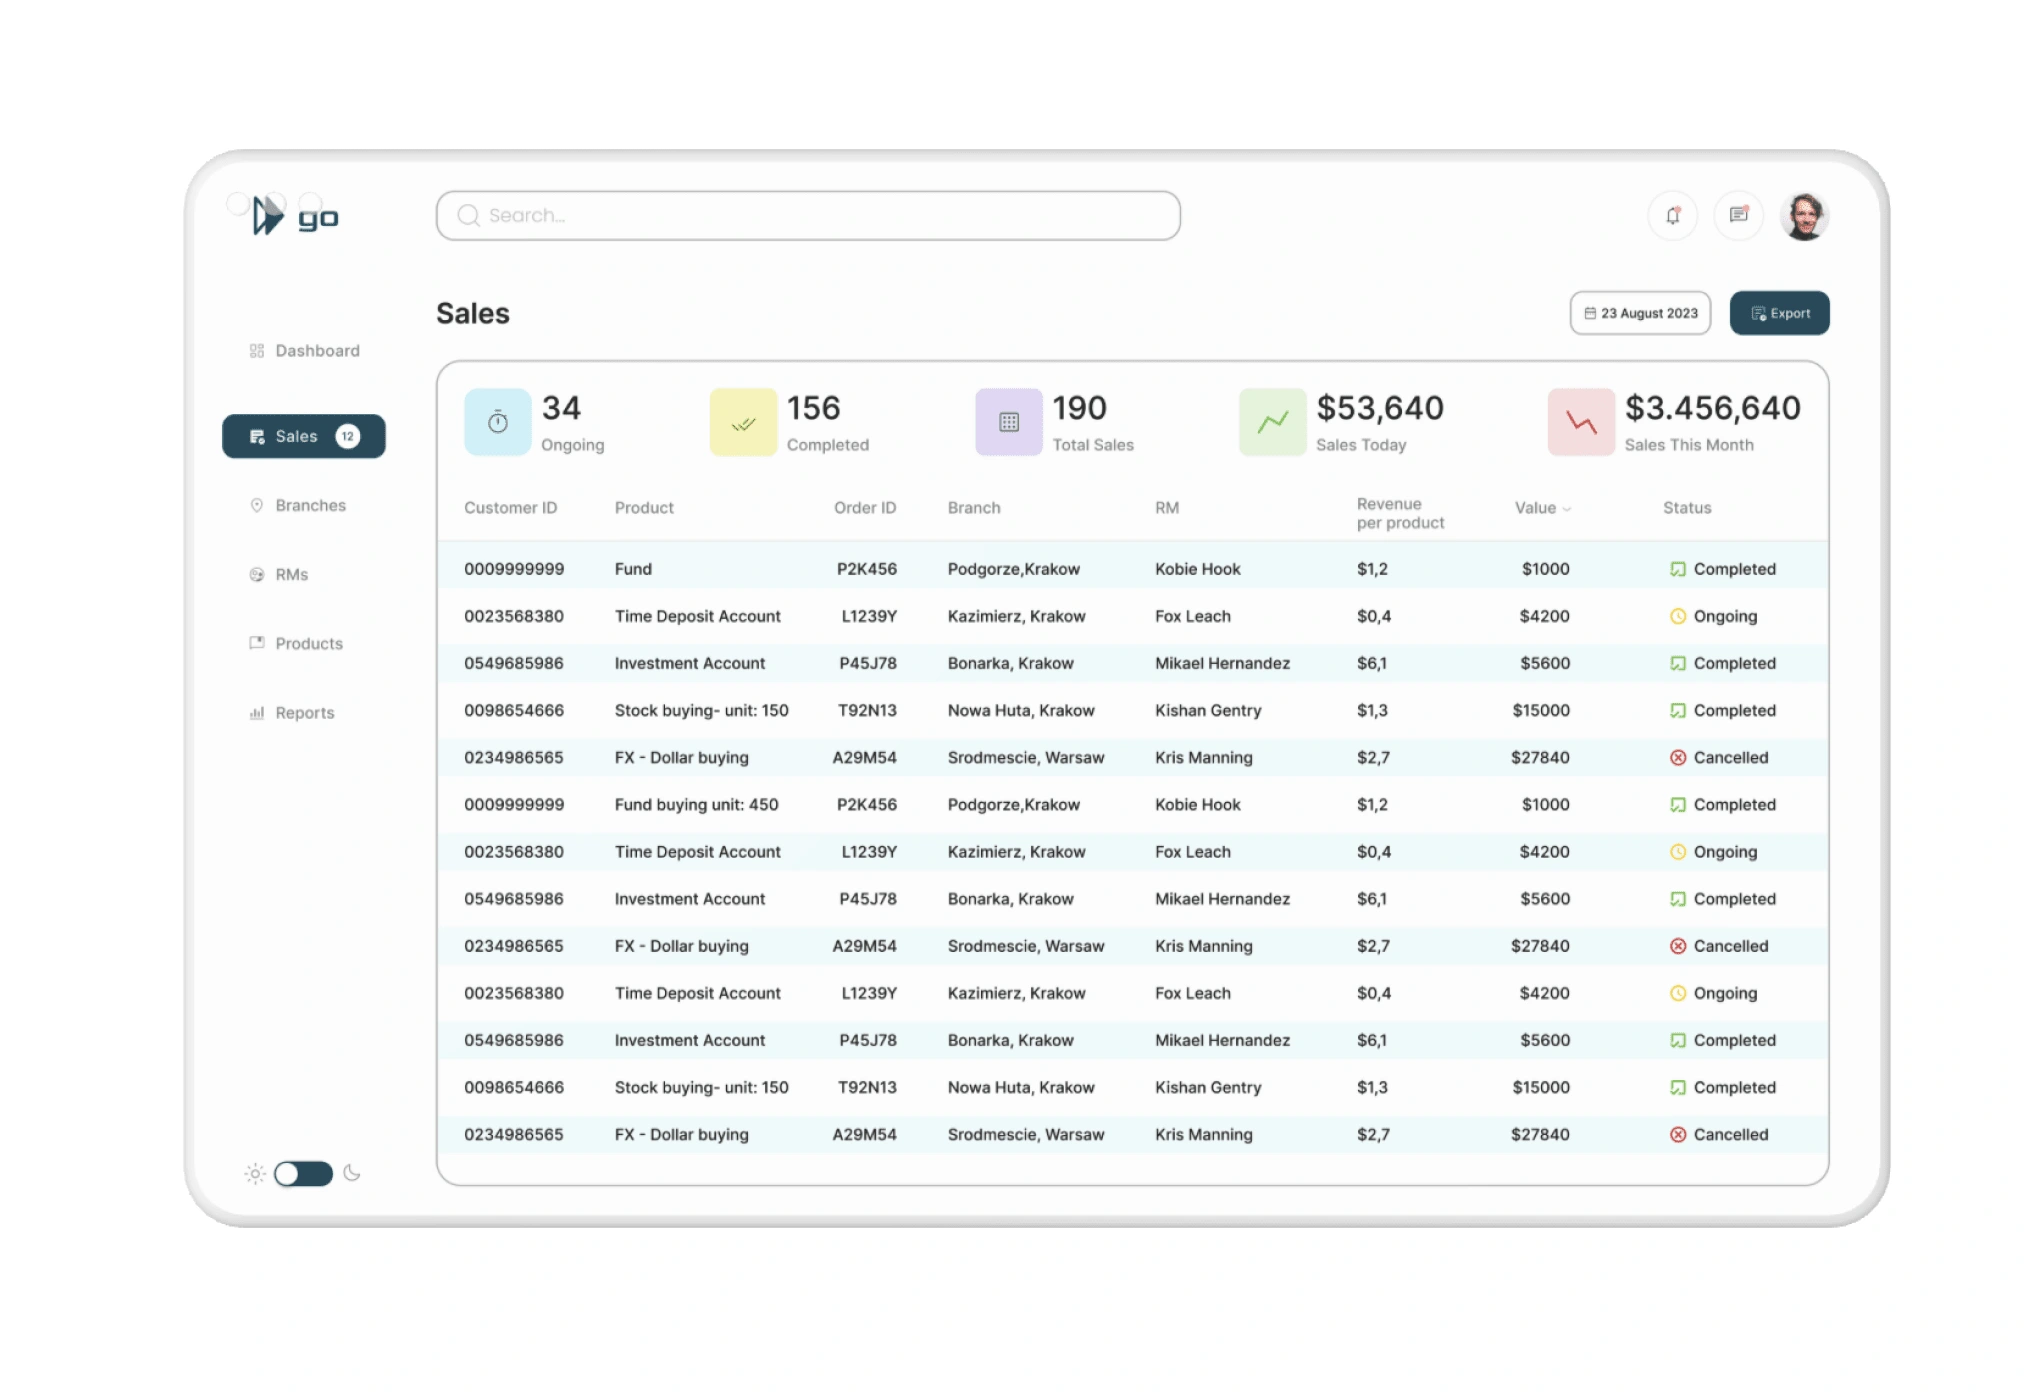
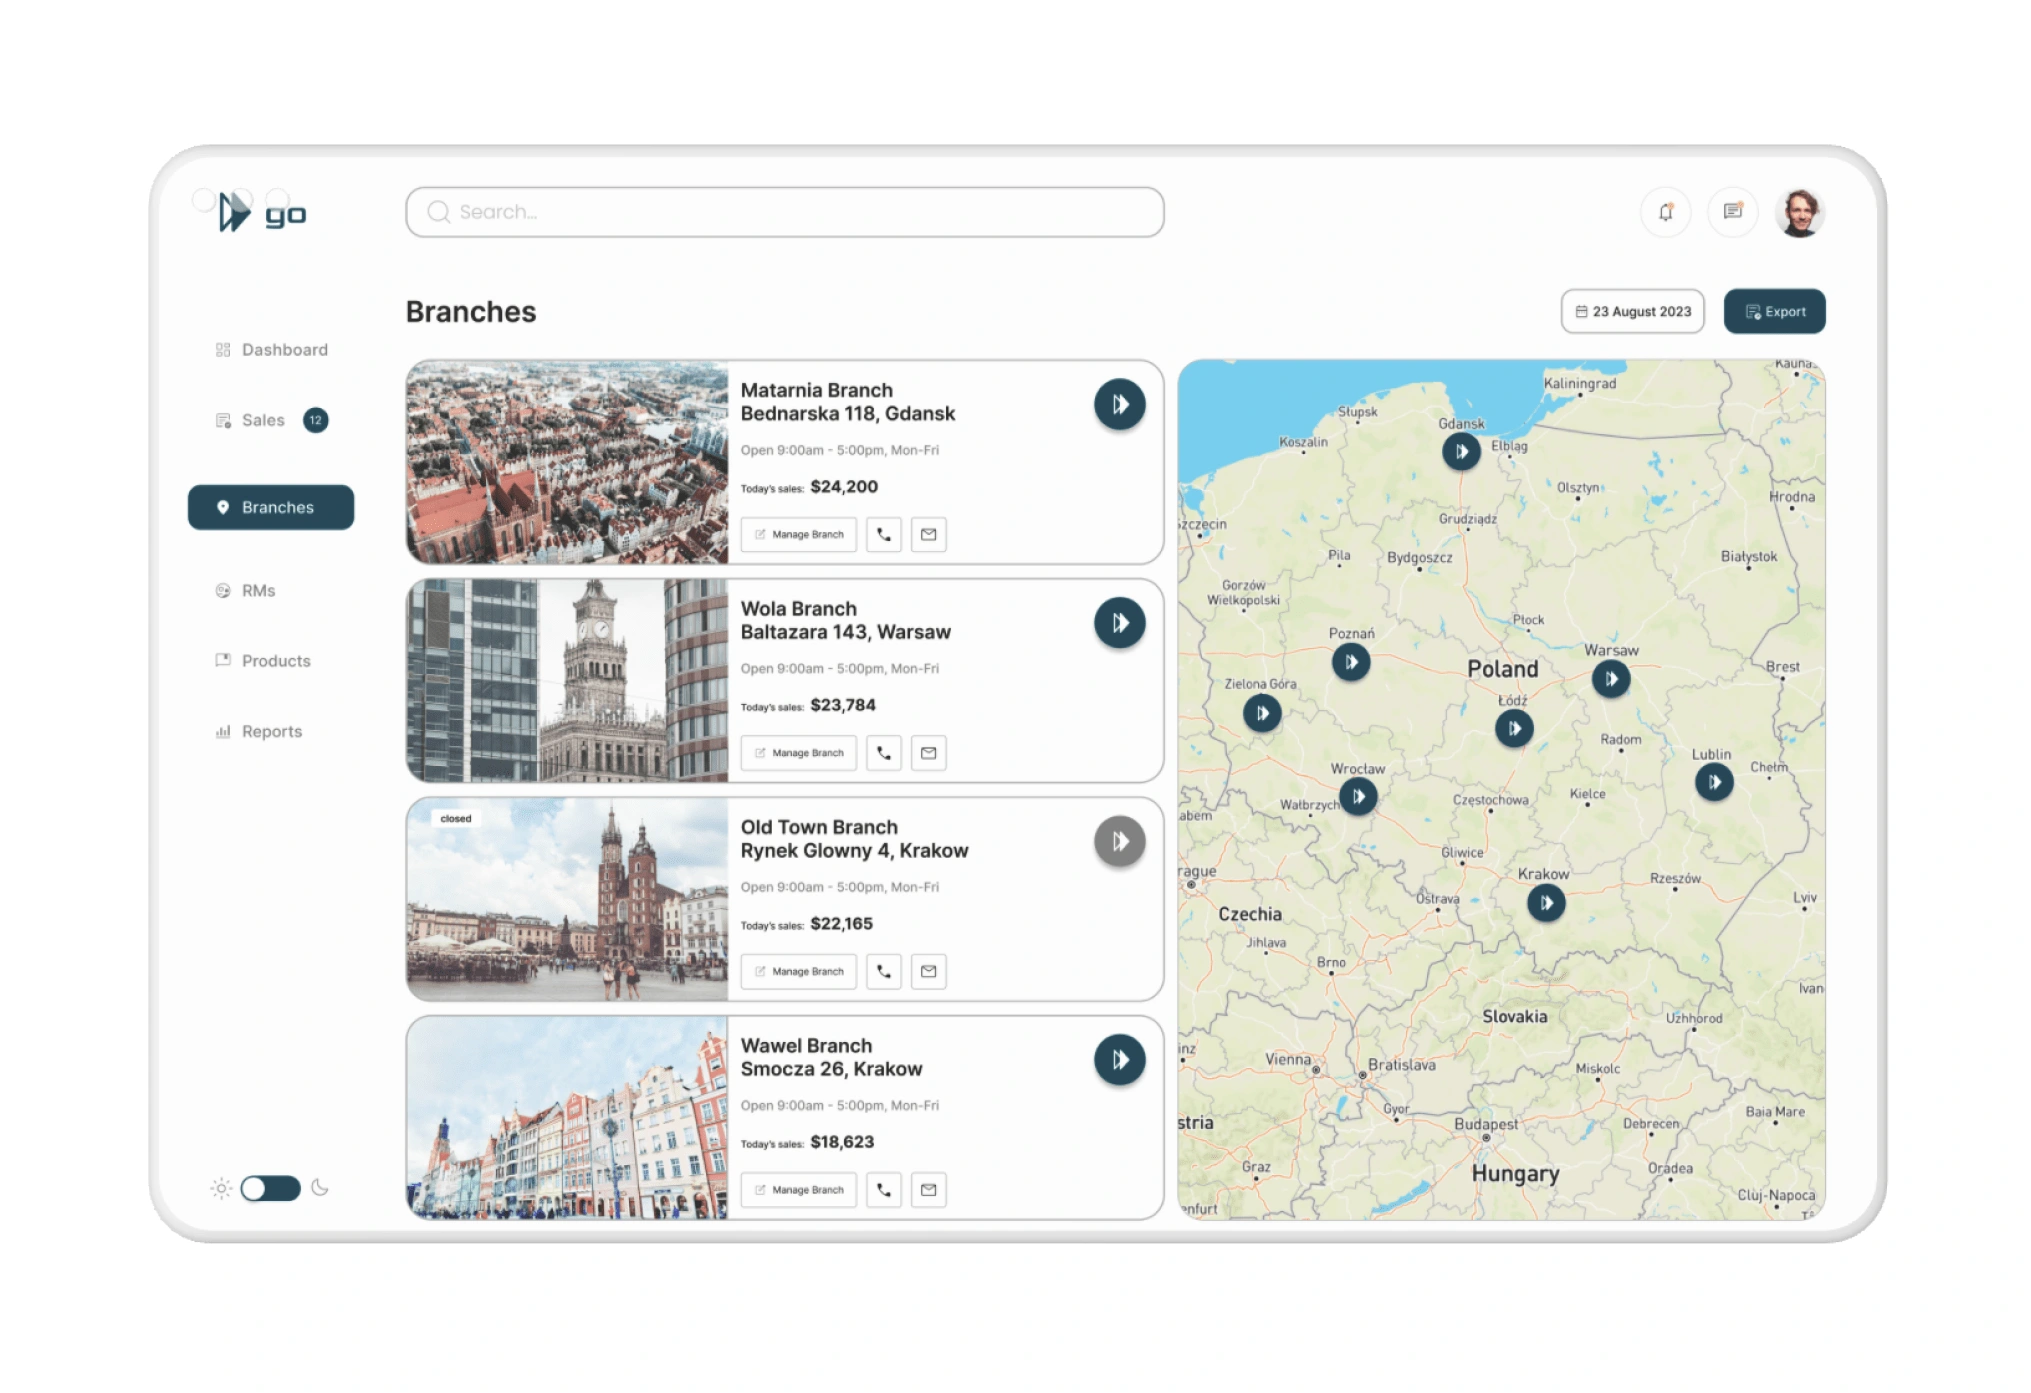
Result 🪄
Dashboard was developed with a unique brand identity in mind. During this capstone project, I was able to explore my creative freedom and develop an identity for the platform. Using data combinations, developing a unique color palette and logo pairing made this project one I am very proud of. Even for the tight deadline, I designed a user-friendly, intuitive, and pain point helper dashboard for the company's staff.
0 likes · 27 views · Jul 10, 2023
An easy way to track branch sales performance
