
Pulse Uptime | High-Precision Latency & Synthetic Edge Monitoring
A high-frequency synthetic uptime monitoring platform and public incident status suite. Engineered with Next.js, Drizzle ORM, Tailwind CSS, and distributed Edge Worker telemetry, providing millisecond-level HTTP/TCP latency verification and incident communication.
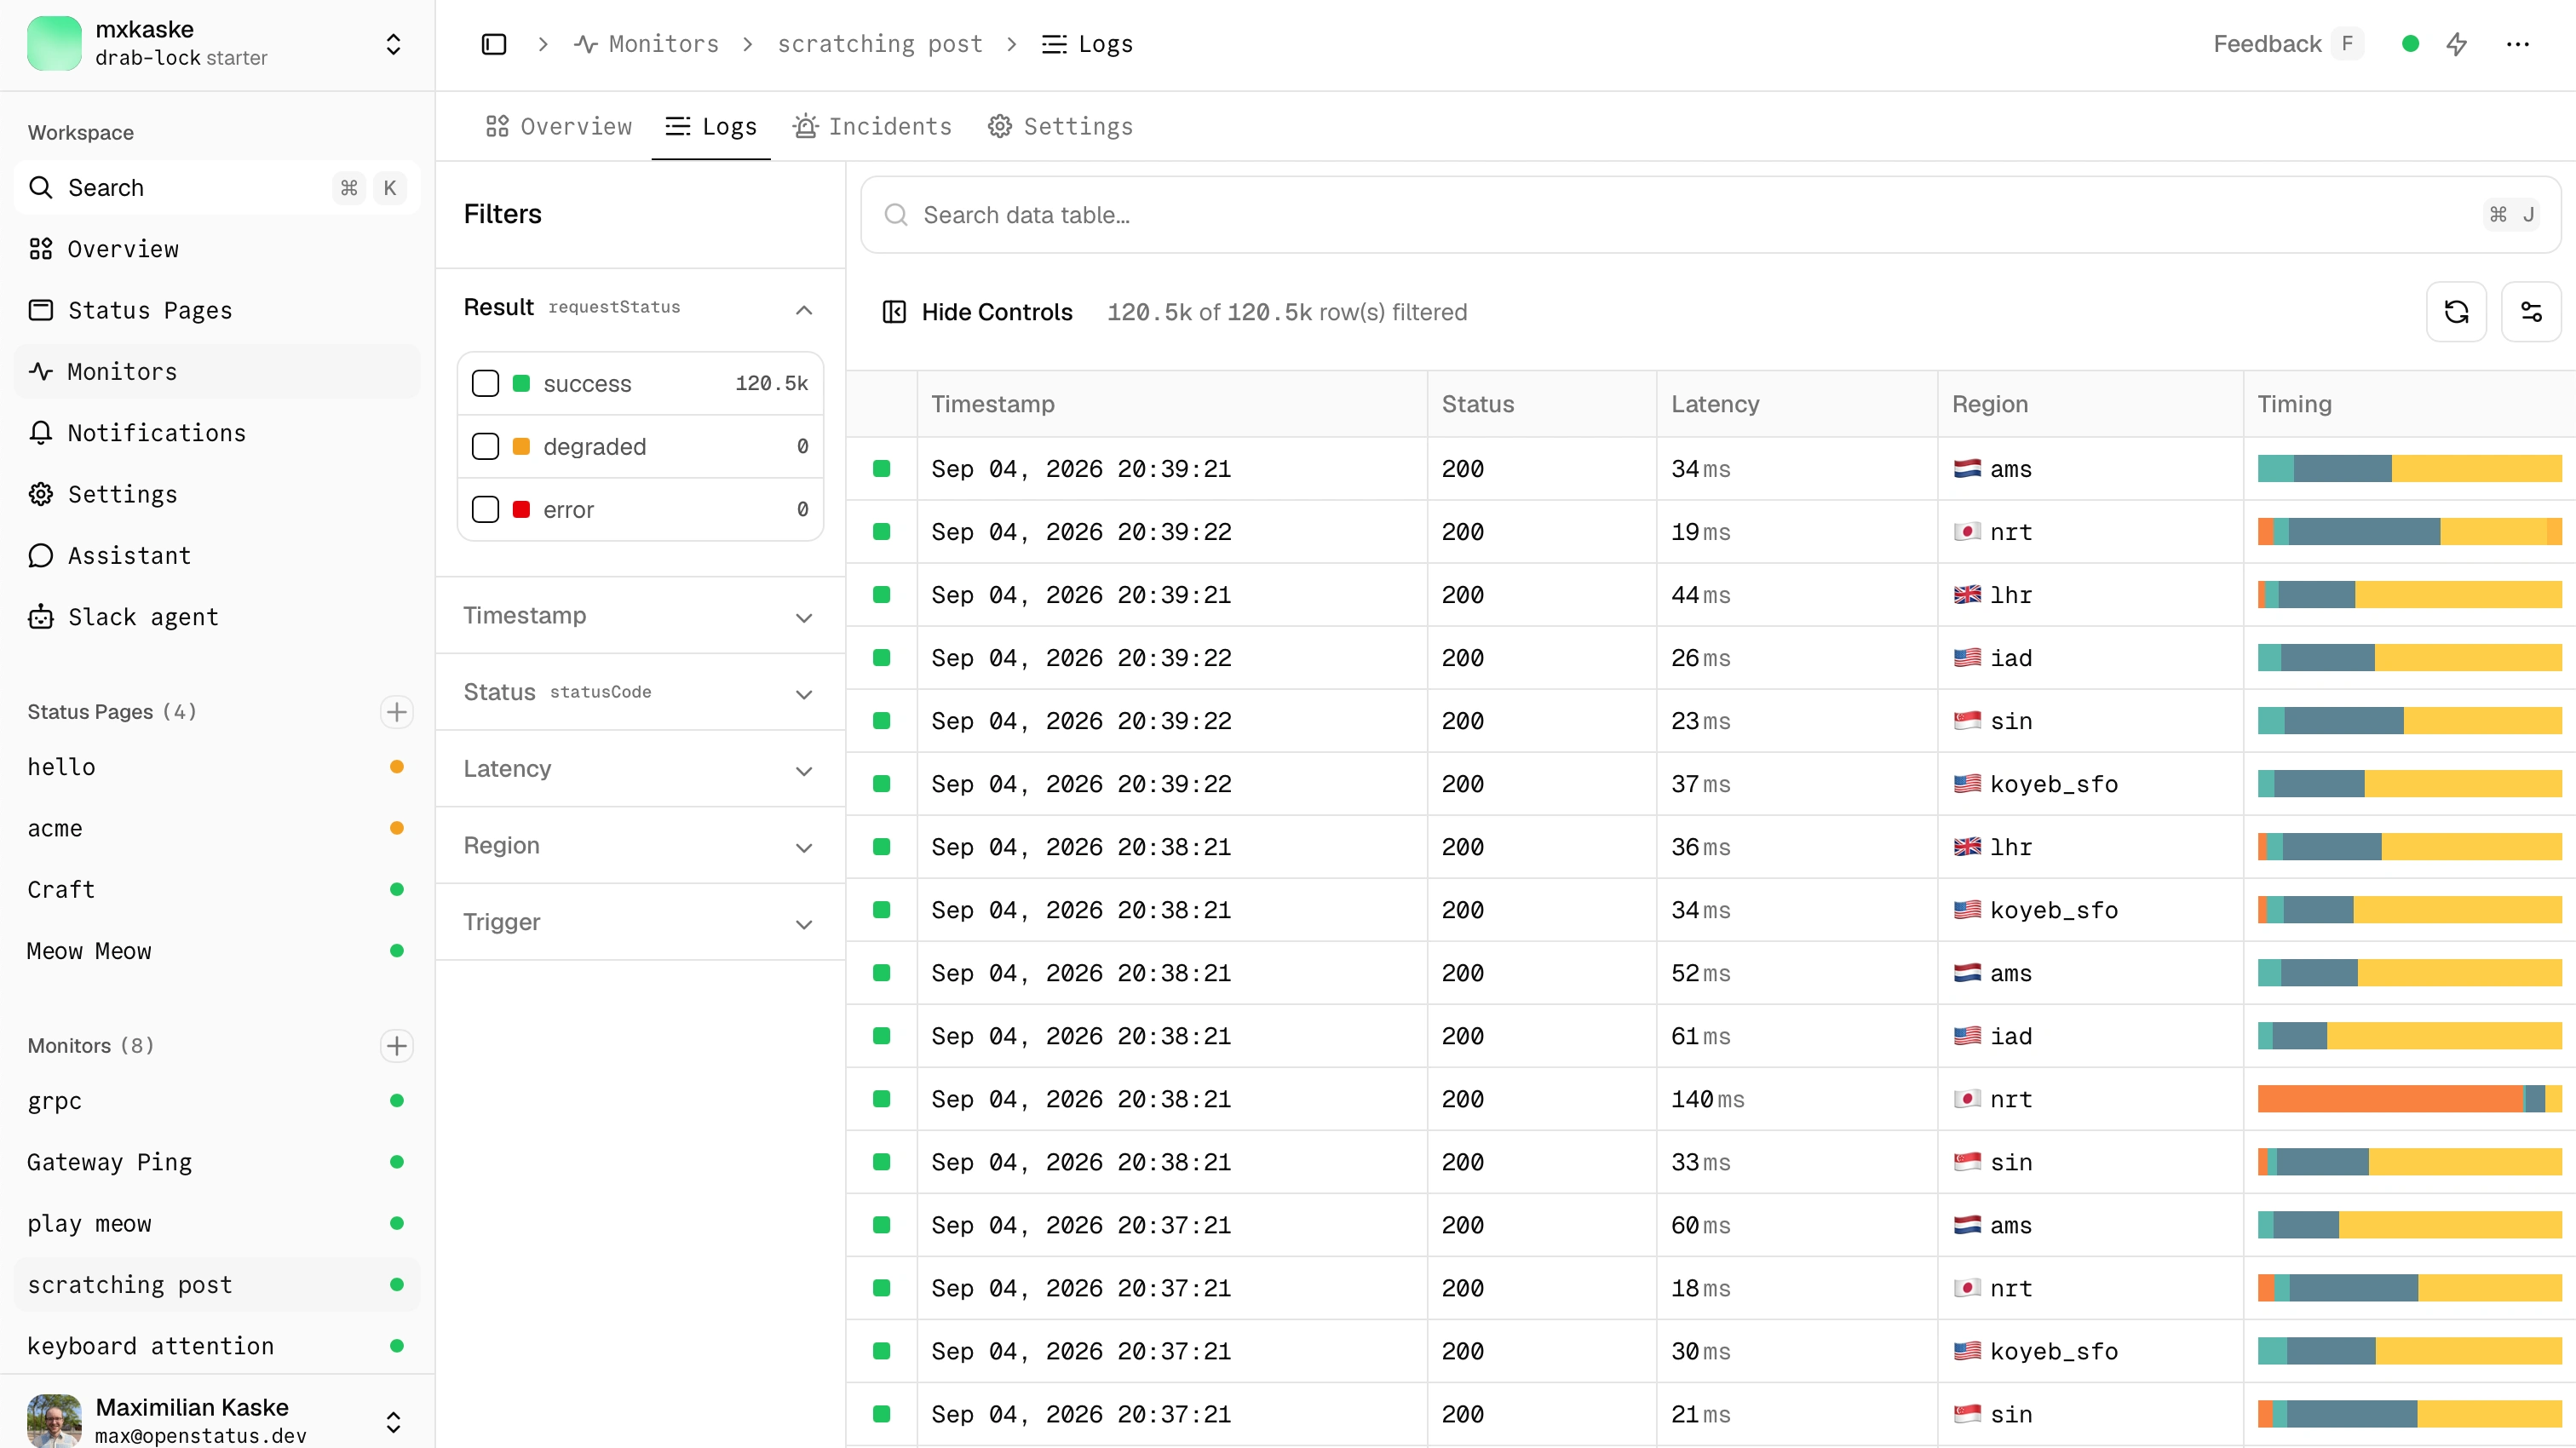
⚡ Executive Summary & Client ROI
Unplanned outages erode customer trust and incur direct financial losses. Pulse Uptime provides real-time distributed health probing across 15+ global regions, alerting engineering teams before service degradation affects end users while maintaining transparent public communication.
Metric
Target Achieved
Business Impact
Probe Frequency
Every 30 Seconds
Instant detection of server anomalies
Global Probe Coverage
15+ Edge Locations
Verification of localized DNS & CDN failures
Status Page Availability
99.999% SLA
Decoupled static caching guarantees visibility
False-Alarm Rate
< 0.01%
Multi-region quorum validation before alert firing
🚀 Key Engineered Features
🌐 Global Synthetic Probing: Sub-second health checks executing via serverless edge workers measuring DNS resolution, TCP handshake, TLS negotiation, and TTFB.
📈 Real-Time Latency Telemetry: Interactive timeline heatmaps and histogram graphs mapping response times per continent.
📢 Public & Private Status Pages: Customizable incident broadcast dashboards with custom domain mapping, SSL provisioning, and subscriber notifications.
🚨 Multi-Channel Alerting Engine: Instant alerts dispatched via Webhooks, Slack, Discord, Telegram, PagerDuty, and SMS.
🛡️ Multi-Region Consensus Checking: Prevents localized false alarms by requiring independent confirmation from secondary geographic edge nodes.
📋 SLO / SLA Compliance Tracking: Automated generation of monthly uptime percentages (99.9% vs 99.99%) for corporate vendor reporting.
🏛️ System Architecture
Loading
Unable to render rich display
flowchart TD subgraph EdgeWorkers["Global Edge Probing Network"] ProbeUS["US-East Edge Node"] ProbeEU["EU-Central Edge Node"] ProbeAPAC["APAC-Tokyo Edge Node"] end subgraph Target["Monitored Infrastructure"] CustomerAPI["Customer Endpoints & Webhooks"] end subgraph ControlPlane["Pulse Uptime Control Plane"] Ingestion["Telemetry Ingestion Engine"] Quorum["Consensus & Anomaly Engine"] DB[(Time-Series Metric Store)] Notifier["Alert Dispatcher (Slack/Telegram)"] PublicStatus["Cached Public Status Page"] end EdgeWorkers -->|Health Check 30s| Target EdgeWorkers --> Ingestion Ingestion --> Quorum Quorum --> DB Quorum -->|Outage Detected| Notifier DB --> PublicStatus
🛠️ Complete Tech Stack
Framework: Next.js (Turborepo Monorepo Architecture)
Language: TypeScript (Strict Mode)
Edge Probing: Cloudflare Workers / Fly.io Edge Nodes
ORM & Database: Drizzle ORM with PostgreSQL / ClickHouse telemetry
UI & Styling: Tailwind CSS & shadcn/ui
Charts: Tremor & Recharts
🏁 Quick Start & Local Setup
1. Install dependencies pnpm install # 2. Configure environment cp .env.example .env.local # 3. Synchronize database schema pnpm db:push # 4. Start development server pnpm dev
Open http://localhost:3000 to view the monitoring console.
👨💻 Engineering Lead & Contract Inquiries
Architected and maintained by Niall.M — Senior Webmaster, Principal Frontend Engineer & E-Commerce Architect.
🌐 GitHub: github.com/niallmuk
📧 Email: niall@nialluk.com
💬 Telegram: @nialluk
📱 WhatsApp: +44 7446317825
💼 Contra Profile: Available for cloud infrastructure, uptime engineering, and microservices observability contracts.
0 likes · 0 views · Nov 13, 2026
High-frequency synthetic uptime monitoring and public incident status suite providing millisecond HTTP/TCP latency verification and incident communication.

