SpaceX Falcon 9 Landing Prediction Model

Filipe Braiman


SpaceX Falcon 9 First Stage Landing Prediction
IBM Data Science Professional Certificate Capstone Project
Project Overview
This project is an enhanced adaptation of my IBM Data Science Capstone project, delivering an end-to-end data science solution to predict the landing success of the SpaceX Falcon 9 rocket's first stage. The original capstone project was completed as part of my IBM Data Science Professional Certificate on Coursera.
The Falcon 9 is a revolutionary vehicle in the aerospace industry due to its reusable first stage, which dramatically reduces launch costs. The ability to accurately predict landing success is critical for cost estimation, operational planning, and competitive analysis in the commercial launch market.
This project demonstrates a complete workflow from data acquisition to predictive modeling, providing actionable insights into the factors driving launch success.
Project Objectives
The primary goals of this project were to:
Identify the key factors—such as payload mass, booster version, orbit type, and launch site—that influence Falcon 9 first-stage landing success.
Quantify performance differences between launch sites and booster versions.
Explore how payload ranges and mission profiles affect landing outcomes.
Build and evaluate a predictive model capable of accurately forecasting landing success to support decision-making.
Methodology and Workflow
The project followed a comprehensive data science pipeline:
Data Collection: Combined data from the SpaceX REST API and web-scraped Wikipedia to build comprehensive datasets of Falcon 9 launches.
Data Wrangling: Cleaned, standardized, and engineered key features, including payload mass, booster version, orbit type, and the target landing outcome variable.
Exploratory Data Analysis (EDA):
Performed structured data analysis using SQL.
Conducted statistical visual analysis with Python libraries.
Mapped launch sites and outcomes geographically using Folium.
Interactive Visualization: Built an interactive Plotly Dash dashboard for dynamic exploration of launch data and success rates.
Predictive Modeling: Trained, tuned, and evaluated multiple classification models, including Logistic Regression, Support Vector Machine (SVM), Decision Tree, and K-Nearest Neighbors (KNN), using GridSearchCV for hyperparameter optimization.
Key Results and Findings
Model Performance Comparison
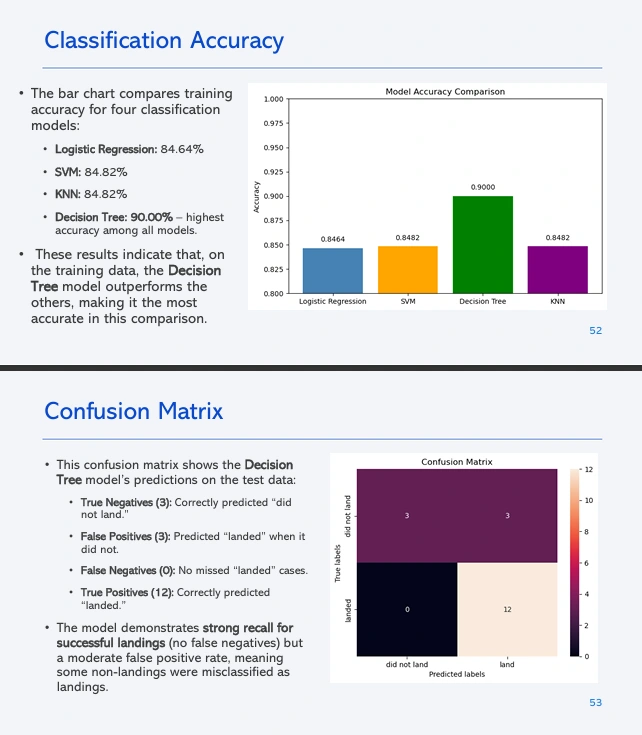
After training and evaluation, the performance of the classification models was compared based on accuracy.
Model Training Accuracy Test Accuracy Decision Tree 88.9% 94.4% Support Vector Machine (SVM) 86.2% 83.6% Logistic Regression 83.4% 83.3% K-Nearest Neighbors (KNN) 83.4% 77.8%
Conclusions
The Decision Tree classifier was the best-performing model with a 94.4% test accuracy, demonstrating excellent predictive power for landing success.
Logistic Regression and SVM showed strong and consistent performance, making them reliable candidates for scenarios where model interpretability is key.
Data analysis revealed that booster upgrades and payload optimization are critical factors in improving landing reliability. Furthermore, launch site KSC LC-39A demonstrated the highest success rate.
Repository Structure
Launch on Binder
Some notebooks include interactive Plotly and Folium visualizations that may not render correctly on GitHub.
To view the fully interactive version, launch it on Binder:
Installation and Usage
Prerequisites
Ensure you have Python 3.7 or later installed on your machine.
Steps
Clone the repository:
Install required libraries:
Run the Jupyter Notebooks: Execute the notebooks in numerical order (from 1- to 8-) to follow the project's workflow from data collection to prediction.
Launch the Dash App (Optional):
Then, open your web browser to the address provided in the terminal (typically
http://127.0.0.1:8050/).Technologies and Libraries
Languages: Python, SQL
Data Handling: Pandas, NumPy
Data Collection: Requests, Beautiful Soup
Database & Analytics: SQLAlchemy, ipython-sql
Visualization: Matplotlib, Seaborn, Plotly, Folium
Machine Learning: Scikit-learn
Web Application: Dash
Author
Filipe Braiman Carvalho
Applied AI & LLM Systems | Deep Learning · Transformers · RAG · Computer Vision | End-to-End ML Engineering
Email: filipebraiman@gmail.com
LinkedIn: linkedin.com/in/filipe-b-carvalho
GitHub: github.com/filipe-braiman
About Me
AI and data professional with experience in LLM evaluation, retrieval-augmented generation (RAG), and AI model validation. Currently working in AI R&D at Huawei as an AI Evaluation Specialist, contributing to the reliability and real-world performance of LLM and RAG systems. Strong background in Python-based data and AI workflows, including model assessment, dataset development, and analytical reporting for production-oriented AI solutions. Portfolio projects explore deep learning architectures, computer vision, RAG systems, and applied machine learning experimentation, emphasizing reproducible ML pipelines and practical AI engineering.
Version History
Version Date Changes 1.0 2025-10-29 First publication. 1.1 2026-03-08 Updated Author section.
Like this project
Posted Sep 9, 2026
A notebook‑driven data science pipeline that collects, cleans, analyzes, and models SpaceX Falcon 9 launch data to predict first‑stage landing success.
Likes
0
Views
1