Interactive Data Visualization
Kashish Rastogi
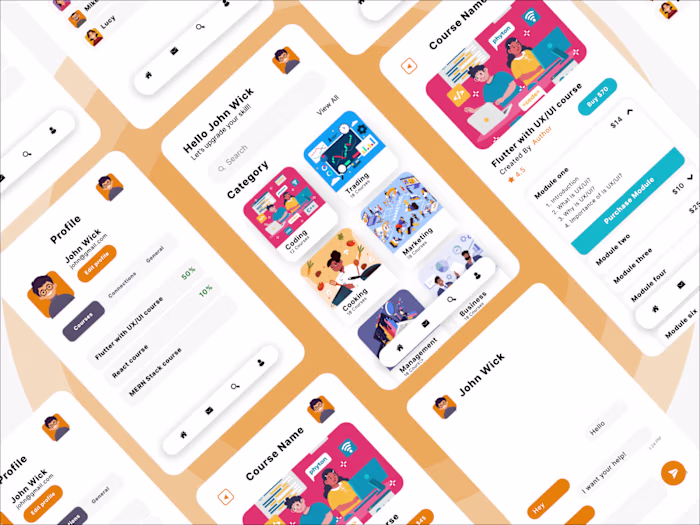
Overview
I create interactive designs that promote increased engagement and generate higher leads for companies. Through intuitive design and thorough user research, I enhance the user's interaction with the website, ensuring a seamless and enjoyable experience.
📊Project Goals
To make an interactive design and streamline the user experience, making it into the effortless design.
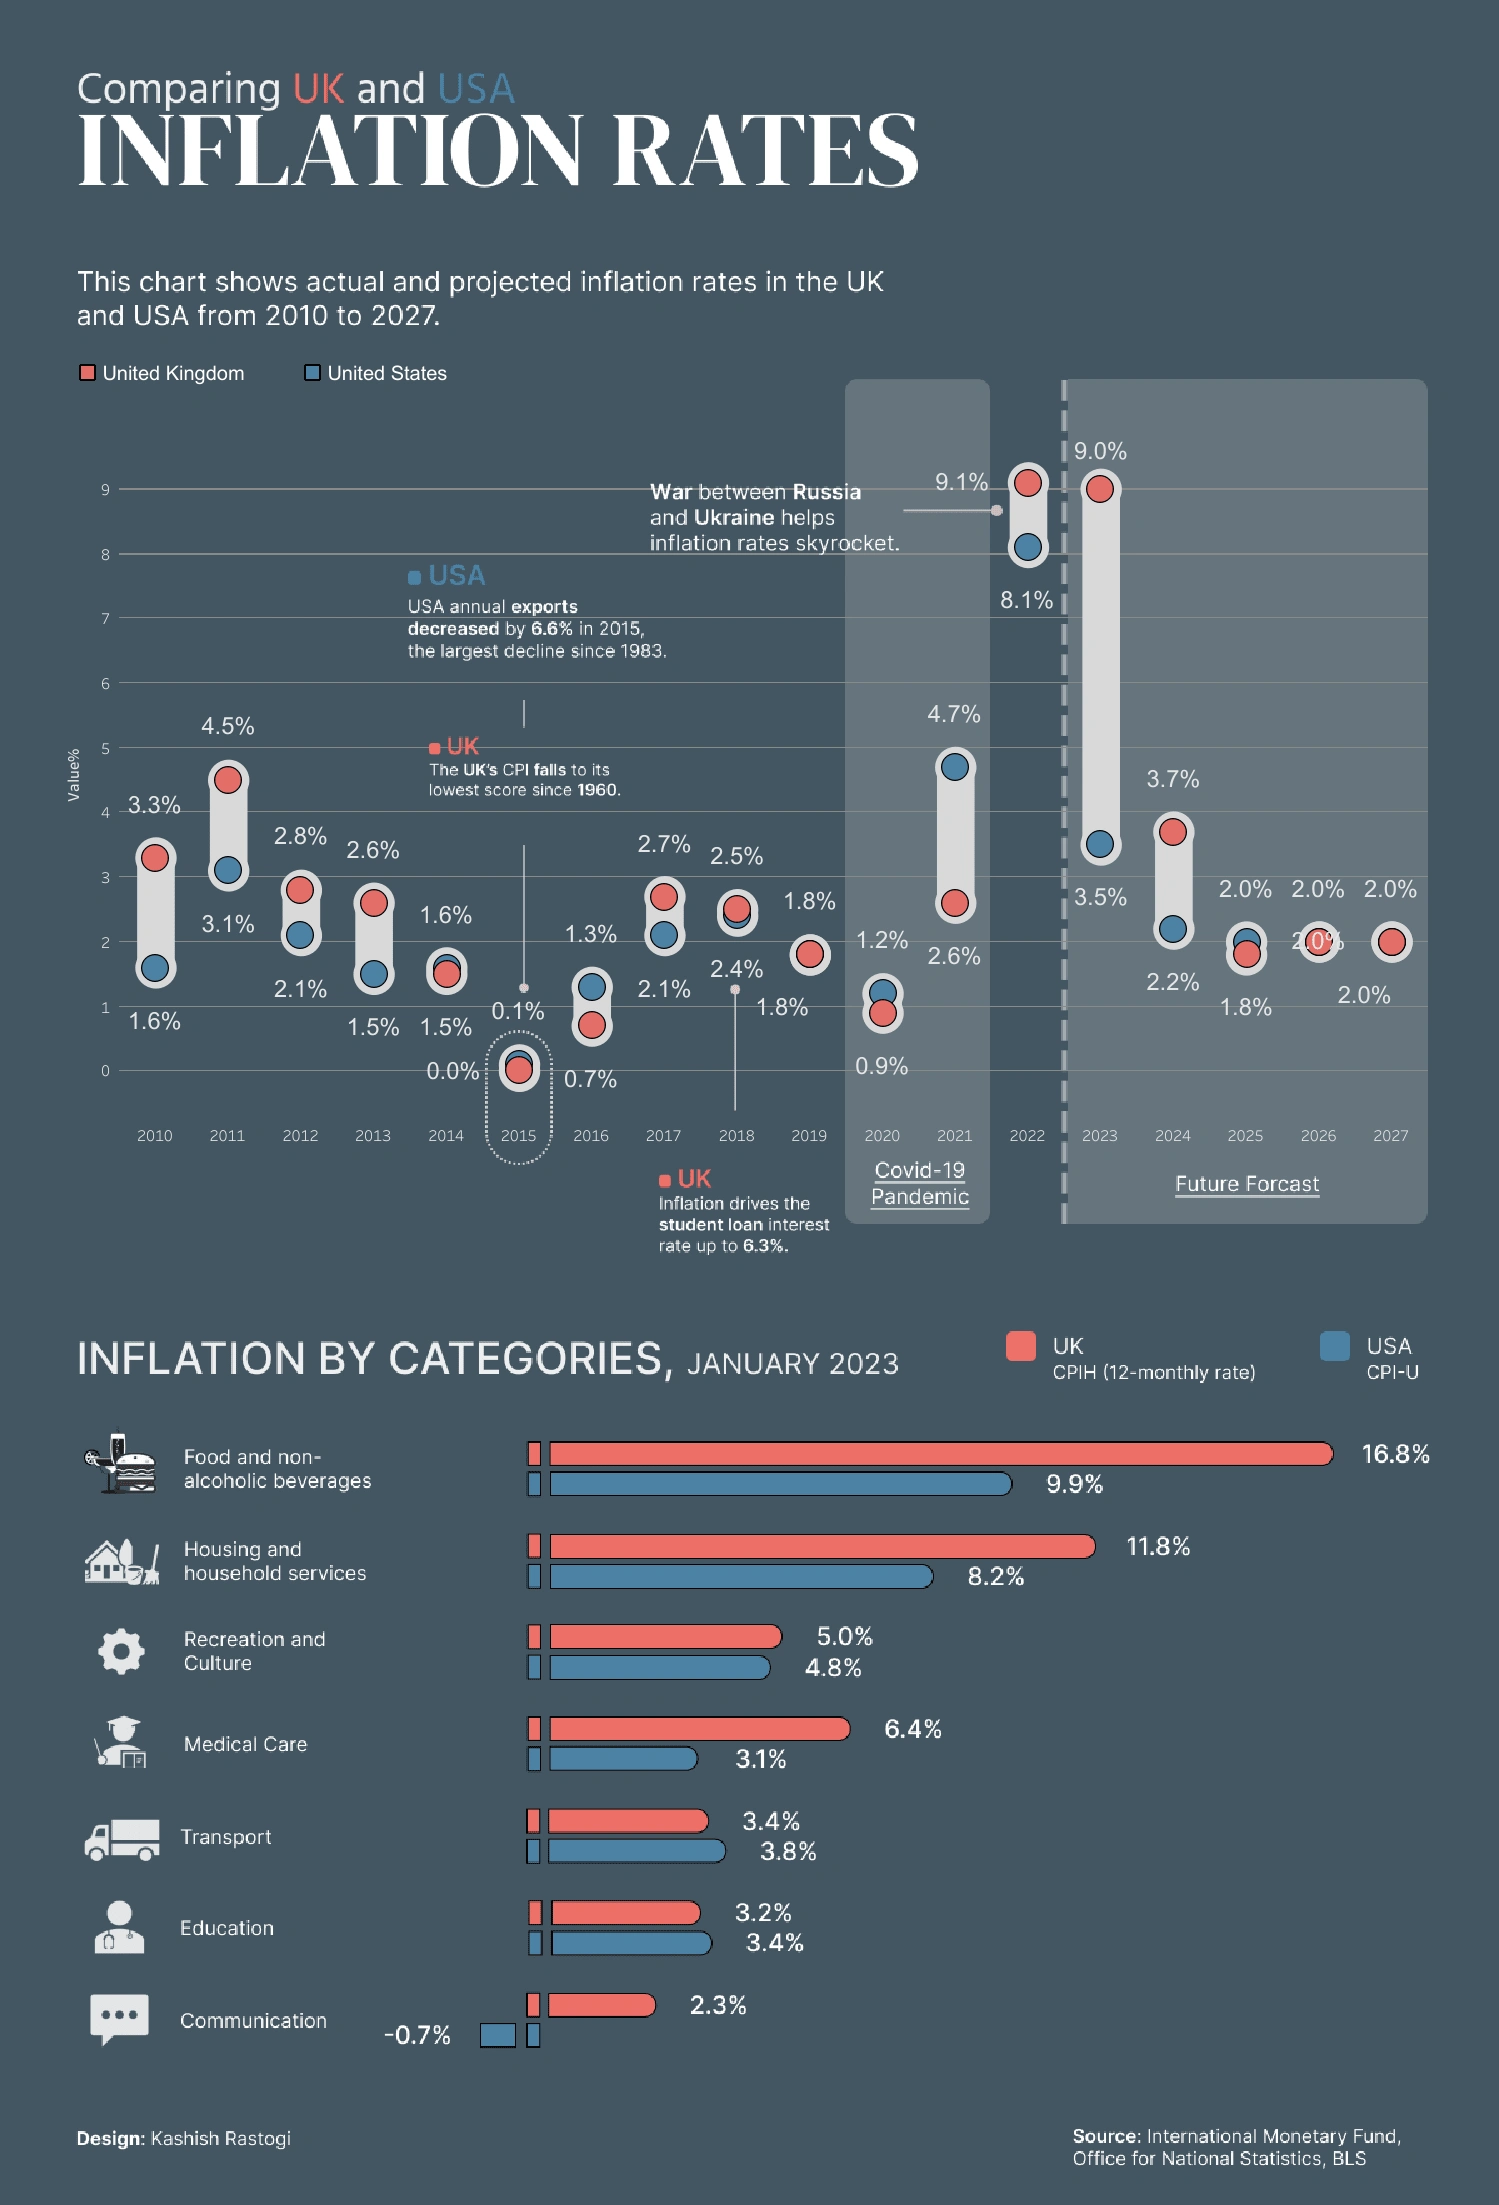
Comparing UK and USA Inflation Rates
Compare the inflation rates of the United States of America (USA) and the United Kingdom (UK) from 2010 to 2027. Analyze the inflation rates by categories for both the USA and UK, such as food and alcoholic beverages, housing, and other significant sectors.
Provide insights into how these inflation rates impact consumer behavior and market trends in both countries.
Highlight any notable differences in inflation trends and their potential implications for businesses and consumers. Present the findings through visually appealing data visualizations and infographics to make the information easily digestible and engaging for the audience.
Loading this content connects you to public.tableau.com.
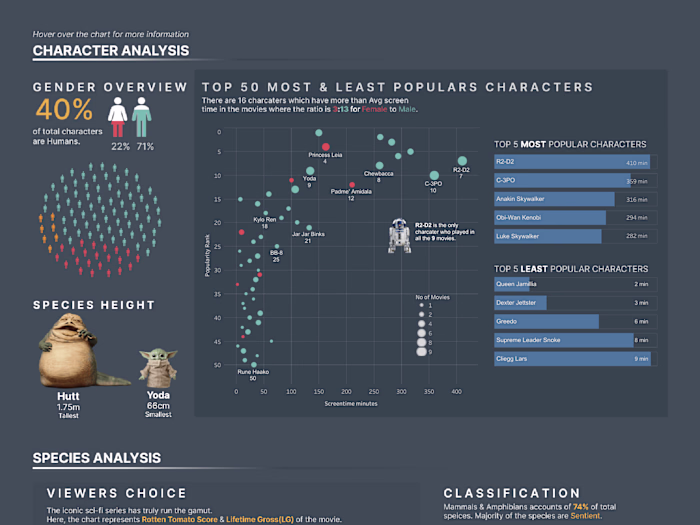
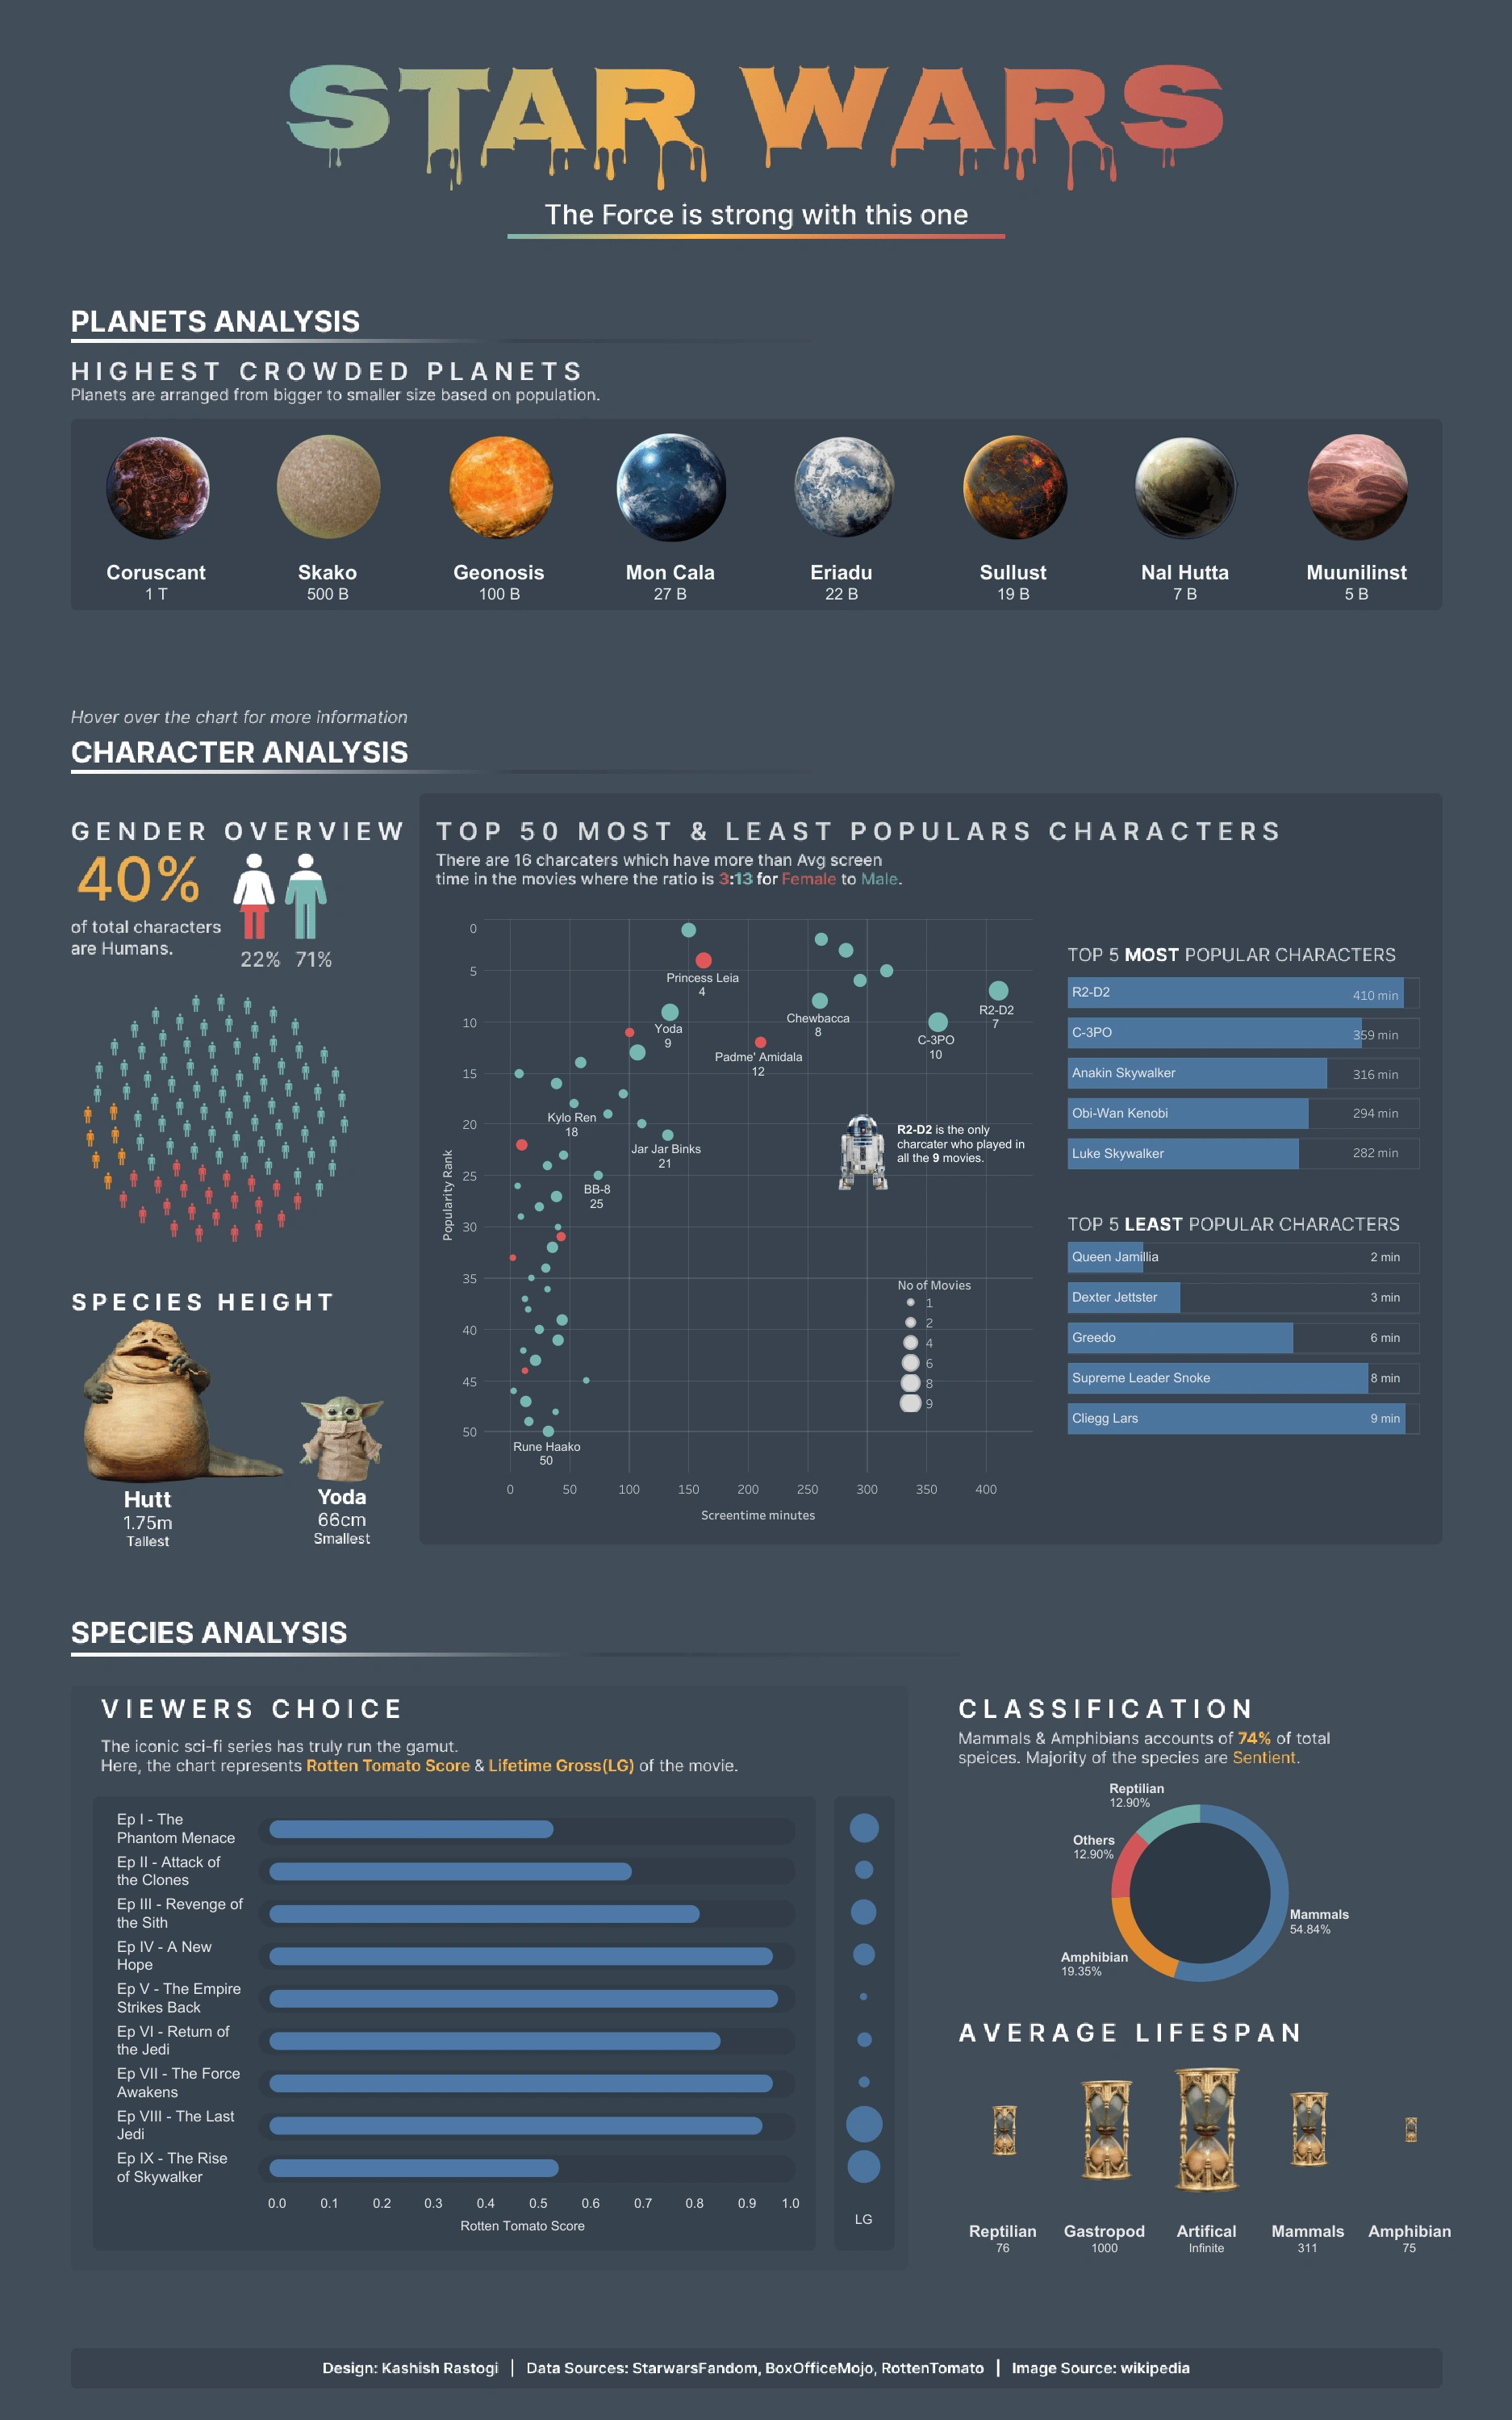
public.tableau.com privacy informationStar Wars: Where the Force is Strong with This One!
Star wars where the force is strong with this one! I have conducted in-depth analyses on planets, characters, and species within the Star Wars universe. This interactive infographic allows users to explore these analyses in an engaging and immersive way, encouraging them to spend more time delving into the data.
Key Features:
Planet Analysis: Detailed insights into the various planets and their population for each planet.
Character Analysis: Comprehensive profiles of key characters, their gender overview, relationships, and pivotal moments in their stories.
Species Analysis: Exploration of different species, their unique characteristics, cultures, and roles within the Star Wars galaxy.
Star Wars
Loading this content connects you to public.tableau.com.
public.tableau.com privacy informationLike this project
Posted Jul 24, 2024
This is interactive infographics which are made in Tableau or Power BI software. Which can embed in any website or even in blog.