Football Data Lakehouse for Performance Analytics

Umair Nawaz


Football Data Lakehouse for Performance Analytics
Table of Contents
Background
Modern football has evolved into a data-driven commercial ecosystem. Broadcasting rights, sponsorship deals, player valuation, and fan engagement are increasingly influenced by league competitiveness, scoring behavior, and performance concentration.
Despite the availability of large volumes of football data, many analyses remain:
Match-centric rather than decision-centric
Descriptive instead of strategic
Disconnected from how analytics systems operate in real organizations
In real business environments, decision-makers rarely work with static datasets. Instead, data is retrieved dynamically from external sources, ingested via APIs, and processed through analytics pipelines before insights are delivered.
This project was created to replicate that real-world scenario and answer questions such as:
Are elite football leagues truly competitive, or dominated by a few teams?
How does scoring behavior differ across competitions and seasons?
Is home advantage a structural phenomenon or seasonal noise?
Which competitions exhibit higher unpredictability and volatility?
The focus is on business relevance, not fan opinion.
Executive Summary
This project presents an end-to-end football analytics case study analyzing performance across the UEFA Champions League, Premier League, and LaLiga for the 2024–2025 seasons. Rather than relying on pre-packaged datasets, match data was retrieved directly from an external football API, simulating how analytics teams ingest live or third-party data in production environments.
The project combines:
Data ingestion via APIs
A structured analytics warehouse
-SQL-based KPI development
Business-focused insight delivery
The final output is a set of decision-ready KPIs, suitable for strategic use by:
League operators
Broadcasters
Club management
Data analysts and consultants
Project Structure & Analytics Deliverables
This repository is structured to reflect a real-world, enterprise-style analytics workflow, covering the complete lifecycle from API ingestion → data warehousing → business insights → executive visuals. Each directory represents a clear responsibility within the analytics pipeline.
Data Architecture & Methodology
This project was architected to mirror production-grade analytics and analytics engineering workflows, demonstrating end-to-end ownership of data ingestion, transformation, and business modeling.
Rather than relying on pre-curated datasets, all data was programmatically sourced, standardized, and modeled to reflect how analytics teams operate in real-world environments.
Bronze Layer — External API Ingestion (Source of Truth)
The Bronze layer captures raw match data directly from an external football data API, serving as the immutable source of truth.
Key Responsibilities
Designed and implemented a Python-based ingestion pipeline
Parameterized API requests by competition and season
Persisted raw API responses as timestamped JSON files
Preserved original payloads without transformation to support reprocessing and auditing
Why This Matters
Enables reproducibility and historical backfills
Separates data collection from analytics logic
Reflects how modern data platforms handle external data sources
This layer demonstrates data acquisition, automation, and traceability, not manual data collection.
Silver Layer — Data Cleaning & Standardization
The Silver layer converts raw API responses into a clean, analytics-ready dataset.
Transformations Performed
Normalized nested JSON structures into tabular format
Standardized team names, identifiers, and competition fields
Enforced consistent season definitions across leagues
Validated match completeness and schema consistency
Removed malformed or non-analytical records
Output
A single, standardized match-level dataset (
matches_clean.parquet)One row per match with consistent semantics across competitions
Why This Matters
Eliminates downstream analytical complexity
Ensures comparability across leagues and seasons
Creates a reliable foundation for KPI development
This layer reflects analytics engineering best practices, not ad-hoc cleaning.
Gold Layer — Analytical Models & Business KPIs
The Gold layer represents business-facing analytical models optimized for SQL analytics and BI tools.
Analytical Tables
fact_matches
Match-level fact table (grain: one row per match)league_kpis
Aggregated league-level KPIs by competition and season
(scoring intensity, total goals, competitiveness indicators)team_performance
Team-level performance metrics
(goals scored, conceded, goal difference, dominance)Design Principles
Clear grain definition
Business-aligned metrics
Optimized for downstream consumption (SQL, BI, exports)
Why This Matters
Translates raw data into decision-ready insights
Enables consistent KPI definitions across analyses
Supports both ad-hoc analysis and executive reporting
Analytical Access & Consumption
To support fast iteration and exploration:
Gold-layer data is queried using DuckDB (SQL-first analytics engine)
Business questions are expressed as reusable SQL queries
KPI outputs are exported as CSVs for visualization and reporting
Gold models are directly consumable by BI tools (e.g. Power BI)
This approach reflects how analytics teams bridge engineering and business stakeholders.
Business Insights
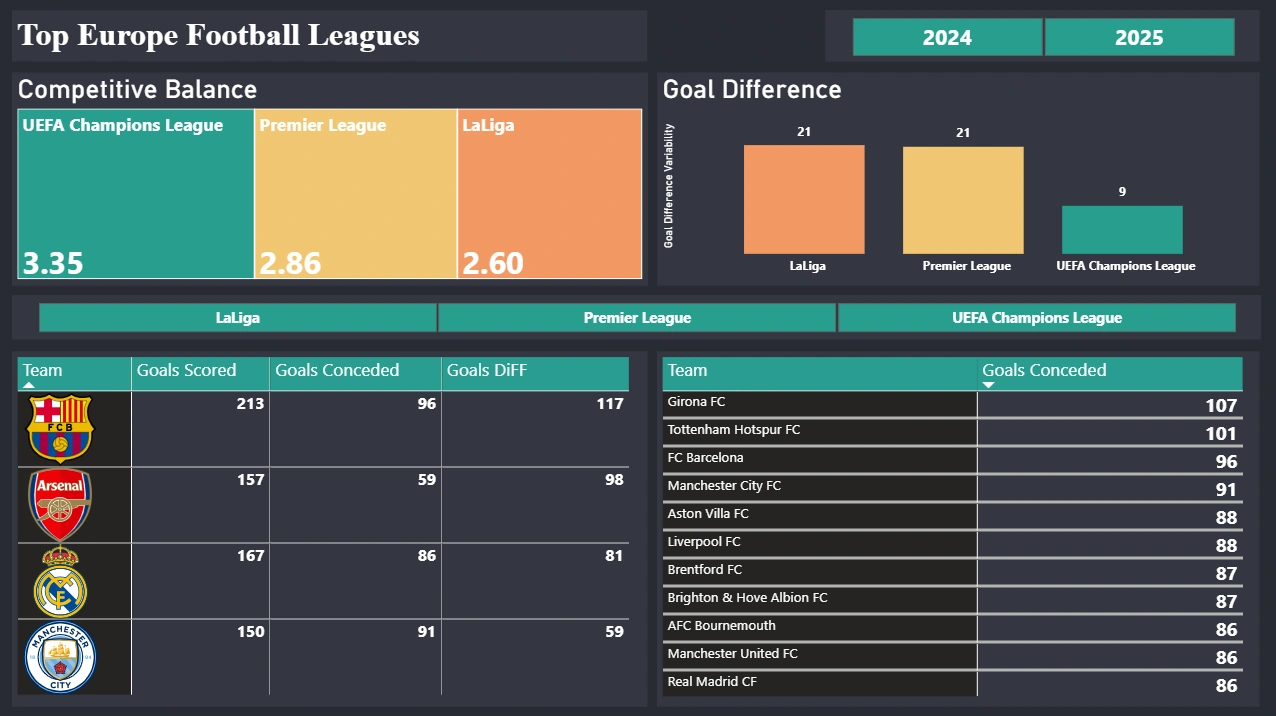
Scoring Intensity Across Competitions
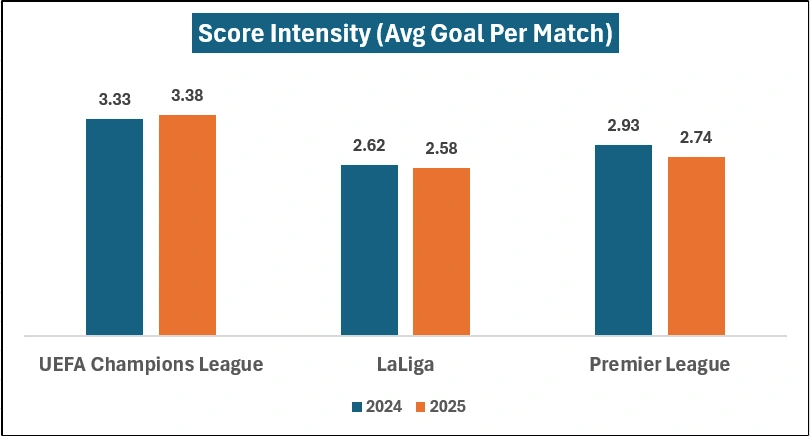
The UEFA Champions League consistently demonstrates the highest scoring intensity, with average goals per match exceeding both LaLiga and the Premier League across the 2024 and 2025 seasons. As shown in the visualization, Champions League matches average above 3.3 goals per match, compared to approximately 2.6–2.9 goals in domestic leagues. This indicates a structurally more open style of play driven by elite team quality, tactical risk-taking, and knockout-stage incentives.
From a business perspective, higher scoring intensity directly enhances:
Viewer engagement and match entertainment value
Broadcast attractiveness and advertising premiums
Global audience retention for marquee fixtures
This reinforces why the Champions League commands premium broadcasting rights relative to domestic competitions.
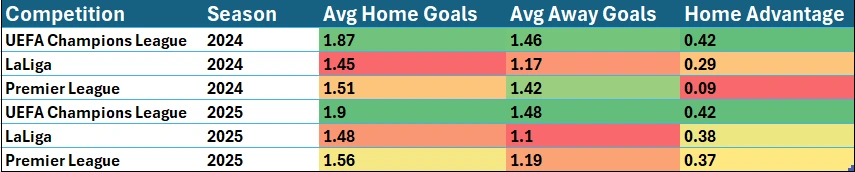
Home Advantage Is Structural
Across all competitions and seasons, home teams consistently score more goals than away teams, confirming that home advantage is a persistent structural factor, not a short-term anomaly. The table highlights a clear home-goal premium ranging from +0.29 to +0.42 goals per match, with the Champions League exhibiting the strongest home advantage. Even in the Premier League—often considered tactically balanced—the home advantage remains statistically meaningful.
For stakeholders, this insight has direct implications for:
Match outcome forecasting and betting markets
Fixture scheduling and competitive fairness
Team performance evaluation and tactical planning
Home advantage remains an embedded feature of football economics and performance modeling.
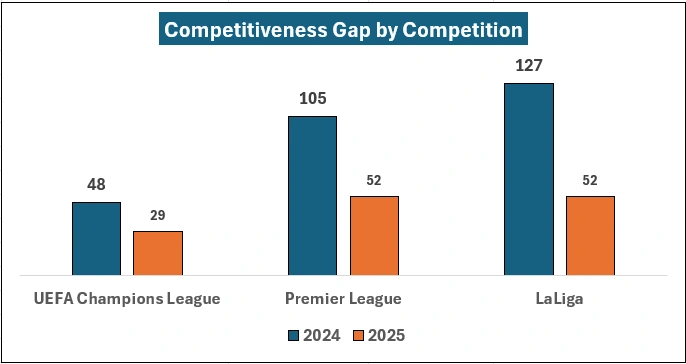
Competitive Balance by League
Domestic leagues exhibit significantly wider competitiveness gaps than the Champions League, indicating a higher concentration of performance among top teams. As visualized, LaLiga and the Premier League show competitiveness gaps exceeding 100 points in 2024, compared to sub-50 gaps in the Champions League. This suggests that domestic leagues are more frequently dominated by a small group of elite clubs.
From a commercial standpoint, uneven competitive balance can:
Reduce long-term fan engagement
Increase predictability of outcomes
Concentrate commercial value around top clubs
The Champions League’s comparatively tighter gap supports its positioning as a more competitively balanced global product.
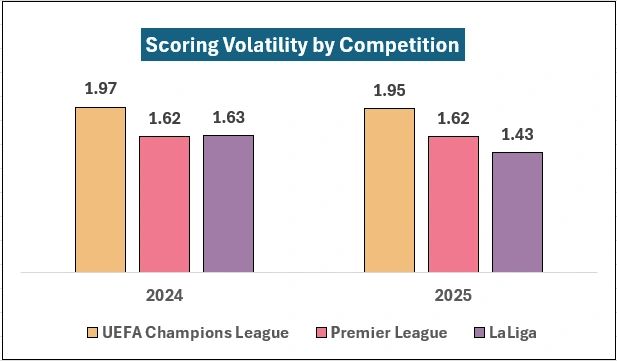
Scoring Volatility in Champions League
The Champions League demonstrates higher year-over-year scoring volatility compared to domestic leagues, reflecting its knockout structure and dynamic team composition.The volatility chart shows noticeable shifts in scoring patterns between 2024 and 2025, unlike the more stable trends observed in LaLiga and the Premier League. This volatility is driven by:
Knockout match pressure
Short tournament horizons
Elite team rotation and tactical adaptation
For broadcasters and analysts, higher volatility increases:
Match unpredictability
Viewer suspense
Demand for advanced forecasting and analytics
This reinforces the Champions League’s identity as a high-risk, high-reward competition.
Strategic Recommendations
Based on the analytical findings, the following recommendations translate performance metrics into clear, actionable business decisions for leagues, broadcasters, and clubs.
Strengthen Competitive Balance to Protect Fan Engagement
The analysis shows that domestic leagues—particularly LaLiga and the Premier League—exhibit widening performance gaps driven by a small number of dominant teams. Over time, reduced competitive balance increases outcome predictability and weakens fan interest.
Business actions:
Track competitive balance KPIs as part of regular league performance reviews
Identify early signs of excessive dominance before fan engagement declines
Use balance metrics to support policy, financial, or scheduling adjustments
Sustaining competitive balance is essential for long-term audience growth and commercial stability.
Use Champions League Match Dynamics to Maximize Broadcast Value
The UEFA Champions League displays higher scoring intensity and volatility compared to domestic leagues, creating more unpredictable and high-impact fixtures.
Business actions:
Prioritize high-volatility matches for premium broadcast slots
Align advertising pricing with expected match intensity
Factor volatility metrics into media rights valuation and scheduling strategies
These dynamics reinforce the Champions League’s premium global positioning.
Incorporate Home Advantage into Performance Evaluation
Across all competitions, home teams consistently outperform away teams, confirming home advantage as a structural factor, not random variation.
Business actions:
Adjust performance evaluations to account for home vs. away bias
Use home advantage metrics when assessing team strength and results
Support fair fixture planning by monitoring home-away balance
Accounting for home advantage improves the accuracy of performance and outcome assessments.
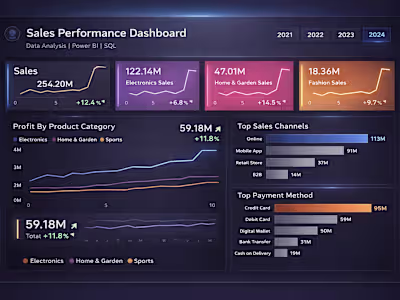
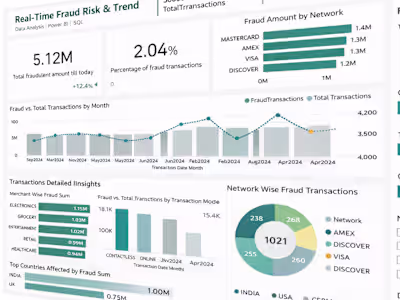
BI Dashboard
Like this project
Posted Mar 31, 2026
Developed a data-driven analytics warehouse for football performance.
Likes
0
Views
3