Scientific Literature Review
Like this project
Posted Dec 1, 2023
Literature review created for a research project conducted under the supervision of Dr Maureen Hagan with the Monash University Neuroscience Department.
Visual Saliency and its Representation in the Primary Visual Cortex during Free-viewing of Natural Images
Visual saliency: the conspicuousness of an object in contrast to the rest of the visual space. Visual saliency is an integral component of how our visual system selects which information in the visual field is attended to and processed, and subsequently, influences the way we experience and interpret the visual world. Investigating how visual salience is represented in the primary visual cortex (V1) can contribute diagnosing and screening neuropsychiatric disorders in an efficient and cost-effective way. As such, this paper will review the available
literature on visual attention, visual saliency and its computational models that can be applied to the neuropsychiatric field.
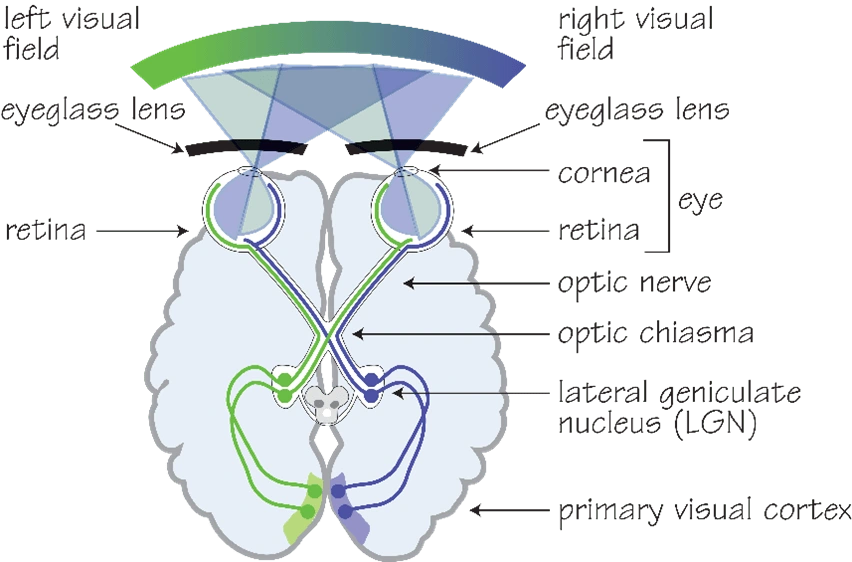
Figure 1. Diagram of the human visual system (1).
The visual system comprises of hierarchal levels of processing that keeps visual
information segregated (1). The visual field can be divided into the left and right visual field, where information from each field is signalled by photoreceptor cells in the retina of the eye and transmitted by the optic nerve to specific layers of the lateral geniculate nucleus (LGN). As presented in figure 1, the information is transmitted contralaterally; it crosses at the
optic chiasma and thus the left side of the brain processes information from the right field and vice versa. Information from the LGN is then transmitted to the V1, still segregated in their corresponding layers. Retinotopic organization also further segregates information in the V1, as small adjacent areas in the visual field called receptive fields are mapped onto the V1 topographically (2). Furthermore, Hubel and Wiesel discovered that the V1 also contains anatomical ocular dominance columns of neurons that respond preferentially to one eye (3,4). Similarly, anatomical columns of neurons tuned to detect specific orientations of lines in the visual space are also prevalent in the V1, whereas colour is detected by regions in the V1 termed ‘blobs’ (5). This information is then sent to higher brain centres in two-pronged approach: the dorsal and ventral pathway. The dorsal pathway involves processing motion and guiding action based on visual information, following a dorsal path towards the parietal cortex whereas the ventral pathway is concerned with object recognition and follows a ventral path towards the temporal cortex (6).
Due to biological restrictions and metabolic efficiency, the visual system is unable to process the entire visual space and instead attends to certain objects and information selectively (7). The fovea is a small region on the retina where visual acuity is centralized, as such, objects are at its highest resolutions when the fovea is directed towards it. When we purposefully direct our fovea to certain objects in a visual space, it is termed ‘overt attention’ and it is
facilitated by top-down, goal oriented or task-dependent control (8). However, during free-viewing of a visual space, the eyes make quick movements, saccades, to various fixation points on the scene, enabling a quick perception of the visual space (7). These saccades are controlled by the subcortical superior colliculus and the cortical frontal eye fields. Despite the frequency of the saccades, only a tiny fraction of the inputted information is processed
at higher brain centres and enters our perceptual awareness, as such, this attentional bottleneck is theorised to begin at the level of the V1, where the image is segregated into its individual features like orientation of lines and colour (7).

Figure 2. Red tulip surrounded by a field of yellow tulips (9).
Visual saliency seems to be the basis of how the fixation points of saccades are determined and is a bottom-up, stimulus-driven or task-independent response (10). Iso-feature suppression contributes to this saliency effect, where a singleton – an individual feature – contrasts the surrounding iso-features, thus escaping suppression (10–13). This is demonstrated in figure 2. In most cases, initially glancing at figure 2 will result in our attention being first drawn to the red tulip singleton due to its colour contrast with the yellow ones: in this image colour primary contributor to the salience of the tulip. Other
features can include luminance, motion or orientation. In a 2005 study, features were distinguished from fixated and non-fixated locations during the free viewing by participants (n=14) of grayscale natural images over time (14). Using a receiver operating characteristic curve (ROC), the study indicated that edges and contrast (63% at its highest) consistently
recorded a higher discriminatory strength compared to luminance and chromaticity (57% at its highest). However, by using contrast as a variable, the study does not account for the confounding factor of the interaction between variables, since contrast was comprised of all three other variables. As such, further investigation into the major contributing features to visually salient objects and fixation points should be undertaken with distinct classifications
of features.
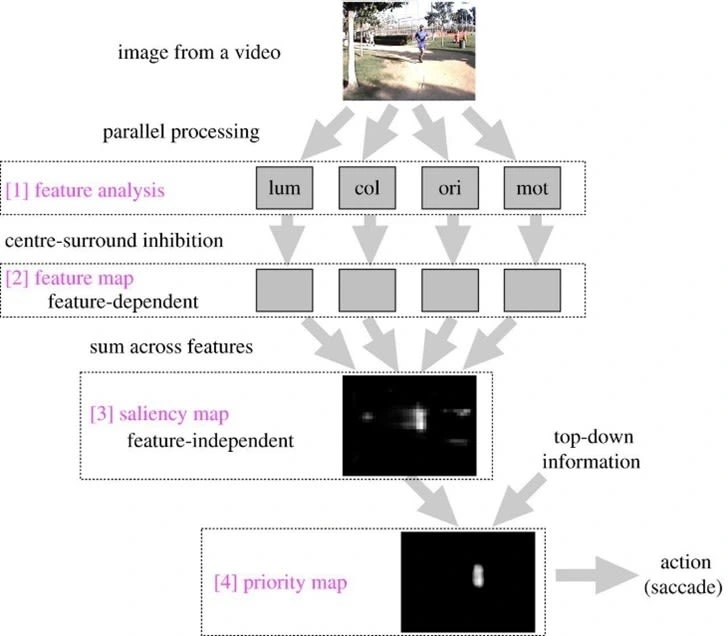
Figure 3. Overview of the Itti Saliency Model and the steps to how features of an image are
processed to produce a saliency and priority map (8).
Visual saliency is suggested to be represented by a topographical saliency map which computes each of the aforementioned features together to create a feature-agnostic map that is just concerned with the conspicuousness of an element rather than each individual feature (8). Computational models of the saliency map have been used to predict fixation points for saccades in an image. The saliency map was first proposed by researchers Koch and Ullman and further implemented by Itti et al., and as such, the model’s implementation is now referred to as the Itti saliency model (8,15). The first step of the Itti saliency model, as
depicted in Figure 3, is feature analysis, which includes parallel processing of each of the four feature stimuli, luminance, colour, orientation and motion. Centre surround inhibition emphasises the contrast of each of the features, translating onto a feature map. It is then summated into a saliency map, where the white area is determined as being the most salient in relation to the rest of the image. Top-down, goal-oriented, or task-dependent information is integrated with the saliency map to produce a priority map, thus, predicting the fixation
points of the saccades (8). As such, studies have suggested that fixation points are not solely reliant upon salient features, instead proposing that multiple maps exist and that the convergence of these bottom-up and top-down controlled maps create priority maps which determine fixation points (8,16).
Subsequent models aimed to improve the biological accuracy of the Itti saliency model by merging it with an existing model that implemented Leaky Integrate and Fire neurons (LIF), accounting for the leakage and capacitance of the neuronal membrane (17–19). Merging these models introduces the activation spread associated with the interconnected neural network and thus reduces the Itti saliency model’s tendency to underpredict fixation points (18). Accordingly, this model combines the most salient features of each object to produce an arbitrary saliency value; each object then competes for visual attention where the object with the highest saliency value is attended to, adopting a winner-takes-all approach (15–18). Each ‘winning’ location is ranked via their saliency value, hence creating a map of ranked locations. In contrast, the Graph-Based Visual Saliency Model (GBVS) is a mathematical model that has also been implemented, yielding “98% of the ROC area of a human-based control, whereas the classical algorithms of Itti & Koch achieve[d] only 84%” (20). The GBVS model implements a Markov chain on an image, inherently connecting one extracted feature to another, and each ‘connection’ is analysed in terms of relative dissimilarity. These connections are normalised, and the features are plotted on an equilibrium distribution, where the distribution is essentially treated as a scale for saliency values. As such, the higher-scoring features are translated onto a saliency map to predict for fixation points.
The saliency map has been theorized to originate in the superior colliculus in a study that suggested it pooled inputs from the V1 to create a feature-agnostic map and thus guide saccades to the salient features (21). However, many studies have disputed this theory
and instead propose the V1 as the origin of the saliency map (8,10,22,23). One such study investigates saccadic eye movements post V1 lesion in macaque monkeys with a particular focus on the extrageniculate pathway that bypasses the V1 and sends visual information directly to the superior colliculus, then to the pulvinar in the thalamus and higher
brain centres (24). It was hypothesised that the extrageniculate pathway directed the saccades, however this did not occur until after two months. During the two-month recovery period, saccades were ballistic compared to the control side without the V1 lesion; there was inaccurate control of the velocity and trajectory of the saccades in the lesioned side due to the lack of compensatory mechanisms exhibited by the intact side. Additionally, the decision threshold for saccade initiation in the lesioned side was significantly lowered in low contrast target detection tasks. In high contrast tasks, the reaction time of the saccades on both sides were fairly similar, while in low contrast, the intact side exhibited slower reaction times by the saccades whilst the lesioned side remained the same. As such, the study indicated that the extrageniculate pathway could not immediately compensate for the geniculo-striatal
pathway that sent information to the LGN then to the V1, further implying that the V1 contributes to the deliberate and accurate movement of the saccades.
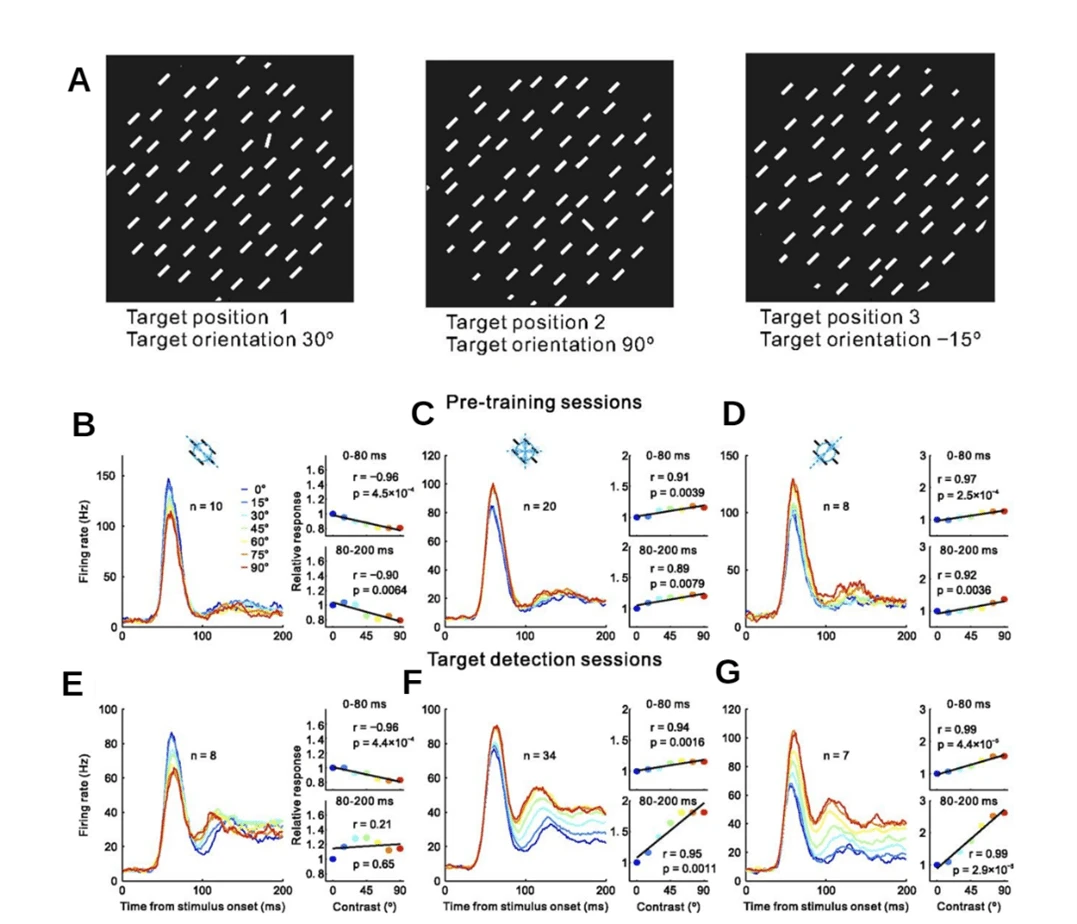
Figure 4. A) Target Detection Task consisting of one target bar randomly set at one of three possible locations at one in twelve possible orientations in relation to the distractor bars. B-G) Graphs depicting the firing rate over the duration of the test of 3 neuron populations tuned to 0⸰, 45⸰ and 90⸰ orientations relative to distractor bars in the target detection test. Graphs B, C and D depict pre-training responses and graph E, F and G depict post-training responses (10).
Subsequently, it is suggested that the saliency map is created in the V1, this is investigated in a 2017 study involving electrophysiological recordings of the V1 and a behavioural study during a target detection task in 2 macaque monkeys (10). The target detection task (Fig. 4A) consisted of short bars facing the same orientation with the target bar displaying slightly
different orientations ranging through being parallel to being perpendicular to the distractor bars with 15-degree increments. As such, the electrode arrays were positioned to detect 3 possible orientation columns that were tuned to detect orientations that were 0 degrees in relation to the distractor bars, 45 degrees and 90 degrees (Fig. 4B-G). Each neuron population had the highest firing rate that corresponded to its favoured orientation. Additionally, there is an increase in firing rate when comparing the late response of the V1 during pre-training (Fig. 4B-D) to that of post-training (Fig. 4E-G), whereas the early response remained similar. Thus, indicating that the early response of the V1 was stimulus driven while the late response was modified by learning processes and was most likely task-dependent, further suggesting that the V1 has a functional role in the saliency map in the brain.
Using visual saliency maps and eye-tracing technology has been suggested to be an accurate and low-cost early diagnostic or screening tool for neuropsychiatric disorders such as Autism Spectrum Disorder (ASD), Attention Deficit Hyperactivity Disorder (ADHD), Foetal Alcohol Spectrum Disorder (FASD) and Parkinson’s Disease (PD).
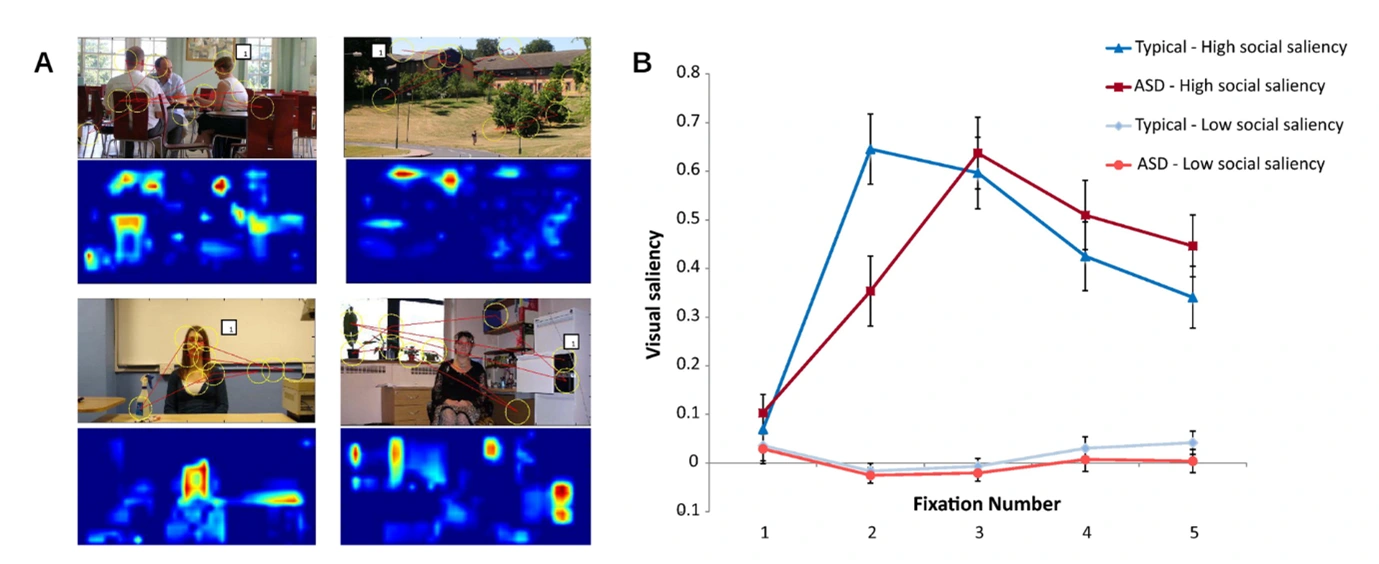
Figure 5. A) Images including socially salient features where predicted salient fixation points were illustrated through yellow circles. Saliency maps were derived from these images, where the most salient features were depicted in warm tones compared to the cool background. B) Graph depicting the visual saliency determined for the first 5 fixation points of individuals with ASD and individuals who developed typically (25).
A 2011 study consisted of deriving saliency maps from images and predicting fixation points;
eye-tracking technology was used on 24 individuals with ASD and 24 typically developed individuals whilst they viewed images (Fig 5A) (25). The results suggested that in low socially salient images, the saliency of the fixation points was relatively similar, while in high social salient images, typically developed individuals fixated socially salient features before individuals with ASD did (Fig 5B). This supports theories that individuals with ASD do not have a strong drive to rapidly attend to social information compared to typically developed
individuals and also supports the use of saliency models and eye-tracking to screen for ASD (26–28). Furthermore, a 2013 study used similar eye-tracking methods and free-viewing of videos to support the diagnosis of ADHD, FASD and PD (29). Through the tracking of their saliency-based fixation points, the study distinguishes children with ADHD and FASD from
controls, indicating they were more susceptible to bottom-up control. In comparison, individuals with PD were distinguished from elderly controls through the decreased amplitude and duration of their saccadic eye movements, indicating oculomotor deficits. As such, further implementations of the saliency computational model and eye-scans can allow us to learn more about the visual processing tendencies of individuals with neuropsychiatric disorders and further apply them as diagnostic or screening tools.
Overall, visual saliency is an integral way in which we perceive the world and through primate models we can better understand the underlying mechanisms and derive biologically accurate computational models. Through examining visual saliency, the attention mechanisms in our visual system are better understood, particularly in regard to the interaction and integration of top-down and bottom-up control pathways. However, there is a lack of substantial literature surrounding which visual features are major contributors to saliency and thus we propose investigating this as well as its neuronal representation in the V1.
PHY3990 Research Project
Aim: To investigate the representation of visual salience in the V1 during the free-viewing of natural images specifically which salient features contribute to the firing rate in receptive fields in the V1.
Hypothesis: It is hypothesized that the firing rate of neurons in the receptive fields of the V1 may have a positive correlation with increasing saliency of orientational features. Since ocular dominance columns are a prominent feature of the V1, it is hypothesized that neuron populations tuned to detect orientation will be the major contributing factor to the neuronal firing rates.
Methods: Behavioural and neural data has already been recorded from two adult male marmosets during a free-viewing task of 365 grayscale natural images. The behavioural data
included tracing the eye movements of the marmoset and creating saliency maps derived from the fixation points of the saccades and the GBVS computational model. The neural data was recorded through electrophysiology, using an N-form array consisting of an 8X8 grid of electrode shanks placed 400 microns apart in the primary visual cortex, and a spike rate density map was constructed. Data analysis will include analysing firing rates recorded from receptive fields of the V1 and their correlation with saliency features on the map using the MATLAB program.
References
1. John Seegers. The Human Visual System [Internet]. Laramy-K Optical. 2022 [cited 2022 Nov 30]. Available from: https://opticianworks.com/lesson/human-visual-system/.
2. Engel SA, Glover GH, Wandell BA. Retinotopic Organization in Human Visual Cortex and the Spatial Precision of Functional MRI. Cerebral Cortex [Internet]. 1997;7(2):181–92. Available from: http://white.stanford.edu.
3. Adams DL, Sincich LC, Horton JC. Complete pattern of ocular dominance columns in human primary visual cortex. Journal of Neuroscience. 2007 Sep 26;27(39):10391–403.
4. Hubel DH, Wiesel TN. Anatomical Demonstration of Columns in the Monkey Striate Cortex. Nature. 1969 Feb 22;221:747–50.
5. Yoshioka T, Dow BM. Color, orientati,on and cytochrome oxidase reactivity in areas V1, V2 and V4 of macaque monkey visual cortex. Vol. 76, Behavioural Brain Research. 1996.
6. Hebart MN, Hesselmann G. What visual information is processed in the human dorsal stream? Journal of Neuroscience. 2012 Jun 13;32(24):8107–9.
7. Zhaoping L. A new framework for understanding vision from the perspective of the primary visual cortex. Curr Opin Neurobiol. 2019 Oct 1;58:1–10.
8. Veale R, Hafed ZM, Yoshida M. How is visual salience computed in the brain? Insights from behaviour, neurobiology and modeling. Vol. 372, Philosophical Transactions of the Royal Society B: Biological Sciences. Royal Society; 2017.
9. Rupert Britton. The Stranger Amongst Us [Internet]. Netherlands: Unsplash; 2018 [cited 2022 Nov 30]. Available from: https://unsplash.com/photos/l37N7a1lL6w?utm_source=unsplash&utm_medium=referral&utm_content=creditShareLink.
10. Yan Y, Zhaoping L, Lia W. Bottom-up saliency and top-down learning in the primary visual cortex of monkeys. Proc Natl Acad Sci U S A. 2018 Oct 9;115(41):10499–504.
11. Rose D, Blakemore C. An Analysis of Orientation Selectivity in the Cat’s Visual Cortex. Vol. 20, Brain Res. Springer-Verlag; 1974.
12. Allman J, Miezin F, Mcguinness E. STIMULUS SPECIFIC RESPONSES FROM BEYOND THE CLASSICAL RECEPTIVE FIELD: Neurophysiological Mechanisms for Local-Global Comparisons in Visual Neurons. Annu Rev Neurosci [Internet]. 1985;8:407–30. Available from: www.annualreviews.org.
13. Li Z. Contextual influences in V1 as a basis for pop out and asymmetry in visual search [Internet]. Vol. 96, Psychology. 1999. Available from: www.pnas.org.
14. Tatler BW, Baddeley RJ, Gilchrist ID. Visual correlates of fixation selection: Effects of scale and time. Vision Res. 2005 Mar;45(5):643–59.
15. Itti L, Koch C. Computational Modelling of Visual Attention. Nat Rev Neurosci. 2001;2(3):194–203.
16. Fecteau JH, Munoz DP. Salience, relevance, and firing: a priority map for target selection. Vol. 10, Trends in Cognitive Sciences. 2006. p. 382–90.
17. Rajasekaran KA. Investigating Visual Salience in a Free-viewing Task of Natural Images.
18. Walther D, Koch C. Modeling attention to salient proto-objects. Neural Networks. 2006 Nov;19(9):1395–407.
19. Burkitt AN. A review of the integrate-and-fire neuron model: I. Homogeneous synaptic input. Biol Cybern. 2006 Jul;95(1):1–19.
20. Harel J, Koch C, Perona P. Graph-Based Visual Saliency. In: Advances in Neural Information Processing Systems. Cambridge: The MIT Press; 2007. p. 545–52.
21. White BJ, Kan JY, Levy R, Itti L, Munoz DP. Superior colliculus encodes visual saliency before the primary visual cortex. Proc Natl Acad Sci U S A. 2017 Aug 29;114(35):9451–6.
22. Zhang X, Zhaoping L, Zhou T, Fang F. Neural Activities in V1 Create a Bottom-Up Saliency Map. Neuron. 2012 Jan 12;73(1):183–92.
23. Li Z. A saliency map in primary visual cortex. Cogn Sci (Hauppauge). 2002;6(1):9–16.
24. Isa T, Yoshida M. Saccade control after V1 lesion revisited. Vol. 19, Current Opinion in Neurobiology. 2009. p. 608–14.
25. Freeth M, Foulsham T, Chapman P. The influence of visual saliency on fixation patterns in individuals with Autism Spectrum Disorders. Neuropsychologia. 2011 Jan;49(1):156–60.
26. Freeth M, Ropar D, Chapman P, Mitchell P. The eye gaze direction of an observed person can bias perception, memory, and
attention in adolescents with and without autism spectrum disorder. J Exp
Child Psychol. 2010 Jan;105(1–2):20–37.
27. Fletcher-Watson S, Leekam SR, Benson V, Frank MC, Findlay JM. Eye-movements reveal attention to social information in autism spectrum disorder. Neuropsychologia. 2009 Jan;47(1):248–57.
28. Lin IF, Shirama A, Kato N, Kashino M. The singular nature of auditory and visual scene analysis in autism. Philosophical Transactions of the Royal Society B: Biological Sciences. 2017 Feb
19;372(1714).
29. Tseng PH, Cameron IGM, Pari G, Reynolds JN, Munoz DP, Itti L. High-throughput classification of clinical populations from natural viewing eye movements. J Neurol. 2013 Jan;260(1):275–84.


