Building a Highly Interactive Dashboard
Jineshwar Khatri
Developed the analyzer dashboard for a supermarket nearby which provides complete real time analysis of the business. The analyzer contained following dashboards in it:
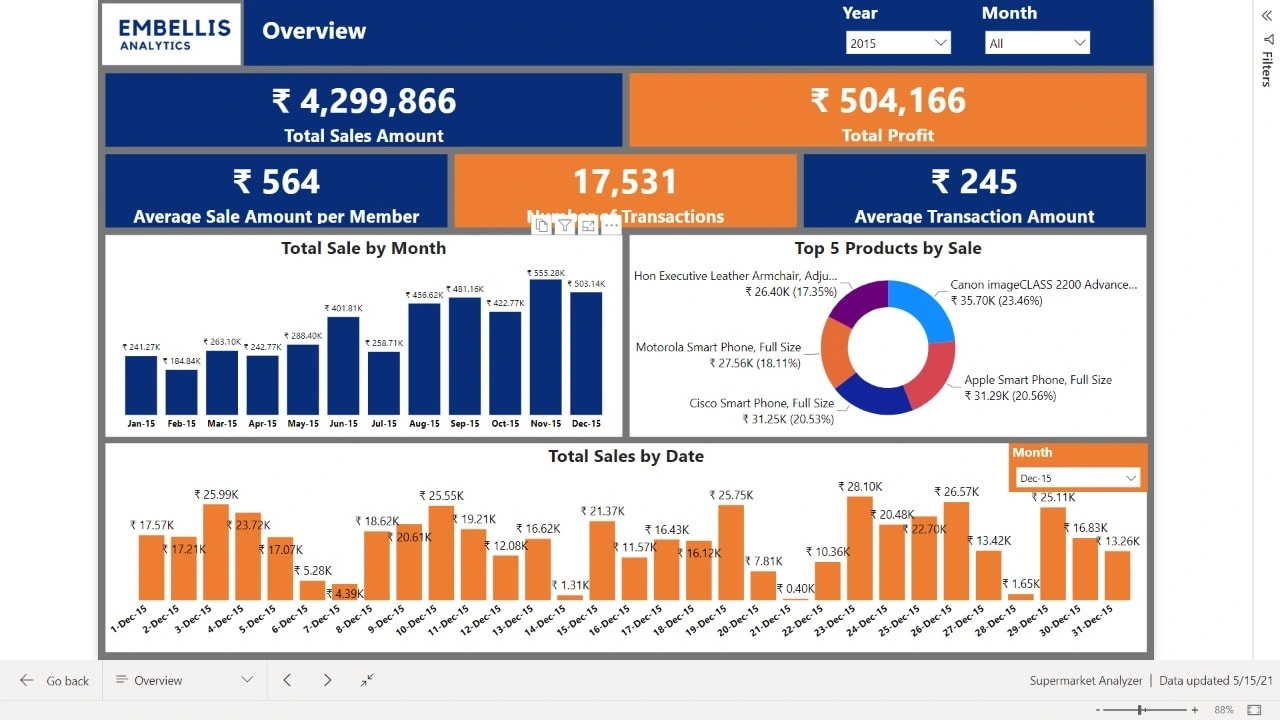
1. Overview - This contains metrics which depicts the overview like total sales, profit, #transactions, returns, avg ticket and mush more of ongoing business also with historical analysis.
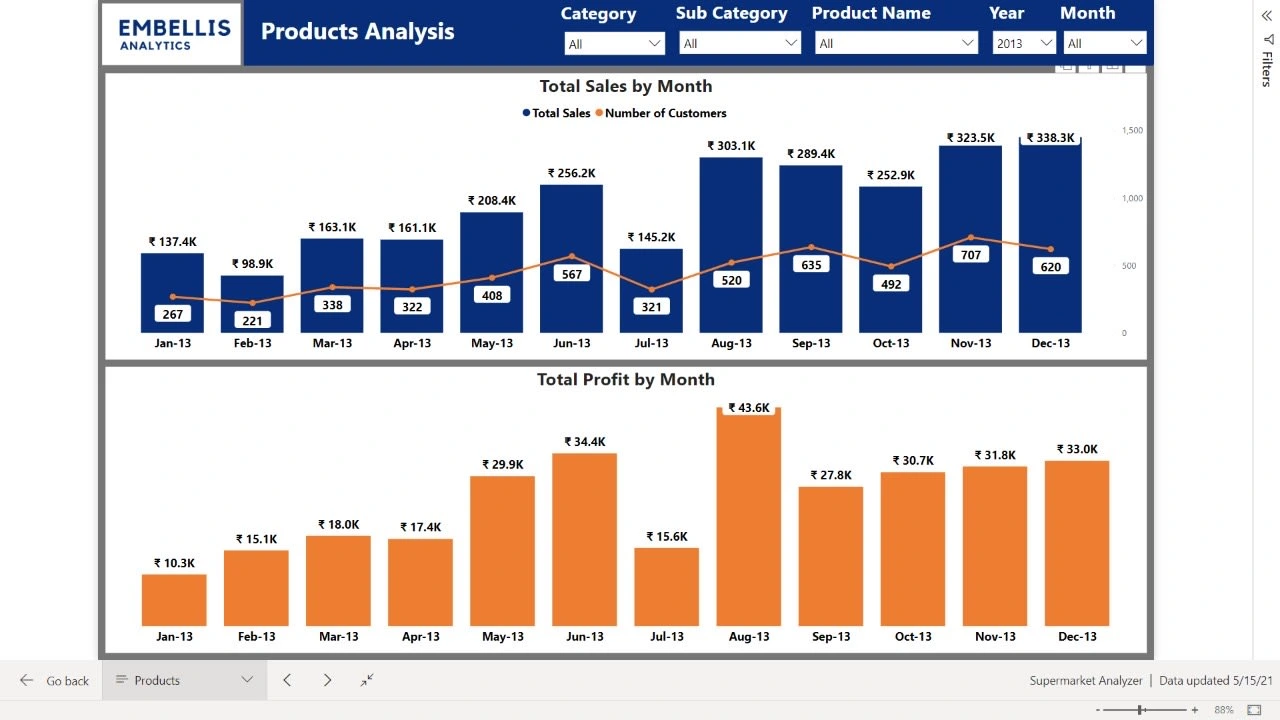
2. Product Analysis - This shows the detailed analysis by products which depicts how a particular product is performing in particular time frame with the segment of category and sub category.
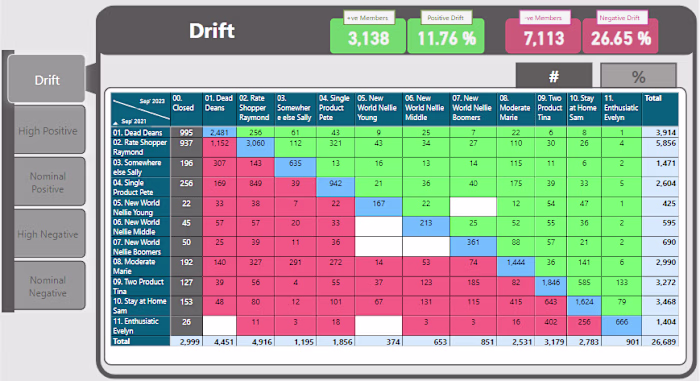
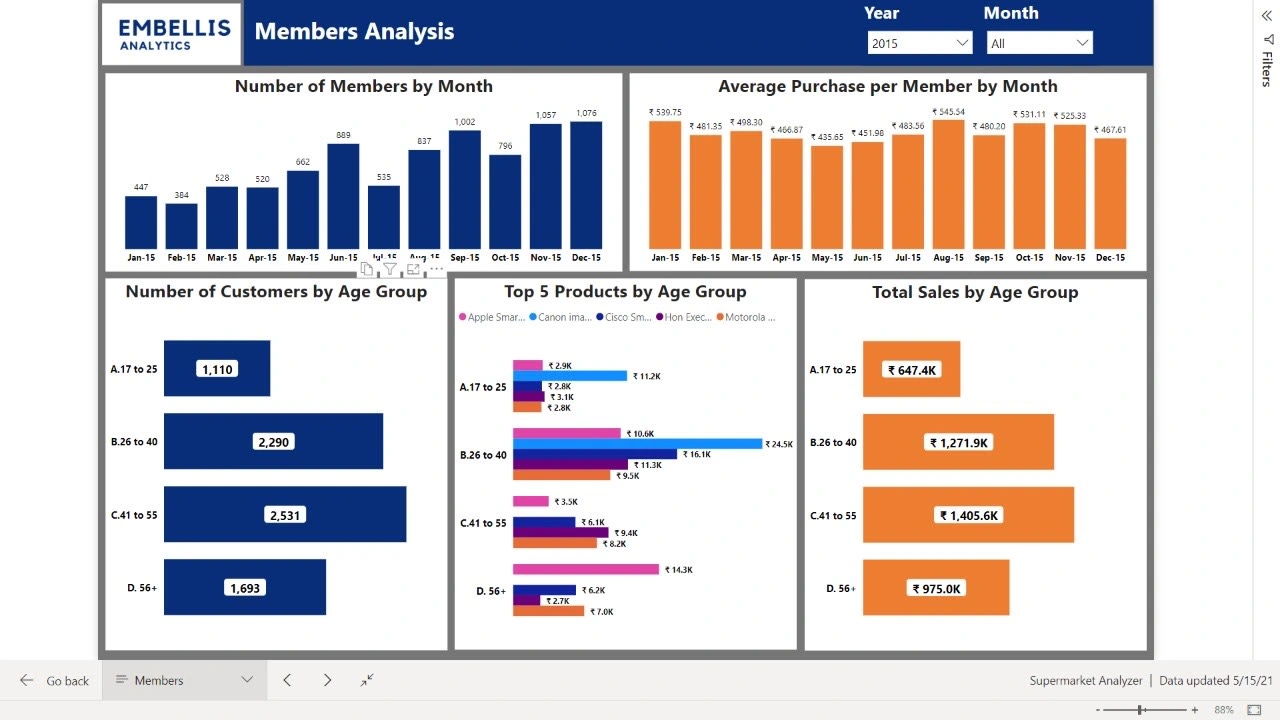
3. Member Analysis - This shows the complete analysis of customers which depicts information like how many customers transacted in a day/month, new customers joined, avg ticket of that customers, most favourable product of customers and much more.
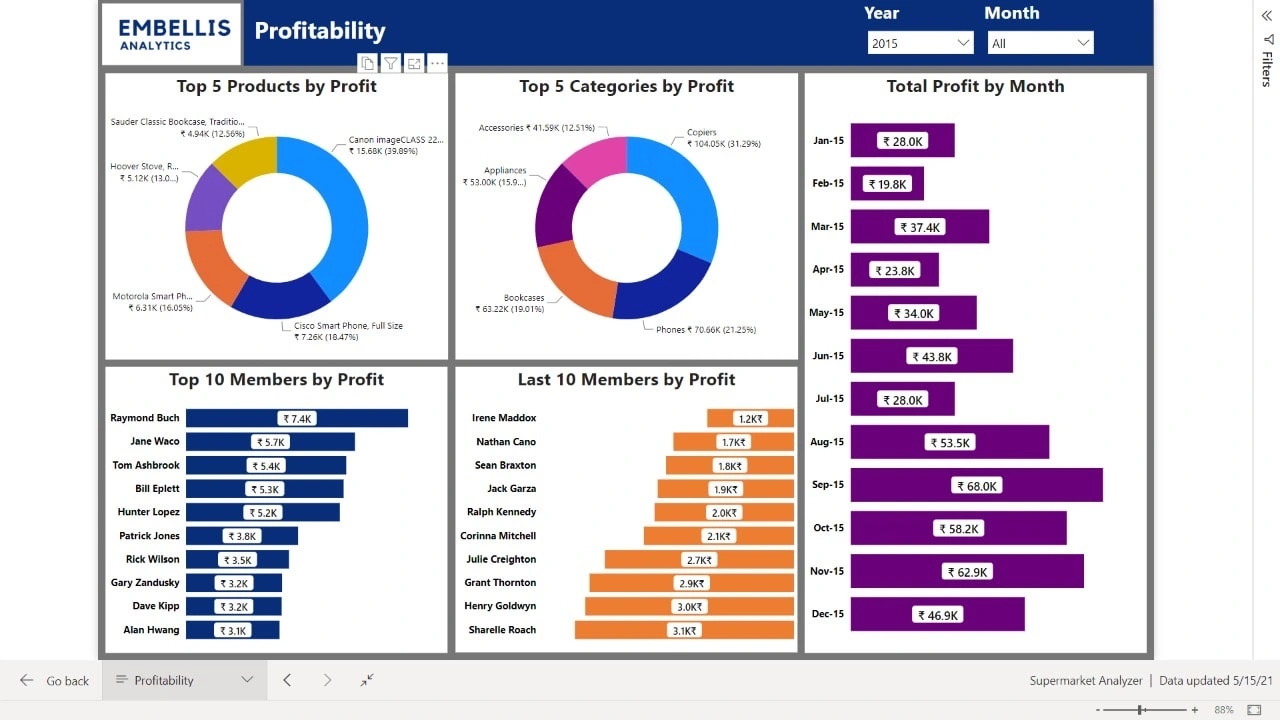
4. Profitability - This shows the metrics related to profit like profit by month, top products by profits, top customers by profit, bottom customers by profit, profitability demographics and so on.
Like this project
Posted Jan 3, 2024
Built highly interactive and insightful dashboard using Excel, SQL server and Power BI for a supermarket client.
Likes
0
Views
18