
The Challenge
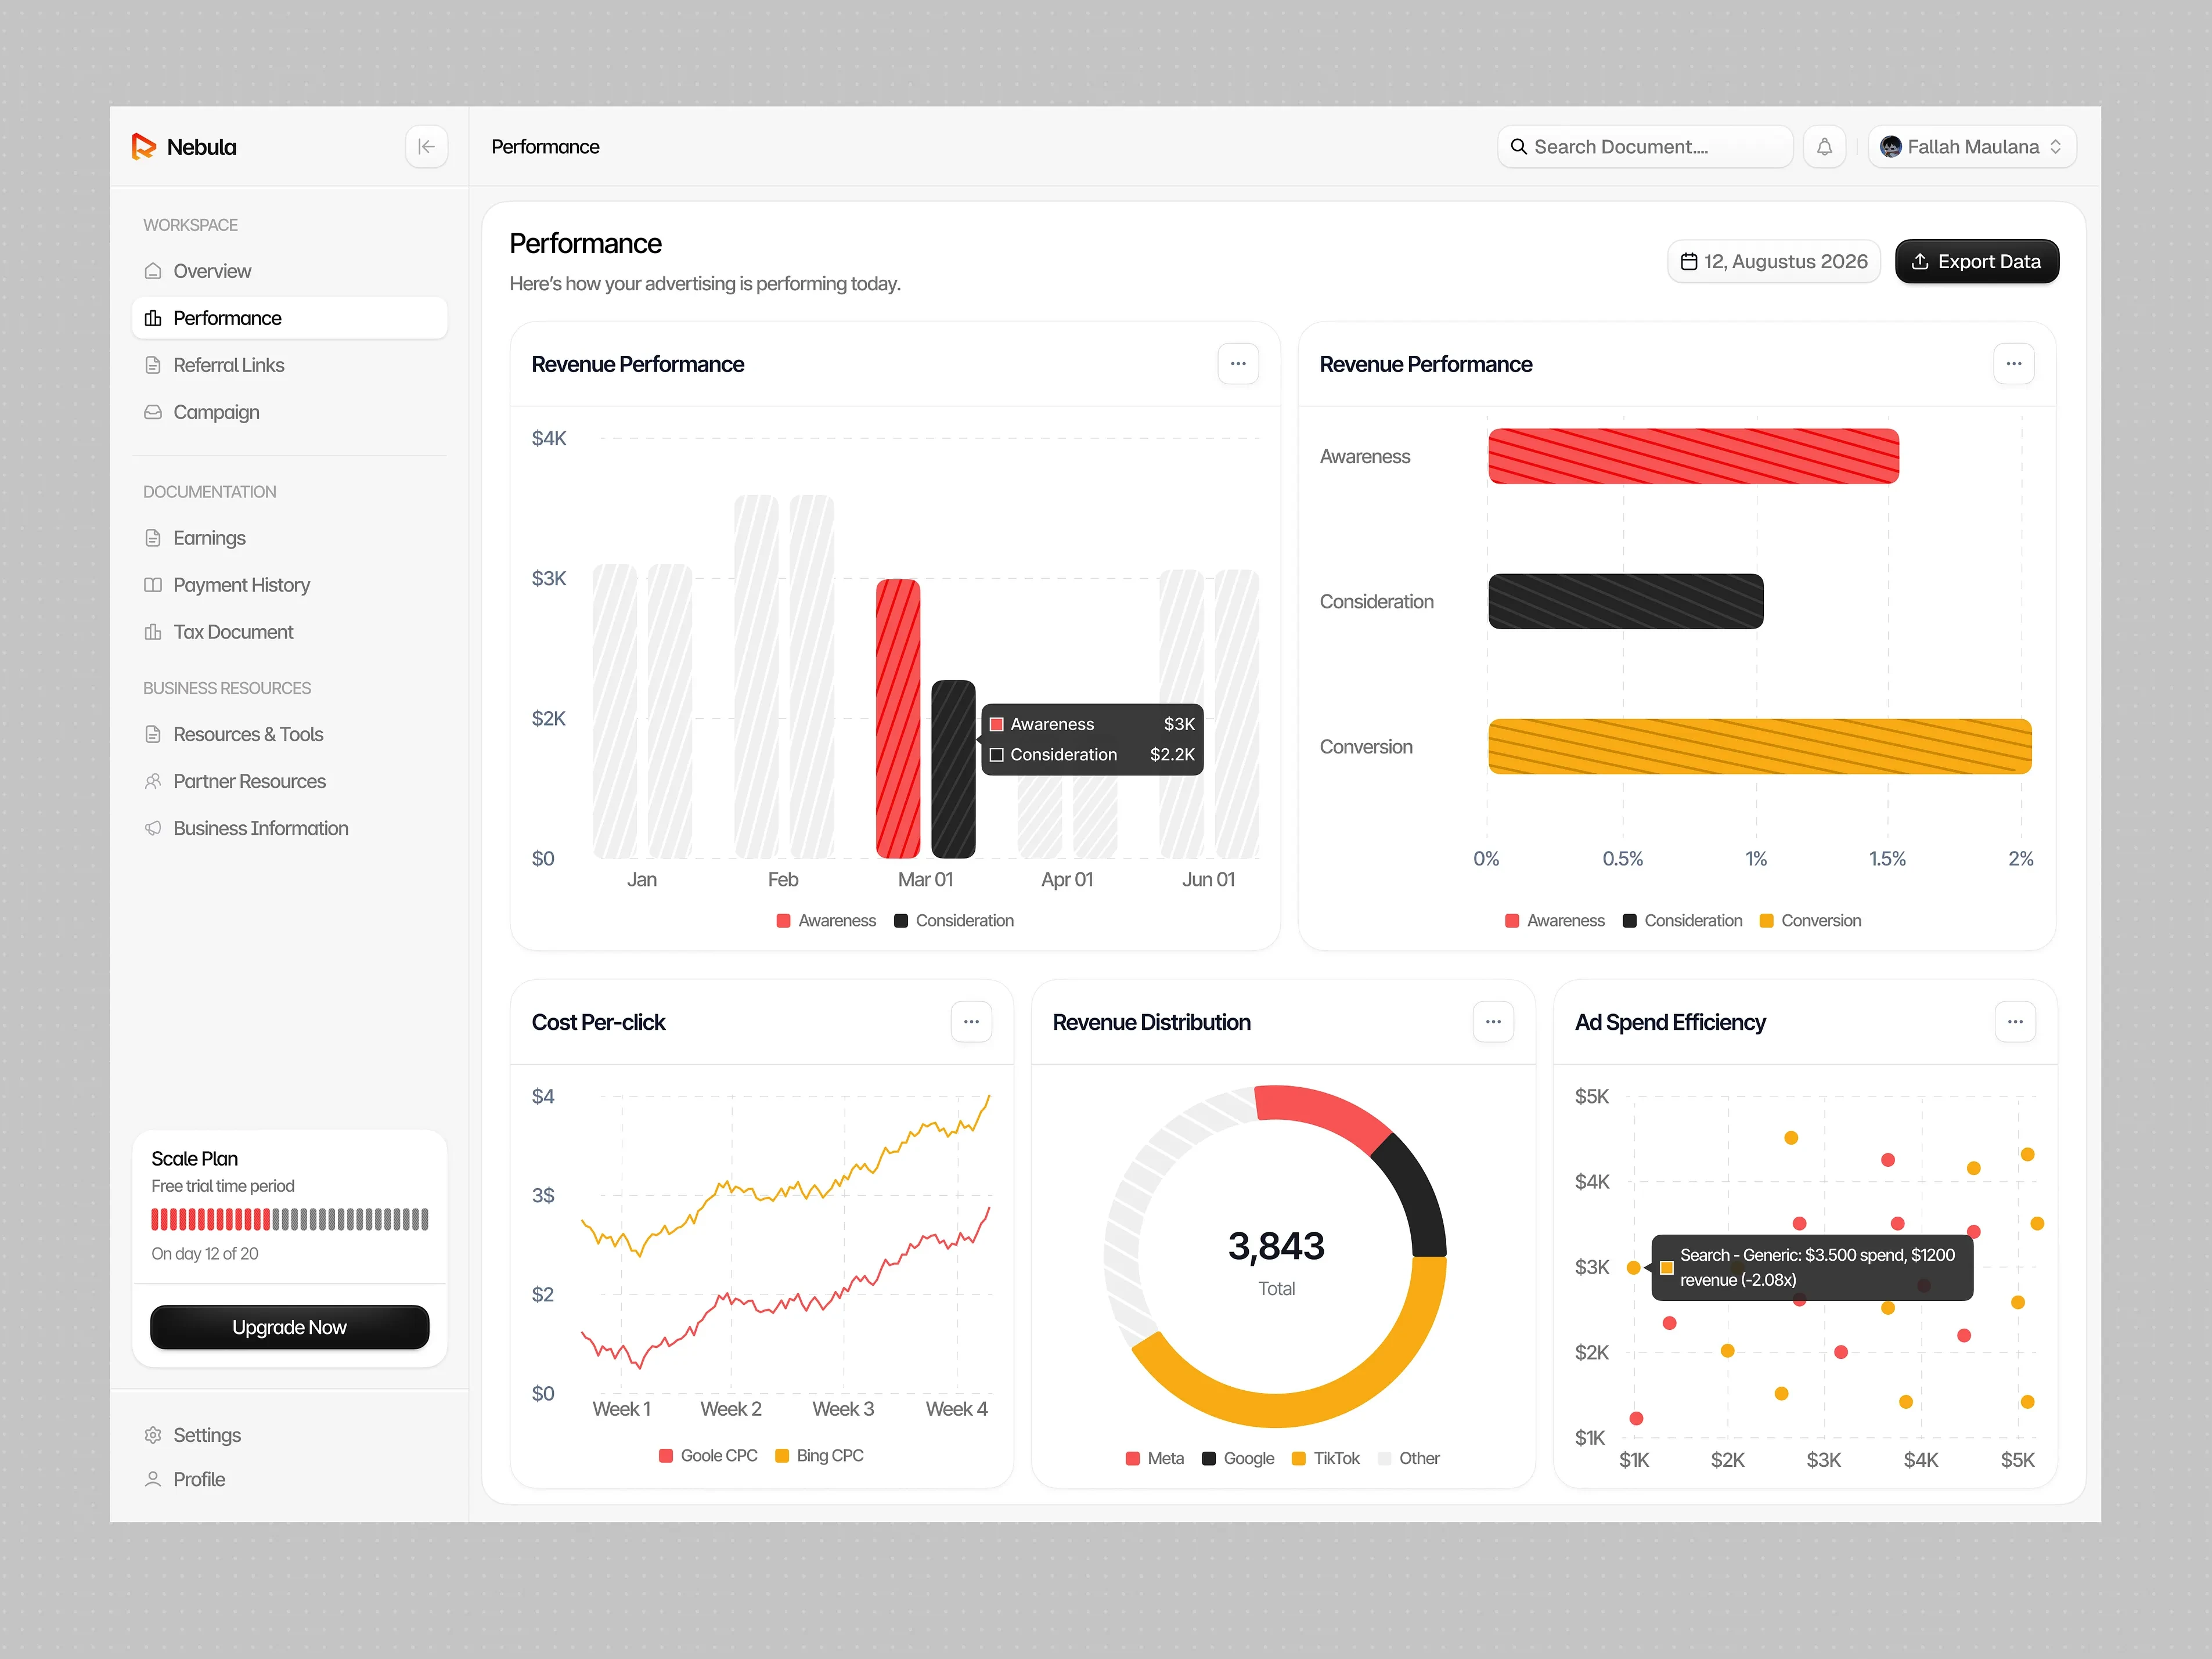
Marketing teams work with various campaign metrics and performance data that can be difficult to interpret when presented without a clear structure. Nebula aims to make this information easier to understand through an organized dashboard that brings essential marketing insights together in one place.
Our Approach
We focused on creating a structured analytics experience supported by clear data visualization and purposeful animation.
On the UI/UX design side:
Organized campaign metrics and performance data into a clear dashboard layout.
Established visual hierarchy to make important information easier to scan and understand.
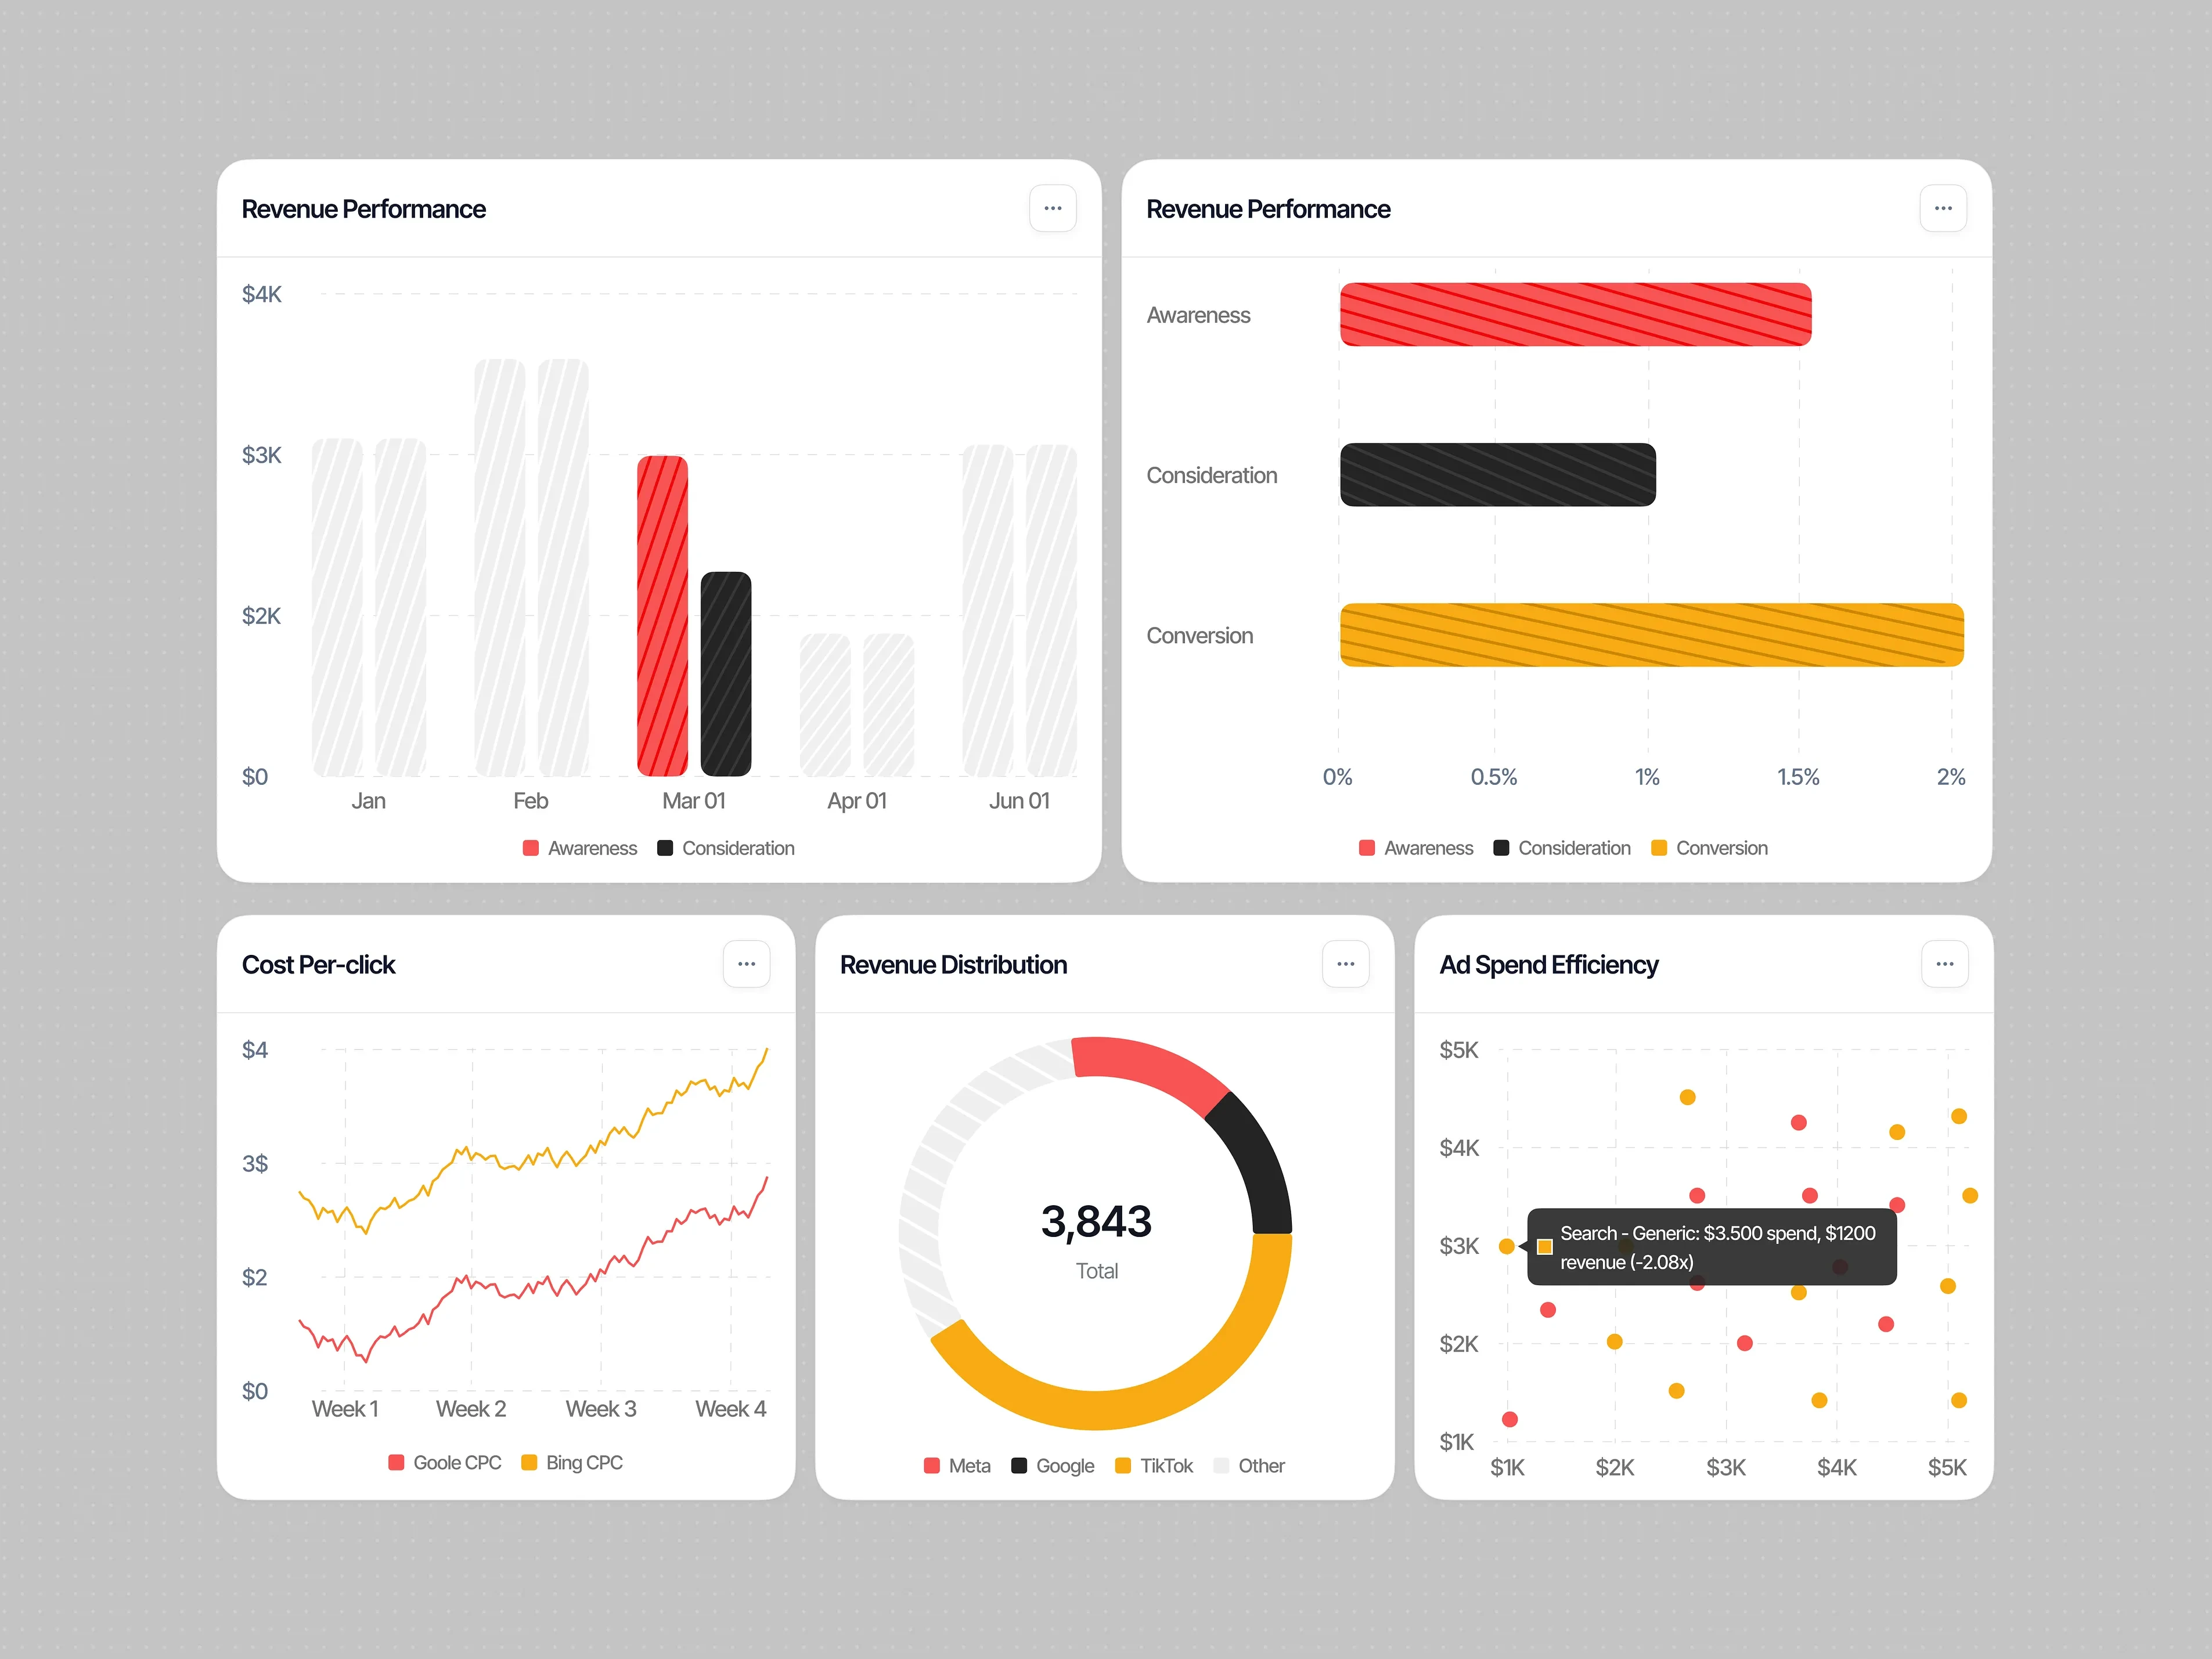
Used structured data sections and visual elements to present marketing performance more effectively.
On the visual design and animation side:
Created a refined dashboard aesthetic with a clean and consistent visual direction.
Used data visualizations to make campaign performance more accessible at a glance.
Added dynamic transitions and motion to bring metrics, charts, and performance insights to life.
The Result
The result is a modern marketing performance dashboard that makes campaign analytics easier to explore and understand. Through structured layouts, clear data visualization, and dynamic animation, Nebula turns complex marketing data into a more engaging and accessible dashboard experience.
0 likes · 1 view · Nov 18, 2026
Nebula is a marketing performance dashboard that transforms campaign data and analytics into clear insights through structured visualizations and dynamic animat


