InfoGraphics

Farook Maya


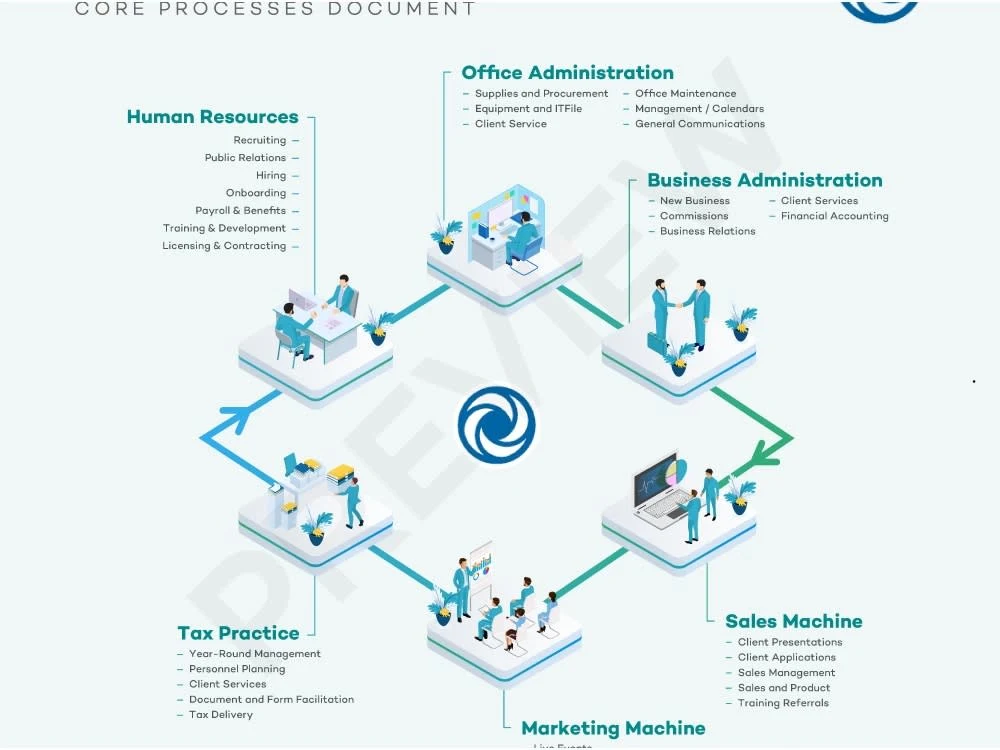
🔹 Infographic Design Process
Turning complex data into clear, engaging visuals.
Understanding the Goal
Every project starts with clarity. I begin by discussing the infographic's purpose, whether it's to educate, promote, report, or pitch. I gather the core content, understand the target audience, and identify the key message that needs to be communicated.
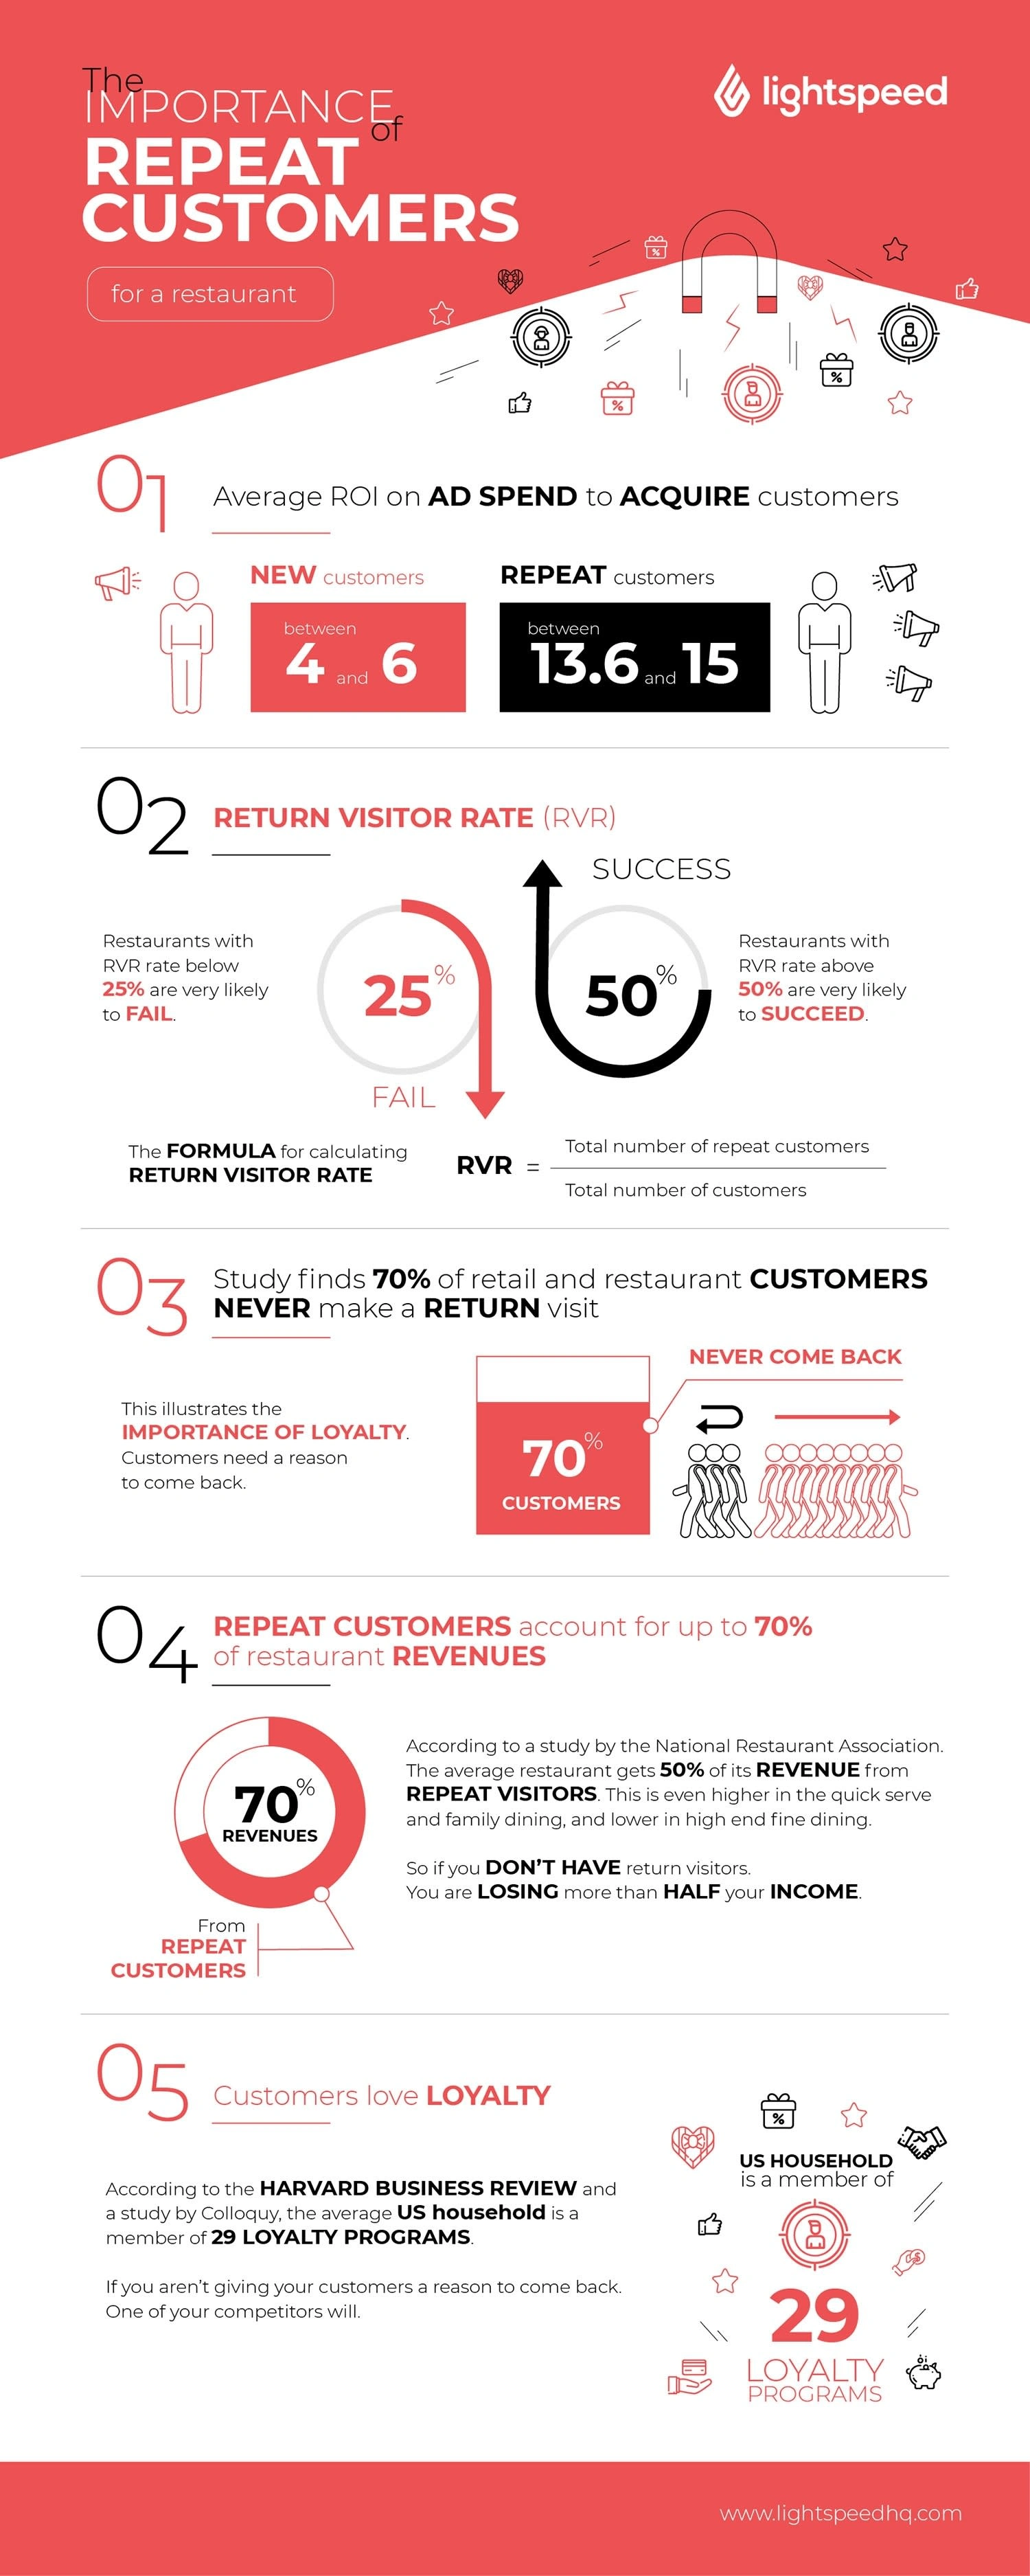
Content Structuring
Next, I break down the raw data or content into digestible sections. I identify the main points, supporting stats, and logical flow, ensuring the information is not only accurate but also easy to follow. This stage ensures that storytelling is at the heart of the design.
Wireframing & Layout Planning
Before diving into visuals, I create a wireframe or sketch that outlines the layout. This includes the title, sections, icons, callouts, and flow of information. This helps visualize the structure and gain early feedback on hierarchy and pacing.
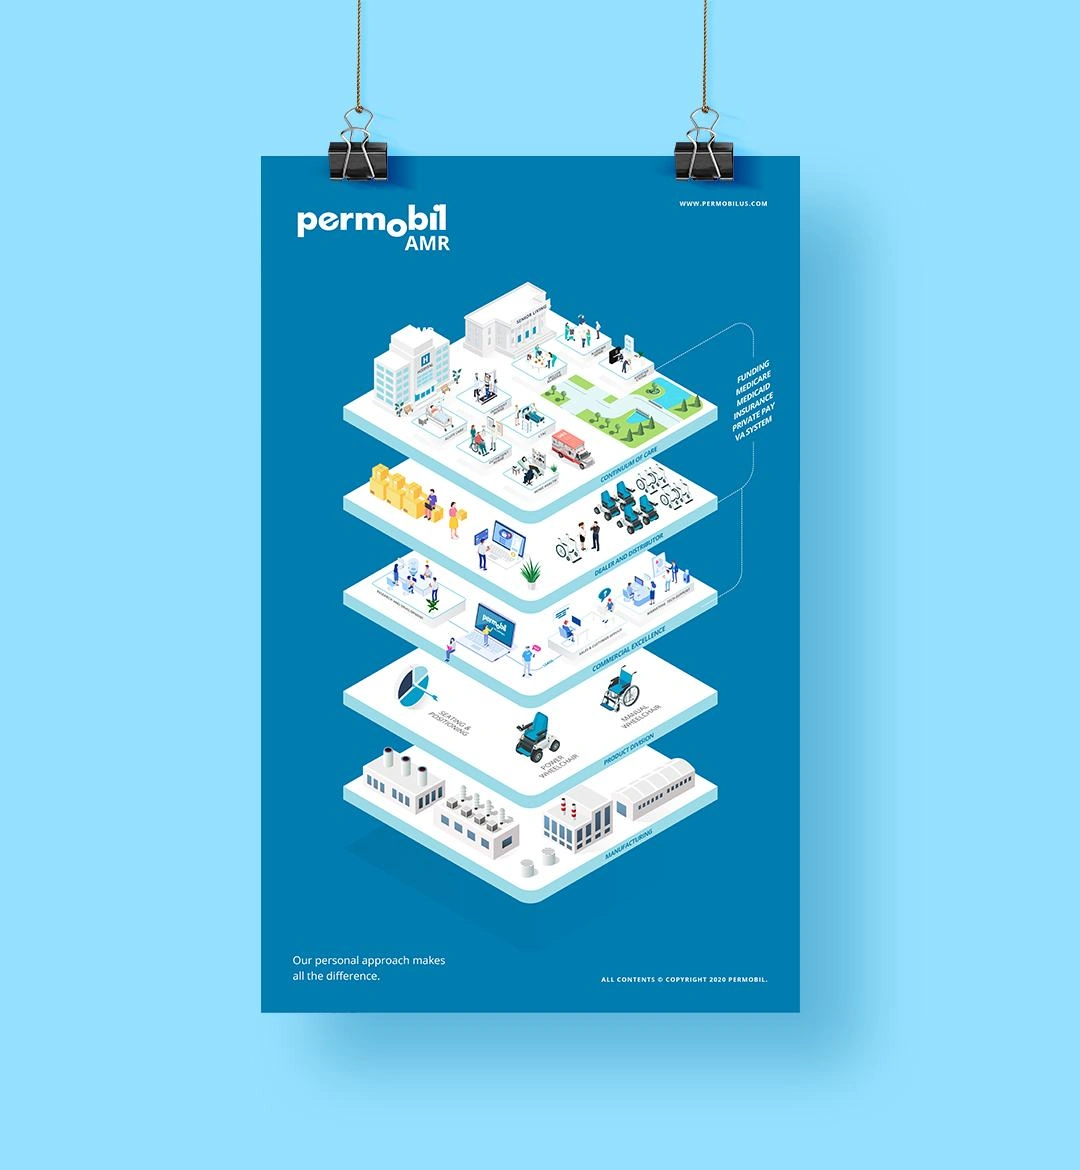
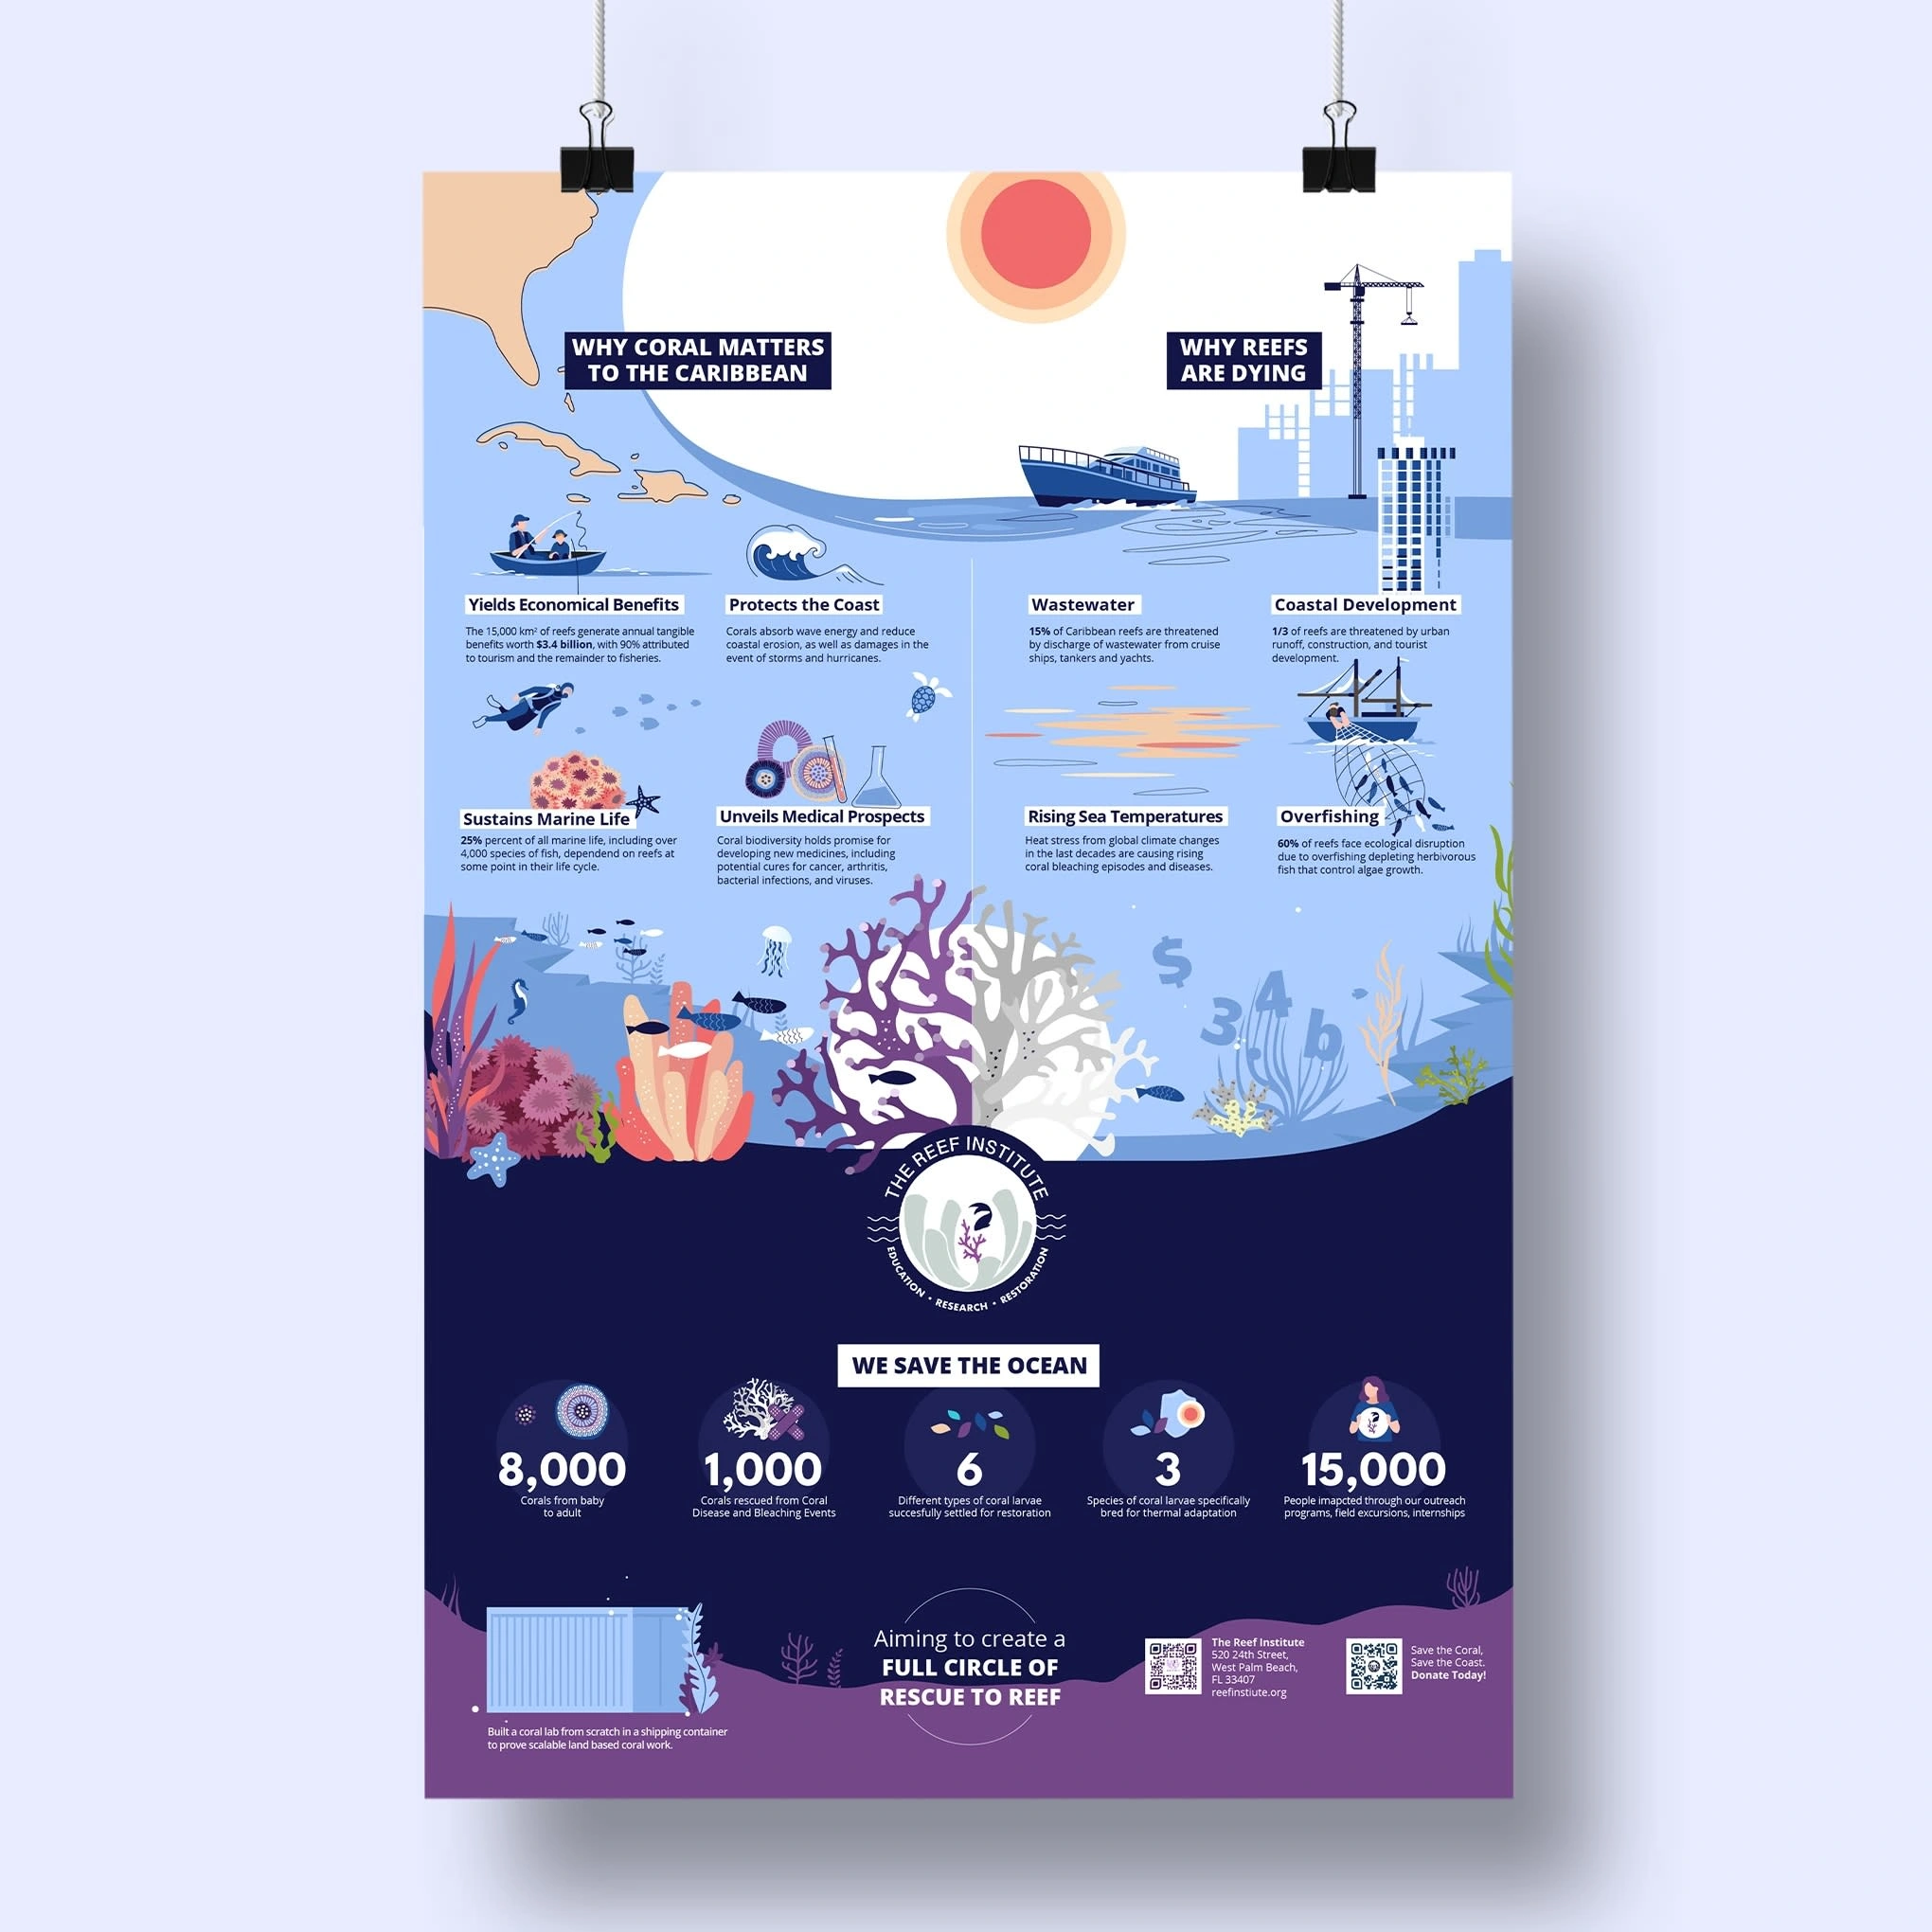
Visual Design & Branding
Using the approved wireframe, I move into high-fidelity design. I incorporate brand colors, fonts, custom icons, illustrations, and data visualizations (charts, graphs, etc.) to make the information visually appealing while maintaining consistency and clarity. The goal is to keep the reader engaged and informed.
Feedback & Revisions
I collaborate closely with the client to review the initial design and refine any areas that need improvement, be it wording, visuals, data accuracy, or layout. This step ensures the final infographic aligns with the client’s vision and audience expectations.
Final Delivery
Once approved, I deliver the infographic in multiple formats (PDF, PNG, SVG, etc.) optimized for both digital use (web, social media) and print (high-resolution CMYK if needed). I also provide scaled versions if needed for platforms like Instagram or LinkedIn.
Like this project
Posted Aug 20, 2024
Transform complex data into engaging, easy-to-understand visuals that captivate and inform, enhancing clarity and visual appeal for your brand’s message.