Development of Social LobbyMap Interactive Research Platform

Tomi Scattini


The App
Summary
Social LobbyMap is a data-driven research platform developed for the EIRIS Foundation to make corporate lobbying activity around human rights and ESG regulation easier to explore and understand.
The platform transforms a large research dataset covering companies and trade associations across different countries, sectors, policies, and assessment criteria into an accessible interactive web experience.
I developed the website through Chameleonic, the agency responsible for the project, working alongside a UX/UI designer. My role focused on the technical implementation of the platform, including a completely custom WordPress theme, the interactive SVG map and its JavaScript behavior, the research data interface, and individual company and trade association profiles.
Rather than building a conventional content-focused WordPress website, the project required turning WordPress into the foundation for an interactive data exploration tool.
Challenge / Requirements
The main technical challenge was presenting a complex research dataset in a way that allowed users to quickly understand and explore corporate lobbying activity.
The underlying data contains multiple dimensions: companies and trade associations, geographic regions, countries, industries, legislation, overall performance, relationship and organisation scores, and scores across individual research themes.
Presenting this information as static pages or conventional tables would make it difficult to understand patterns across the dataset.
The interface therefore needed to provide multiple ways of exploring the same underlying information while remaining connected to content managed through WordPress.
The main requirements included:
Develop the platform as a completely custom WordPress theme.
Transform research data into an interactive visual experience.
Build a custom world map without relying on an external mapping library.
Allow users to explore entities geographically.
Provide a detailed tabular view of the same underlying dataset.
Support filtering across regions, countries, sectors, entity types, legislation, and lobbying positions.
Keep map, table, filters, and underlying data synchronized.
Provide individual profiles for companies and trade associations.
Present multiple research scores and indicators in an understandable visual hierarchy.
Support a responsive experience across different screen sizes.
Integrate the interactive research functionality with conventional WordPress-managed pages and editorial content.
Implement the provided UX/UI designs accurately while adapting them to dynamic data.
Solution
Custom WordPress architecture
I developed Social LobbyMap as a custom WordPress theme rather than adapting an existing commercial theme.
WordPress provides the content-management foundation, while custom PHP templates and JavaScript implement the research-specific functionality of the platform.
This allowed conventional editorial content and highly structured research data to coexist within the same system while giving the frontend complete control over how that data is presented.
Interactive SVG world map
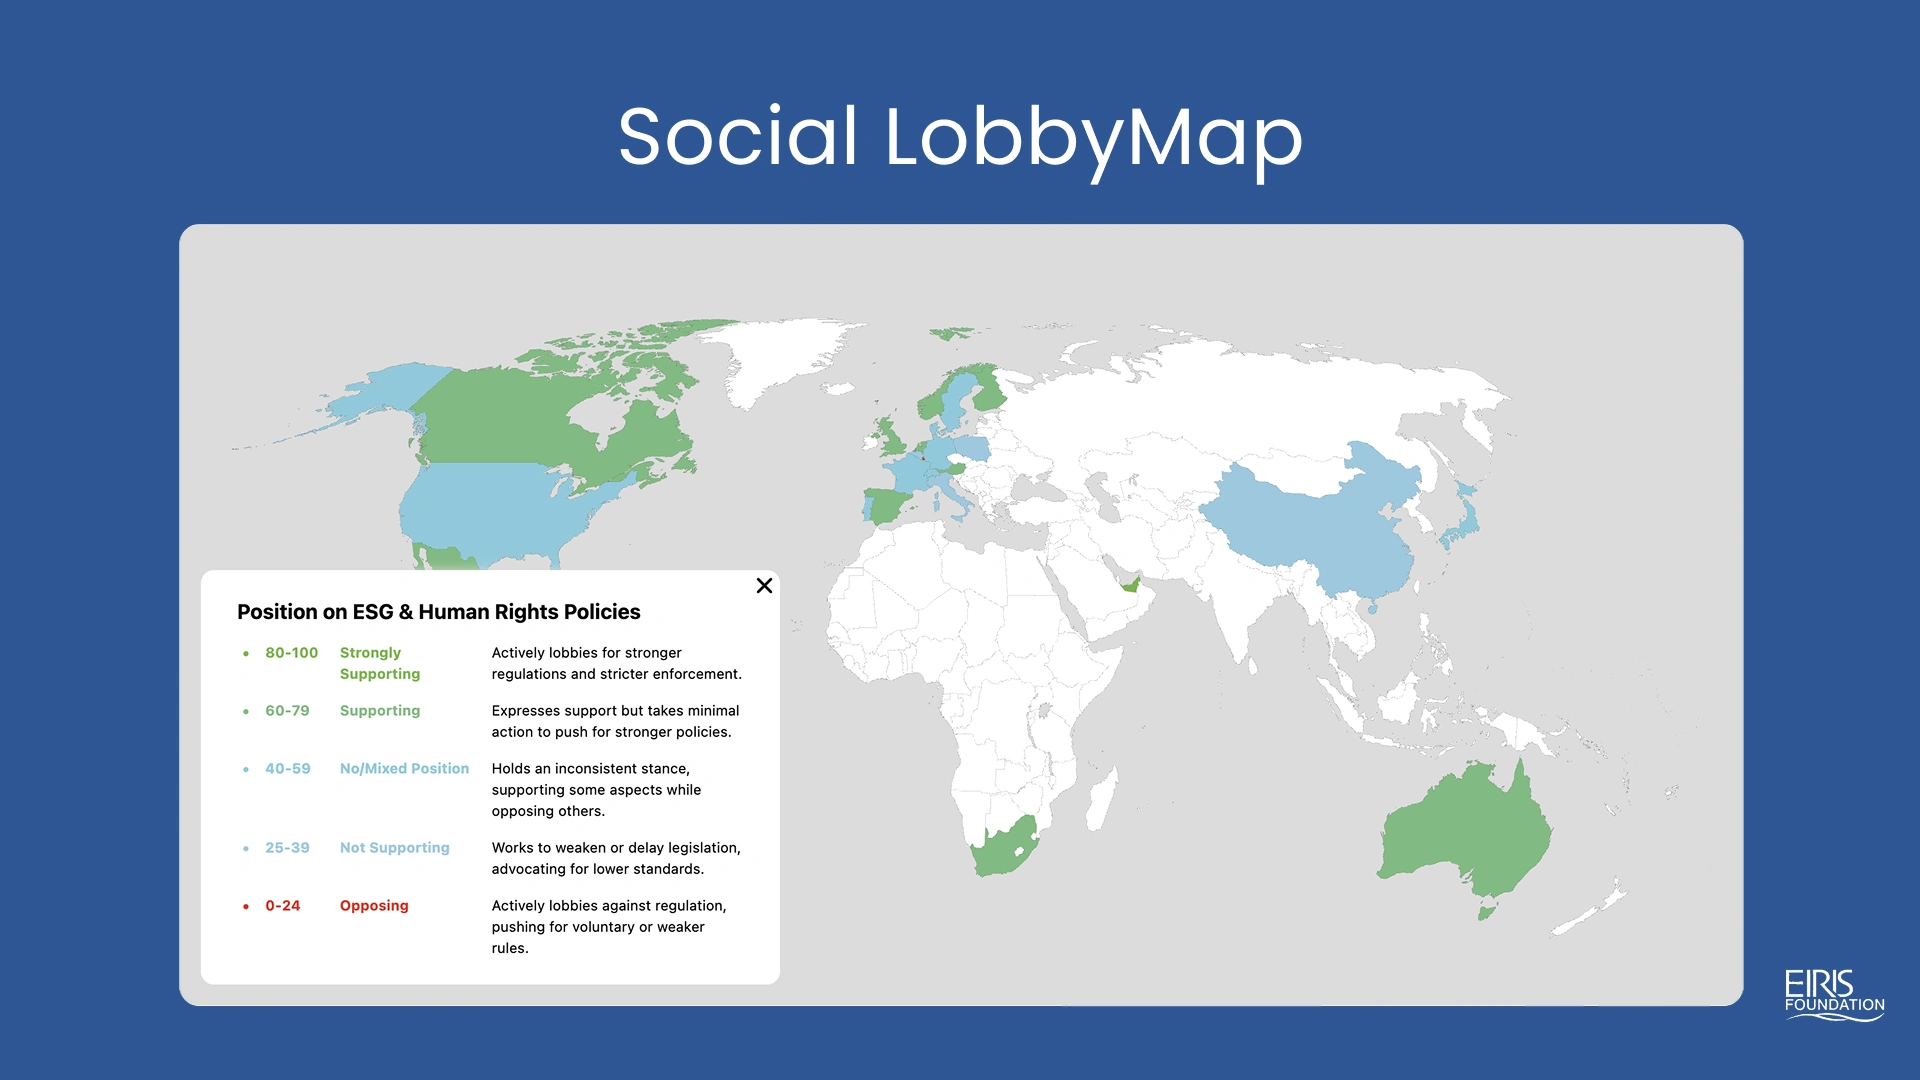
One of the central components of the platform is the interactive world map.
I implemented the map using a custom SVG and JavaScript rather than relying on Google Maps, Mapbox, or another external mapping solution.
Each relevant geographic area can participate directly in the interface, allowing the map to act as a visual navigation layer over the research dataset.
Custom JavaScript connects user interaction with the underlying data and filtering state, turning what would otherwise be a static SVG illustration into an interactive data visualization.
This approach provided precise control over the visual presentation and interaction behavior required by the UX/UI design without introducing the overhead or constraints of a general-purpose mapping library.
Research data explorer
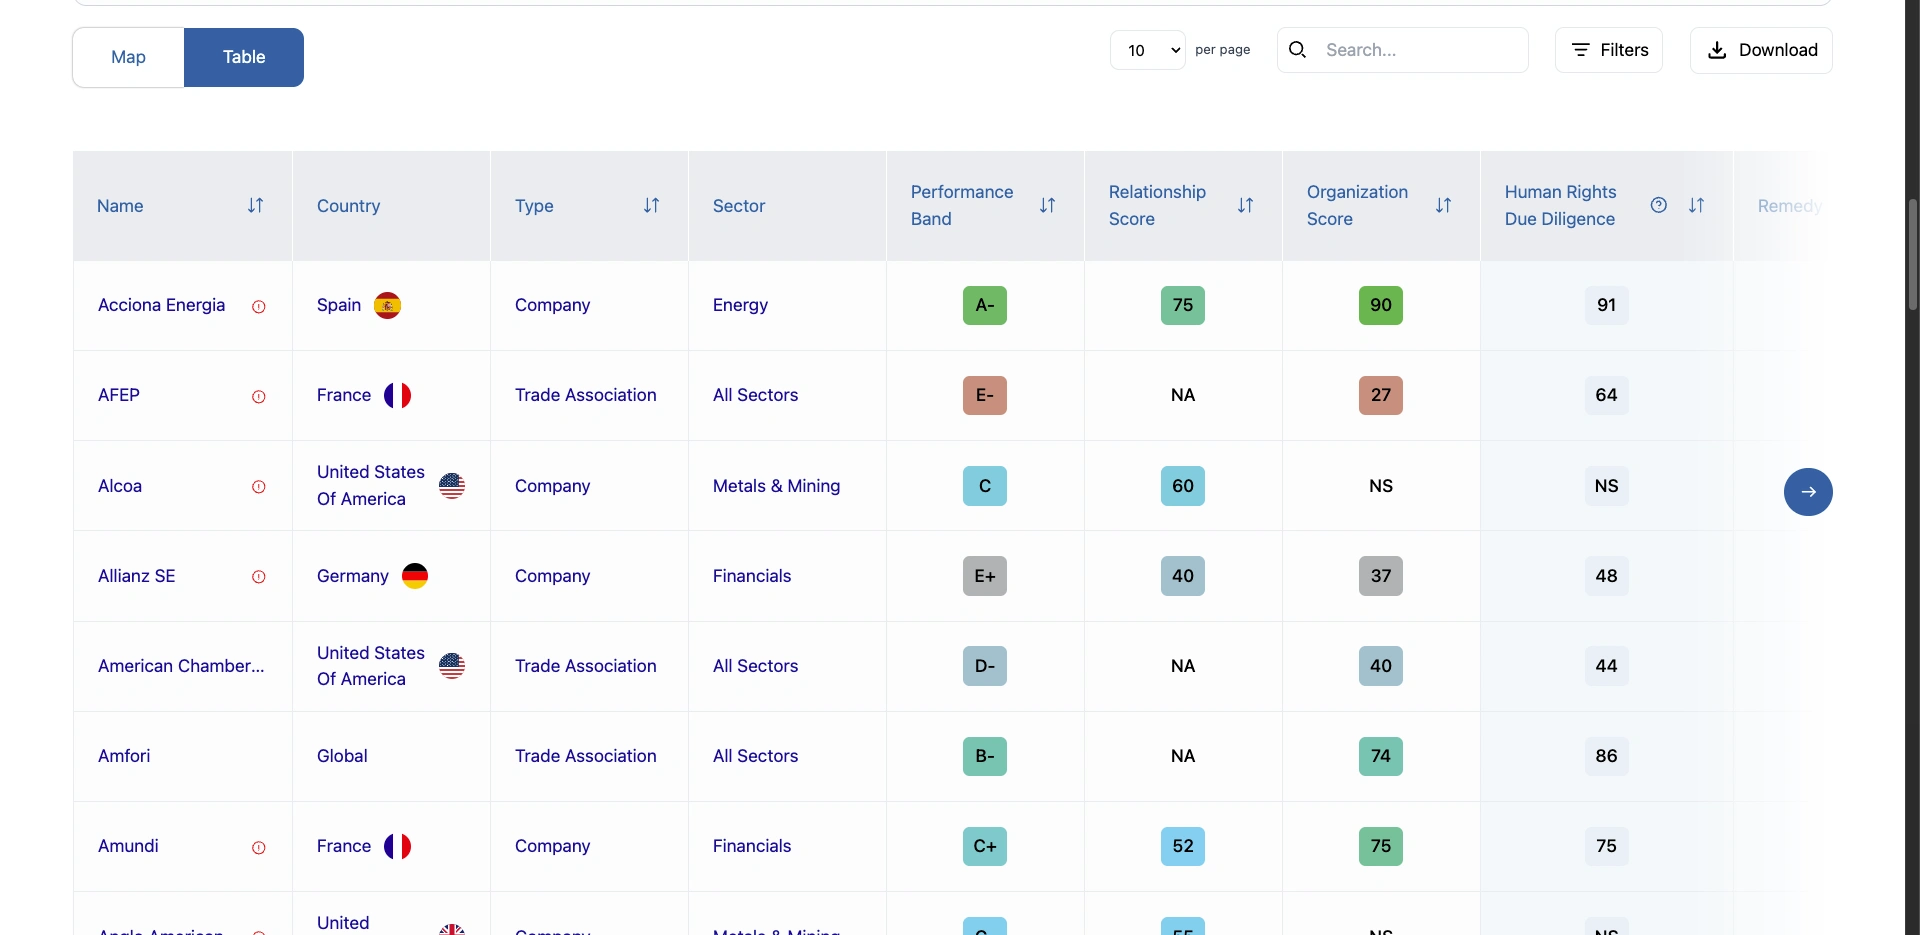
The map is complemented by a detailed table that provides another way of exploring the same research.
Users can search and filter the dataset across dimensions such as geographic location, entity type, sector, lobbying position, and legislation.
The table exposes additional research dimensions including performance bands, organisation scores, relationship scores, and individual assessment themes.
The key challenge was not simply displaying this information, but coordinating the different controls so users could progressively narrow a large dataset and move from high-level exploration to individual entities.
Company and trade association profiles
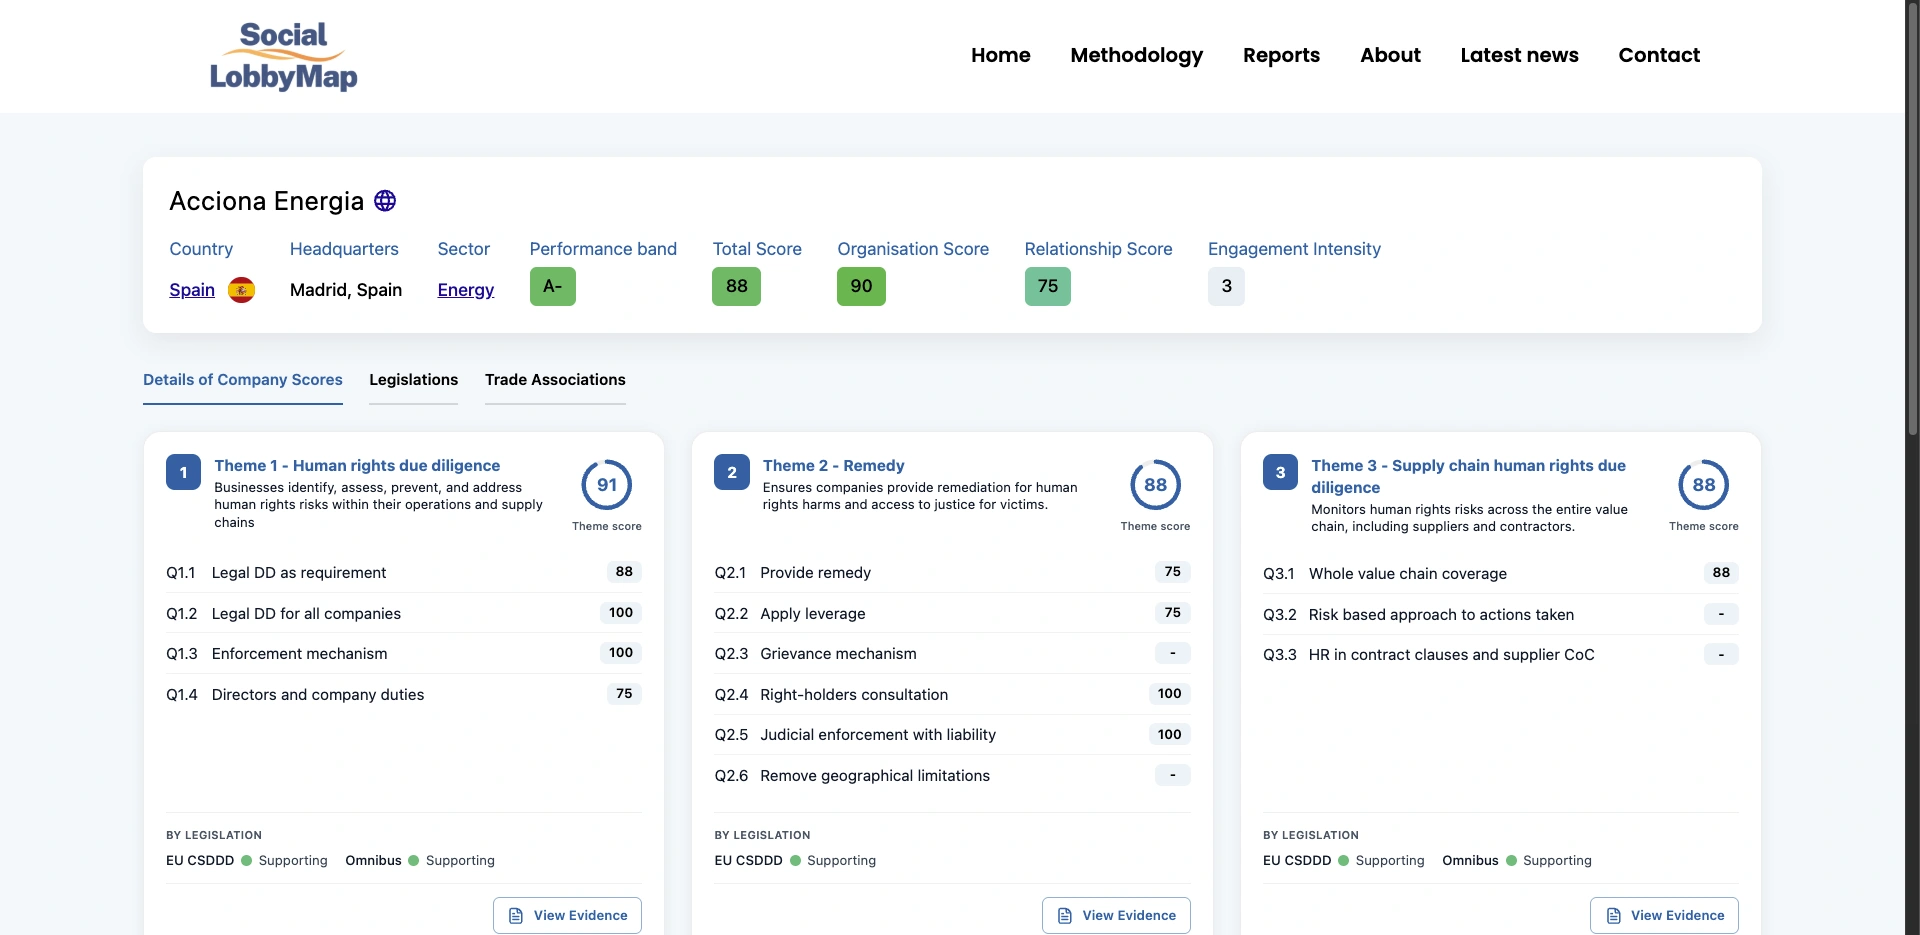
Each company or trade association has a dedicated profile where the research is presented in greater detail.'
I implemented the frontend templates responsible for transforming the underlying research data into a structured, user-friendly page rather than exposing users to raw database fields.
Scores, classifications, research themes, supporting information, and related metadata are organized into a visual hierarchy that allows users to move from an overall assessment into more granular research.
These pages reuse the same underlying data model as the map and table, providing a consistent path from discovering an entity to understanding the research behind its assessment.
Data-driven UI
A significant part of the frontend architecture involved translating research data into visual states.
Scores and classifications are not treated simply as text values. They influence how entities are represented throughout the interface, allowing users to visually distinguish different lobbying positions and performance levels.
The resulting interface creates several representations of the same dataset:
Research data → Map → Table → Entity profile
Each representation serves a different purpose while remaining connected to the same underlying content.
UX/UI implementation
The platform was developed through Chameleonic as part of an interdisciplinary project that included UX/UI design.
My responsibility was translating those designs into a functional WordPress application while accounting for dynamic data, responsive behavior, filtering logic, SVG interaction, and the constraints of the CMS.
This required close coordination between design and development, particularly around the map and research interfaces where visual decisions were directly connected to application behavior.
Impact
Social LobbyMap transformed the EIRIS Foundation's research from a complex dataset into a public-facing exploration tool.
Instead of requiring users to interpret spreadsheets or static reports, the platform provides several levels of interaction: geographic exploration through the map, detailed analysis through the table and filters, and deeper investigation through individual entity profiles.
The custom SVG implementation also avoided dependency on an external mapping platform while providing complete control over how geographic data is represented and interacted with.
From an engineering perspective, the project went significantly beyond conventional WordPress development. It combined custom theme development, PHP, structured research data, SVG manipulation, JavaScript interaction, filtering, responsive UI, and data visualization within a single CMS-driven platform.
The project gave me experience translating a complex research methodology into an interactive frontend while working as part of the Chameleonic team alongside UX/UI design.
Skills
WordPress
WordPress
PHP
Custom Theme Development
Custom Templates
CMS Architecture Frontend
JavaScript
HTML
CSS
Responsive Web Development
UX/UI Implementation Data Visualization
SVG
Interactive Maps
Custom JavaScript Interactions
Data-driven UI
Filtering & Search
Tabular Data Presentation Application Development
Structured Data
Dynamic Filtering
Entity Profiles
Data Presentation
Frontend Architecture Collaboration
Agency Development
UX/UI Collaboration
Design Implementation
Like this project
Posted Sep 2, 2026
Developed an interactive research platform for exploring corporate lobbying activities using custom WordPress architecture.
Likes
1
Views
9
Timeline
Jun 1, 2025 - Jun 1, 2025