Modern Dashboard UI for Smarter Decisions
Urvik Moradiya
1 collaborator
🧩 Project Title: SplitEdge Sales Dashboard
Overview:
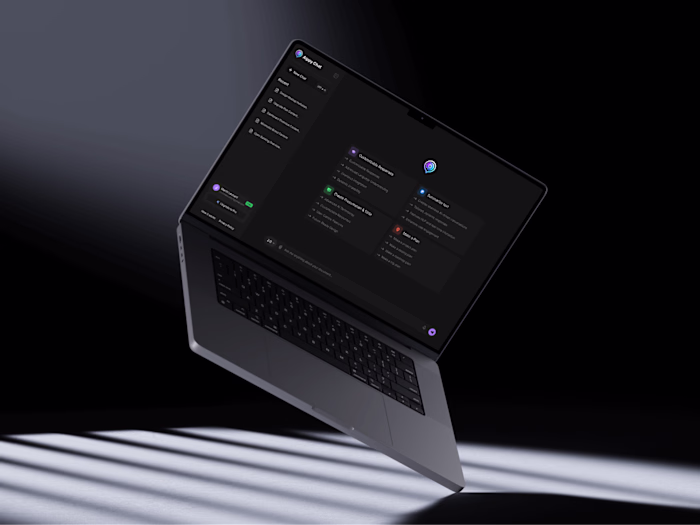
Designed a modern, data-centric dashboard interface for SplitEdge — a platform helping eCommerce businesses track product sales, customer behavior, and performance KPIs in real-time. The goal was to create a clean, intuitive, and visually engaging experience for sales managers and business owners.
🔍 Problem
Sales and performance data were scattered across tools, causing delays in decision-making and poor visibility into business health. The client needed a centralized dashboard with a smooth, responsive interface and meaningful insights at a glance.
🎯 Goals
Display key performance metrics like sales, revenue, and top products clearly
Allow users to quickly drill down into details with minimal clicks
Maintain brand consistency with a calm and minimal green-themed palette
Make data trends easily scannable with visuals like graphs and progress indicators
✨ Features
Product Overview: Quick snapshot of monthly earnings
Active Sales Widget: Trendline chart to compare month-on-month performance
Product Revenue: Ring-style performance indicator showing revenue growth
Sales Performance Gauge: Real-time percentage update since yesterday
Top Products Table: Breakdown of product sales, stock status, and revenue
Heatmap Calendar: Sales activity mapped across the week
Left-Side Navigation: Organized by function — Product, Orders, Customers, Analytics, etc.
Dark/Light Mode Toggle & Export Button: Modern dashboard essentials
"Add Widget" Flexibility: Future scalability for custom modules
🛠 Tools Used
Figma | Webflow (for prototyping) | Notion (for research & wireframes)
🎨 Design Approach
The UI follows a card-based modular design system for clarity and reusability. Light green tones provide a calming but professional feel, ideal for high-focus environments. Used whitespace effectively to avoid data overload and enhance scannability.
👨💻 Role
Led the UX research, UI design, and prototype testing end-to-end.
💬 Result
Improved clarity of key metrics and reduced dashboard navigation time by 45%. Users reported feeling more in control of their sales pipeline within just one week of use.

Like this project
Posted Jun 19, 2025
Designed a modern dashboard UI for SplitEdge to enhance business analytics.