OpsFlow — Bilingual CSV-to-KPI Operations Dashboard

KIM GEONHEE


About this work
Self-initiated B2B portfolio demo, not a client commission. Every company, campaign and revenue figure on screen is fictional.
Challenge
Operations teams pull CSV and spreadsheet exports out of several systems and paste them into a weekly report by hand. The errors that matter — a missing owner, a duplicate ID, a refund rate over threshold — surface after the numbers have already been circulated.
Approach
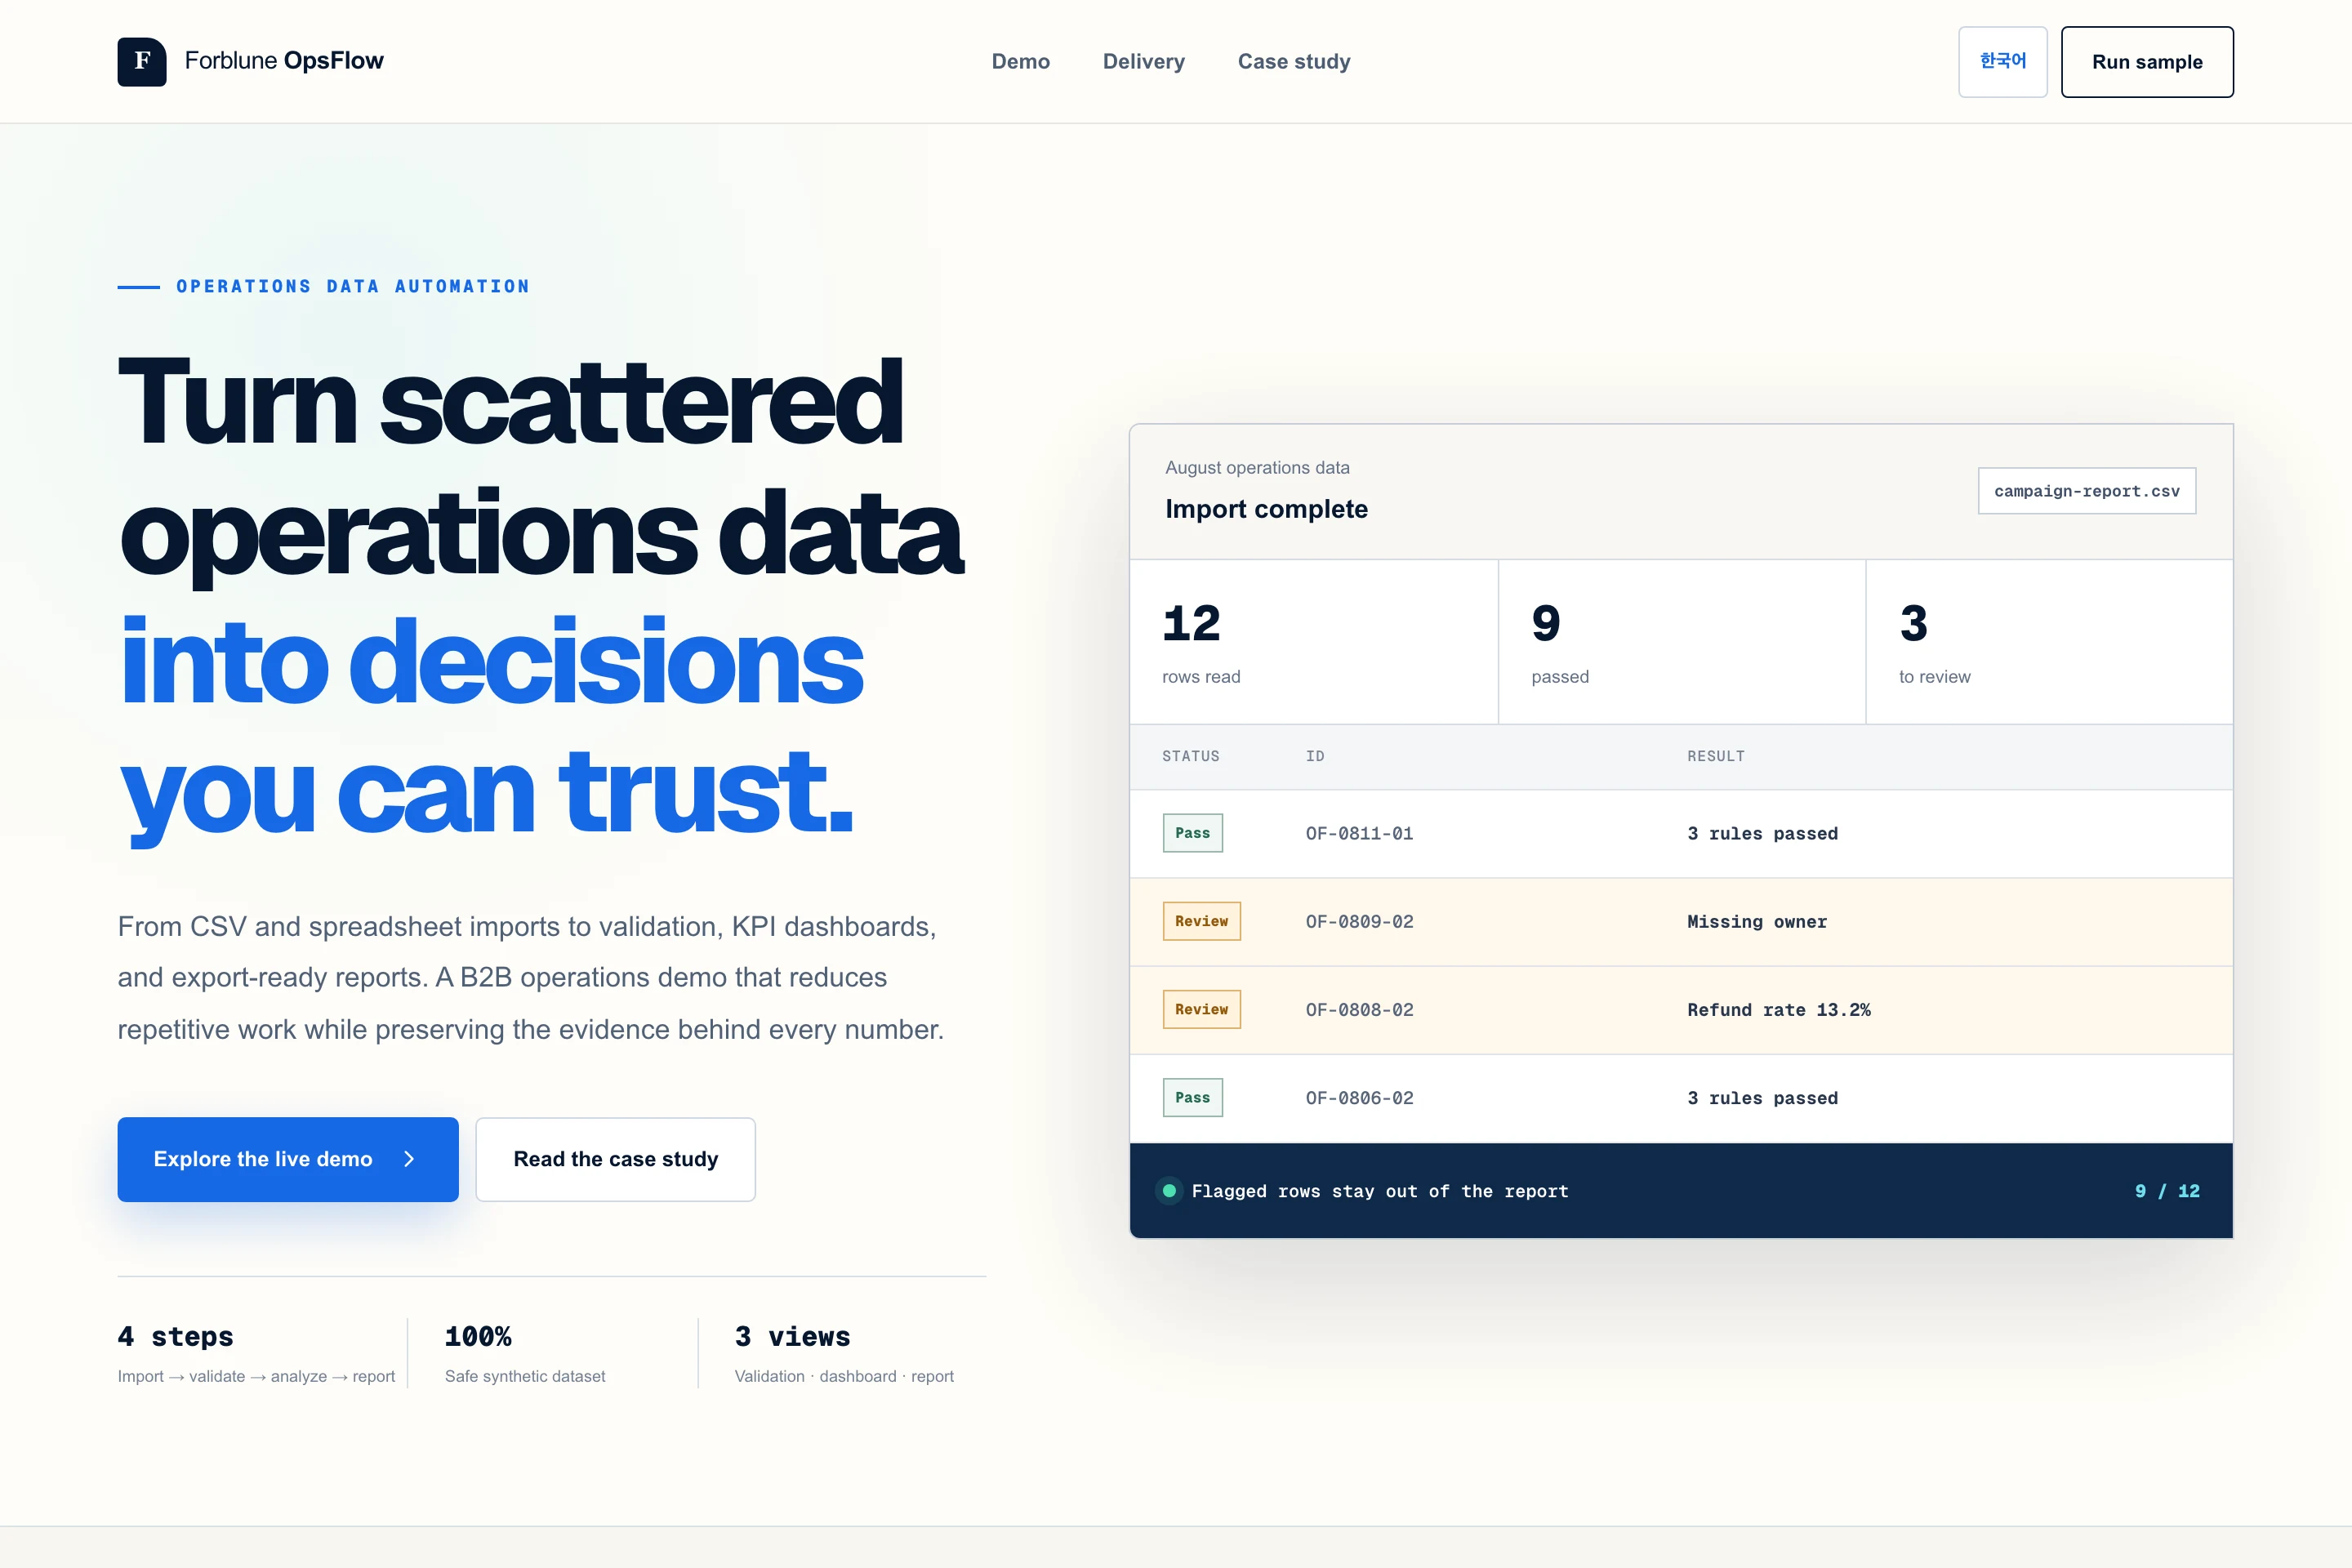
Validation runs before the dashboard, not after it. Sample data or your own CSV goes in, rules for missing owner, duplicate ID and refund-rate threshold run first, and only rows that pass reach the KPI view. What comes out is a cleaned CSV and a print-ready weekly report. Korean and English throughout, switchable from the header. Uploaded files are parsed in the browser and never sent to a server.
Verification
Built in React, TypeScript and Vite, with lint and test scripts in the repository. Layouts checked in real browsers at desktop, tablet and mobile widths. The first-screen visual uses the same validation table and sample rows as the live demo rather than a generated image, so the hero does not promise something the product cannot do.
Live demo — https://opsflow.forblune.com
Like this project
Posted Aug 12, 2026
A bilingual B2B operations demo that validates CSV inputs, produces clean exports, and turns scattered records into decision-ready KPI dashboards and reports.