A data-driven quarterly business review

Syed Abdul Qadir Gilani


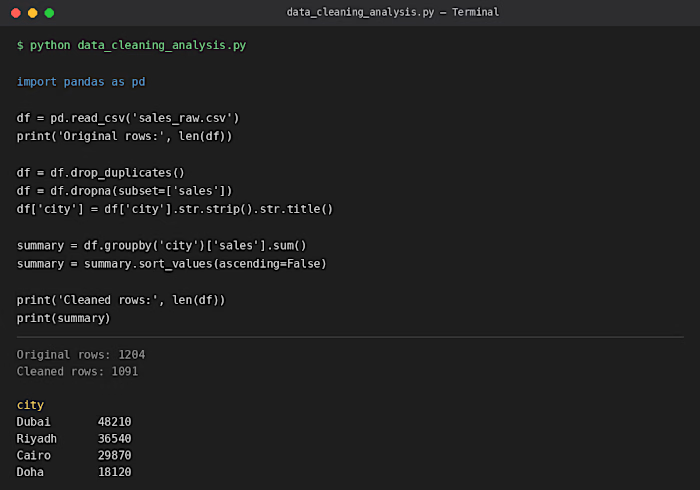
A data-driven quarterly business review dashboard built to track key performance metrics — monthly revenue trends, customer churn rate, and support response time. This project demonstrates data analysis, visualization, and business intelligence reporting skills using Python for data processing and chart generation.
Like this project
Posted Sep 27, 2026
A data-driven quarterly business review dashboard built to track key performance metrics — monthly revenue trends, customer churn rate, and support response ...
Likes
0
Views
4