
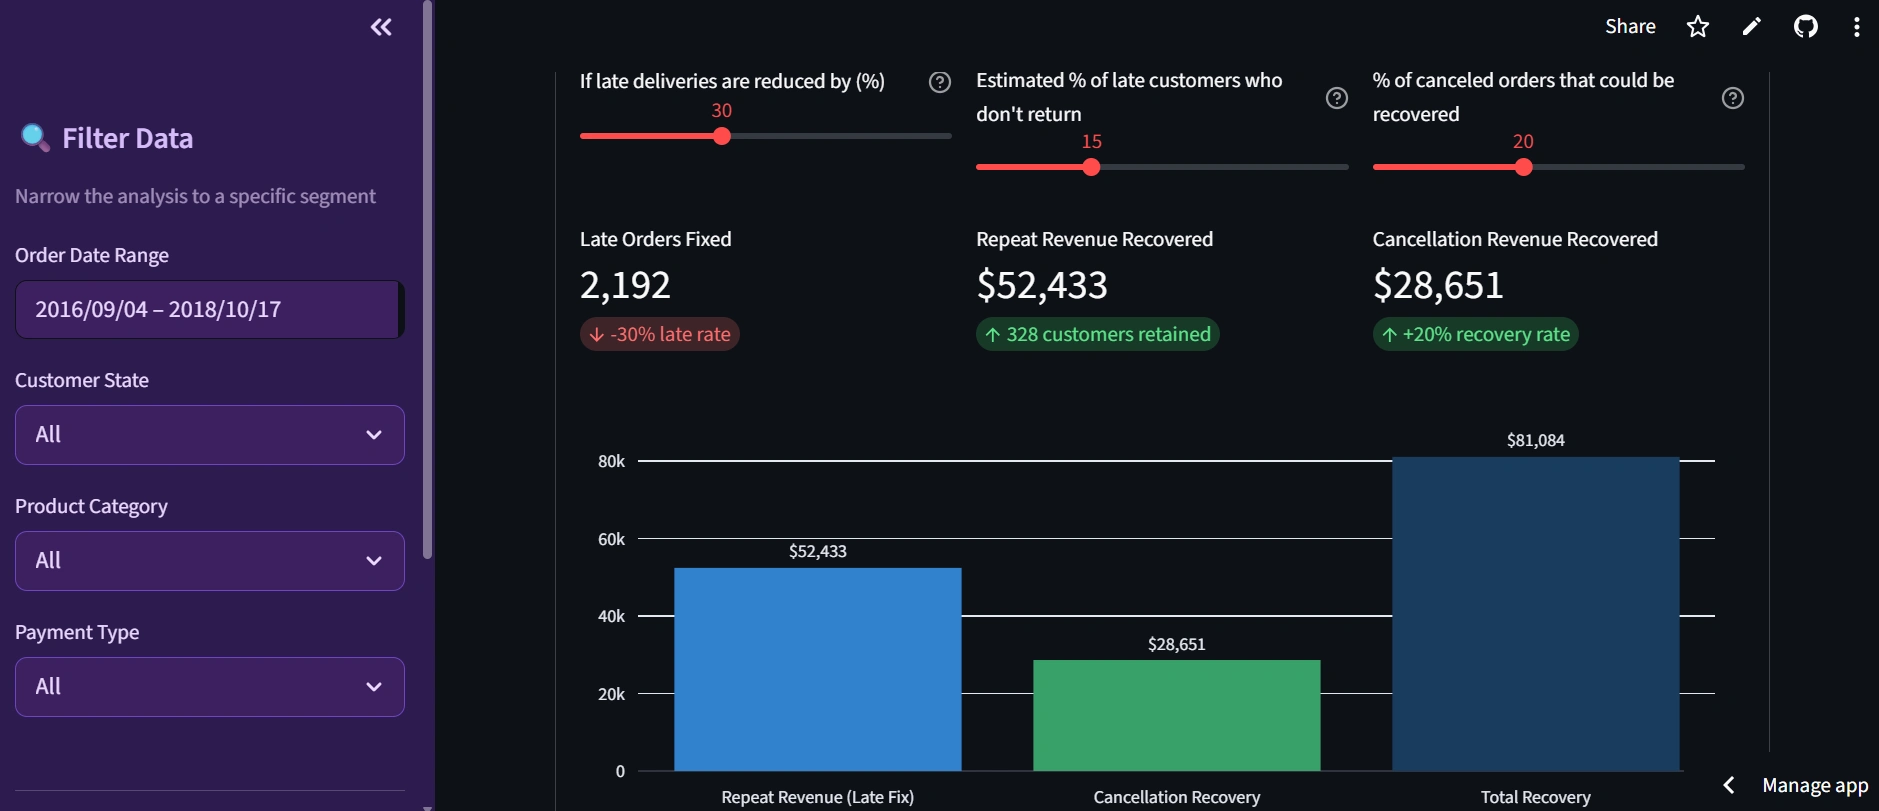
Built an interactive Streamlit dashboard that models revenue recovery scenarios for e-commerce stores. Allows filtering by customer state, product category, and payment type. Three interactive sliders model recovery assumptions — late delivery reduction, customer churn rate, and cancellation recovery rate — and instantly recalculate dollar outcomes. Identified $333,874 in structural revenue risk across 99,441 orders with recovery potential of $40K–$137K depending on execution.
0 likes · 0 views · Apr 28, 2026
Built an interactive Streamlit dashboard that models revenue recovery scenarios for e-commerce stores. Allows filtering by customer state, product category, ...


