State to State Migration Flows


Project description. United States state to state migration flows interactive data visualization
Skills and deliverables
D3.jsJavaScript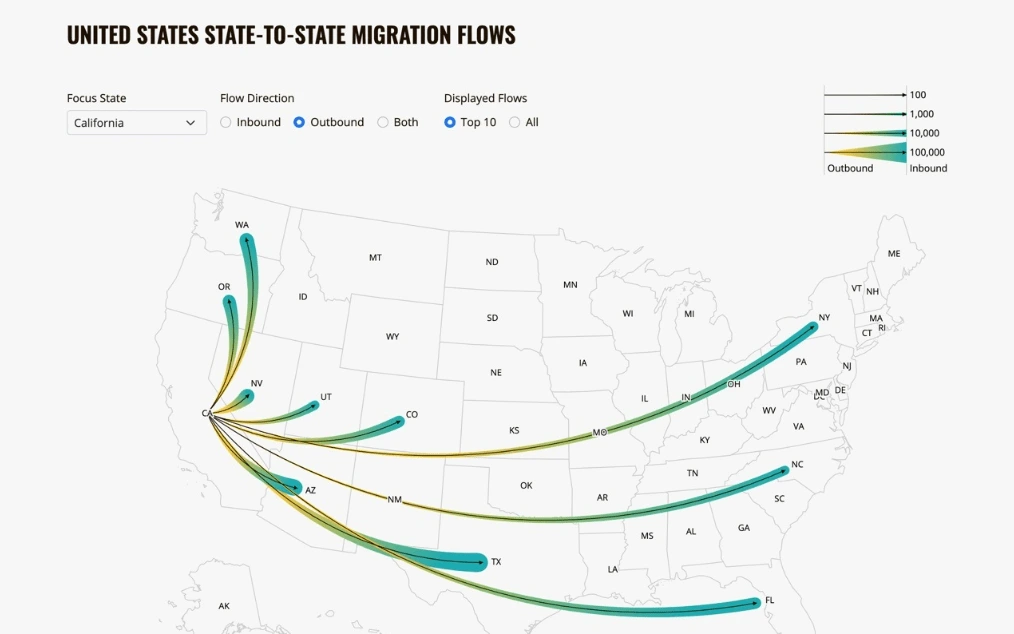
Like this project
0
Posted Feb 3, 2025
Interactive D3.js visualization showing population movement between US states. Features animated flow lines, filterable years, and clickable state connections.
Likes
0
Views
8


Bubble Map

Full Stack Developer (Next.js)

Hosting n8n on Google Kubernetes Engine (GKE)

Binance Crypto Trader