Backtesting KST Python Trading Strategy : 1 218 449$ Profit
Eymeric Plaisant

The KST (Know Sure Thing) indicator is a momentum oscillator that is used to identify major trend changes in the market. It was developed by Martin J. Pring and is based on four different time frames, which are 10, 15, 20 and 30 periods.
The KST indicator is calculated using a weighted moving average of the rate of change (ROC) values for each of these four time frames. The ROC is a measure of the percentage change in price over a specified period of time. The KST is then smoothed using a second moving average.
The KST indicator can be used to generate buy and sell signals based on the crossing of two lines — the KST line and the signal line. When the KST line crosses above the signal line, it is considered a buy signal, while a cross below the signal line is a sell signal.
Backtesting is a crucial step in the development of any trading strategy, as it allows traders to evaluate the performance of their strategy on historical data. In this article, we will walk through the process of backtesting a trading strategy using the KST indicator.
To begin, we will import historical price data for the asset we want to trade and calculate the KST indicator using the following code:def calculate_KST(df, roc_periods=(10,15,20,30), sma_periods=(10,10,10,15)):
for i, r in enumerate(roc_periods):
df[f'ROC{i+1}'] = ((df['Close'] - df['Close'].shift(r)) / df['Close'].shift(r)) * 100
weights = [1,2,3,4]
for i, s in enumerate(sma_periods):
df[f'WMA{i+1}'] = df[[f'ROC{j+1}' for j in range(i+1)]] @ weights[:i+1] / sum(weights[:i+1])
df['KST'] = df[[f'WMA{j+1}' for j in range(4)]] @ weights / sum(weights)
df['KSTS'] = df['KST'].rolling(window=9).mean()
return df
This function takes in a DataFrame
df containing the historical price data, as well as two tuples - roc_periods and sma_periods - that specify the periods to use for the rate of change and moving average calculations, respectively. It returns the same DataFrame with additional columns for each of the four ROC values, the four weighted moving averages, the KST, and the KSTS (the KST smoothed with a 9-period moving average).df['KST'] = ta.trend.kst(close=df['close'], roc1=10, roc2=15, roc3=20, roc4=30, window1=10, window2=10, window3=10, window4=15, fillna= True)df['KSTS'] = ta.trend.kst_sig(close=df['close'], roc1=10, roc2=15, roc3=20, roc4=30, window1=10, window2=10, window3=10, window4=15, nsig=9, fillna= True)
Next, we will define our trading strategy, which will generate buy signals when the KST line crosses above the KSTS line, and sell signals when the KST line crosses below the KSTS line. We will use the following code:def generate_signals(df):
signals = []
for i in range(1, len(df)-1):
if df.iloc[i]['KSTS'] > df.iloc[i]['KST']:
signals.append(-1)
elif df.iloc[i]['KST'] > df.iloc[i]['KSTS']:
signals.append(1)
else:
signals.append(0)
return signals
This function takes in the DataFrame with the KST and KSTS columns, and generates a list of signals based on the crossing of these two lines.
Finally, we will backtest our strategy using the historical price data and the signals generated by our trading strategy. We will assume a starting capital of $1,000 and use the following code to simulate our trades:
Let’smake a backtest with ETHUSDT now in 1h timeframe :# Add the signals list to the dataframe as a new column
df["signal"] = signals
print(signals)
investment = 1000
current_investment = 1000
invested_amount = 0
fees = 0
profit = 0
is_invested = False
best_trade = -99999999
worst_trade = 99999999
largest_loss = 0
largest_gain = 0
total_trades = 0
loss_threshold = 0.03 # Stop loss threshold at 5% loss
loss_amount = 0 # variable to track loss amount
for i in range(500, len(df)):
signal = df.iloc[i]['signal']
close = df.iloc[i]['close']
if signal == 1 and not is_invested:
Entrypoint = close
print(signal)
print(close)
quantity = (current_investment / close)
print(current_investment)
print(quantity)
invested_amount = quantity * close
is_invested = True
elif signal == -1 and is_invested:
print(signal)
print('close', close)
profit = quantity * (close - Entrypoint) - 2
print('profit' ,profit)
current_investment += profit
invested_amount = 0
total_trades += 1
is_invested = False
if profit > largest_gain:
largest_gain = profit
if profit < largest_loss:
largest_loss = profit
if profit > best_trade:
best_trade = profit
if profit < worst_trade:
worst_trade = profit
loss_amount = 0 # reset loss_amount when position is closed
elif is_invested:
# check if stop loss threshold has been reached
loss = invested_amount - (quantity * close)
if loss > invested_amount * loss_threshold:
print("Stop loss triggered!")
profit = invested_amount * (1 - loss_threshold) - invested_amount - 2
current_investment += profit
invested_amount = 0
total_trades += 1
is_invested = False
if profit > largest_gain:
largest_gain = profit
if profit < largest_loss:
largest_loss = profit
if profit > best_trade:
best_trade = profit
if profit < worst_trade:
worst_trade = profit
loss_amount = 0 # reset loss_amount when position is closed
else:
loss_amount = loss # update loss_amount
else:
pass
final_profit = current_investment - investment
print("Final Profit: ", final_profit)
print("Best Trade: ", best_trade)
print("Worst Trade: ", worst_trade)
print("Largest Loss: ", largest_loss)
print("Largest Gain: ", largest_gain)
print("Total Trades: ", total_trades)
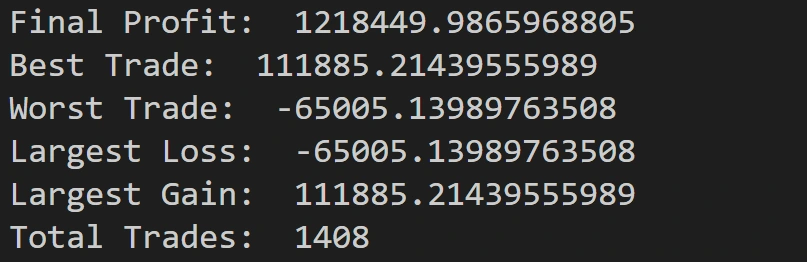
After running the backtest on the historical data, I obtained a final portfolio value of $1,218,449. This result indicates that the strategy was profitable, and it could potentially be used to generate positive returns in the future.
Like this project
Posted Feb 25, 2024
After running the backtest on the historical data, I obtained a final portfolio value of $1,218,449. This result indicates that the strategy was profitable
Likes
0
Views
66