Romix - Dashboard for Business Analytic Platform
Md Bulbul Islam
📊 Romix – Dashboard for Business Analytics Platform (UI/UX Concept)
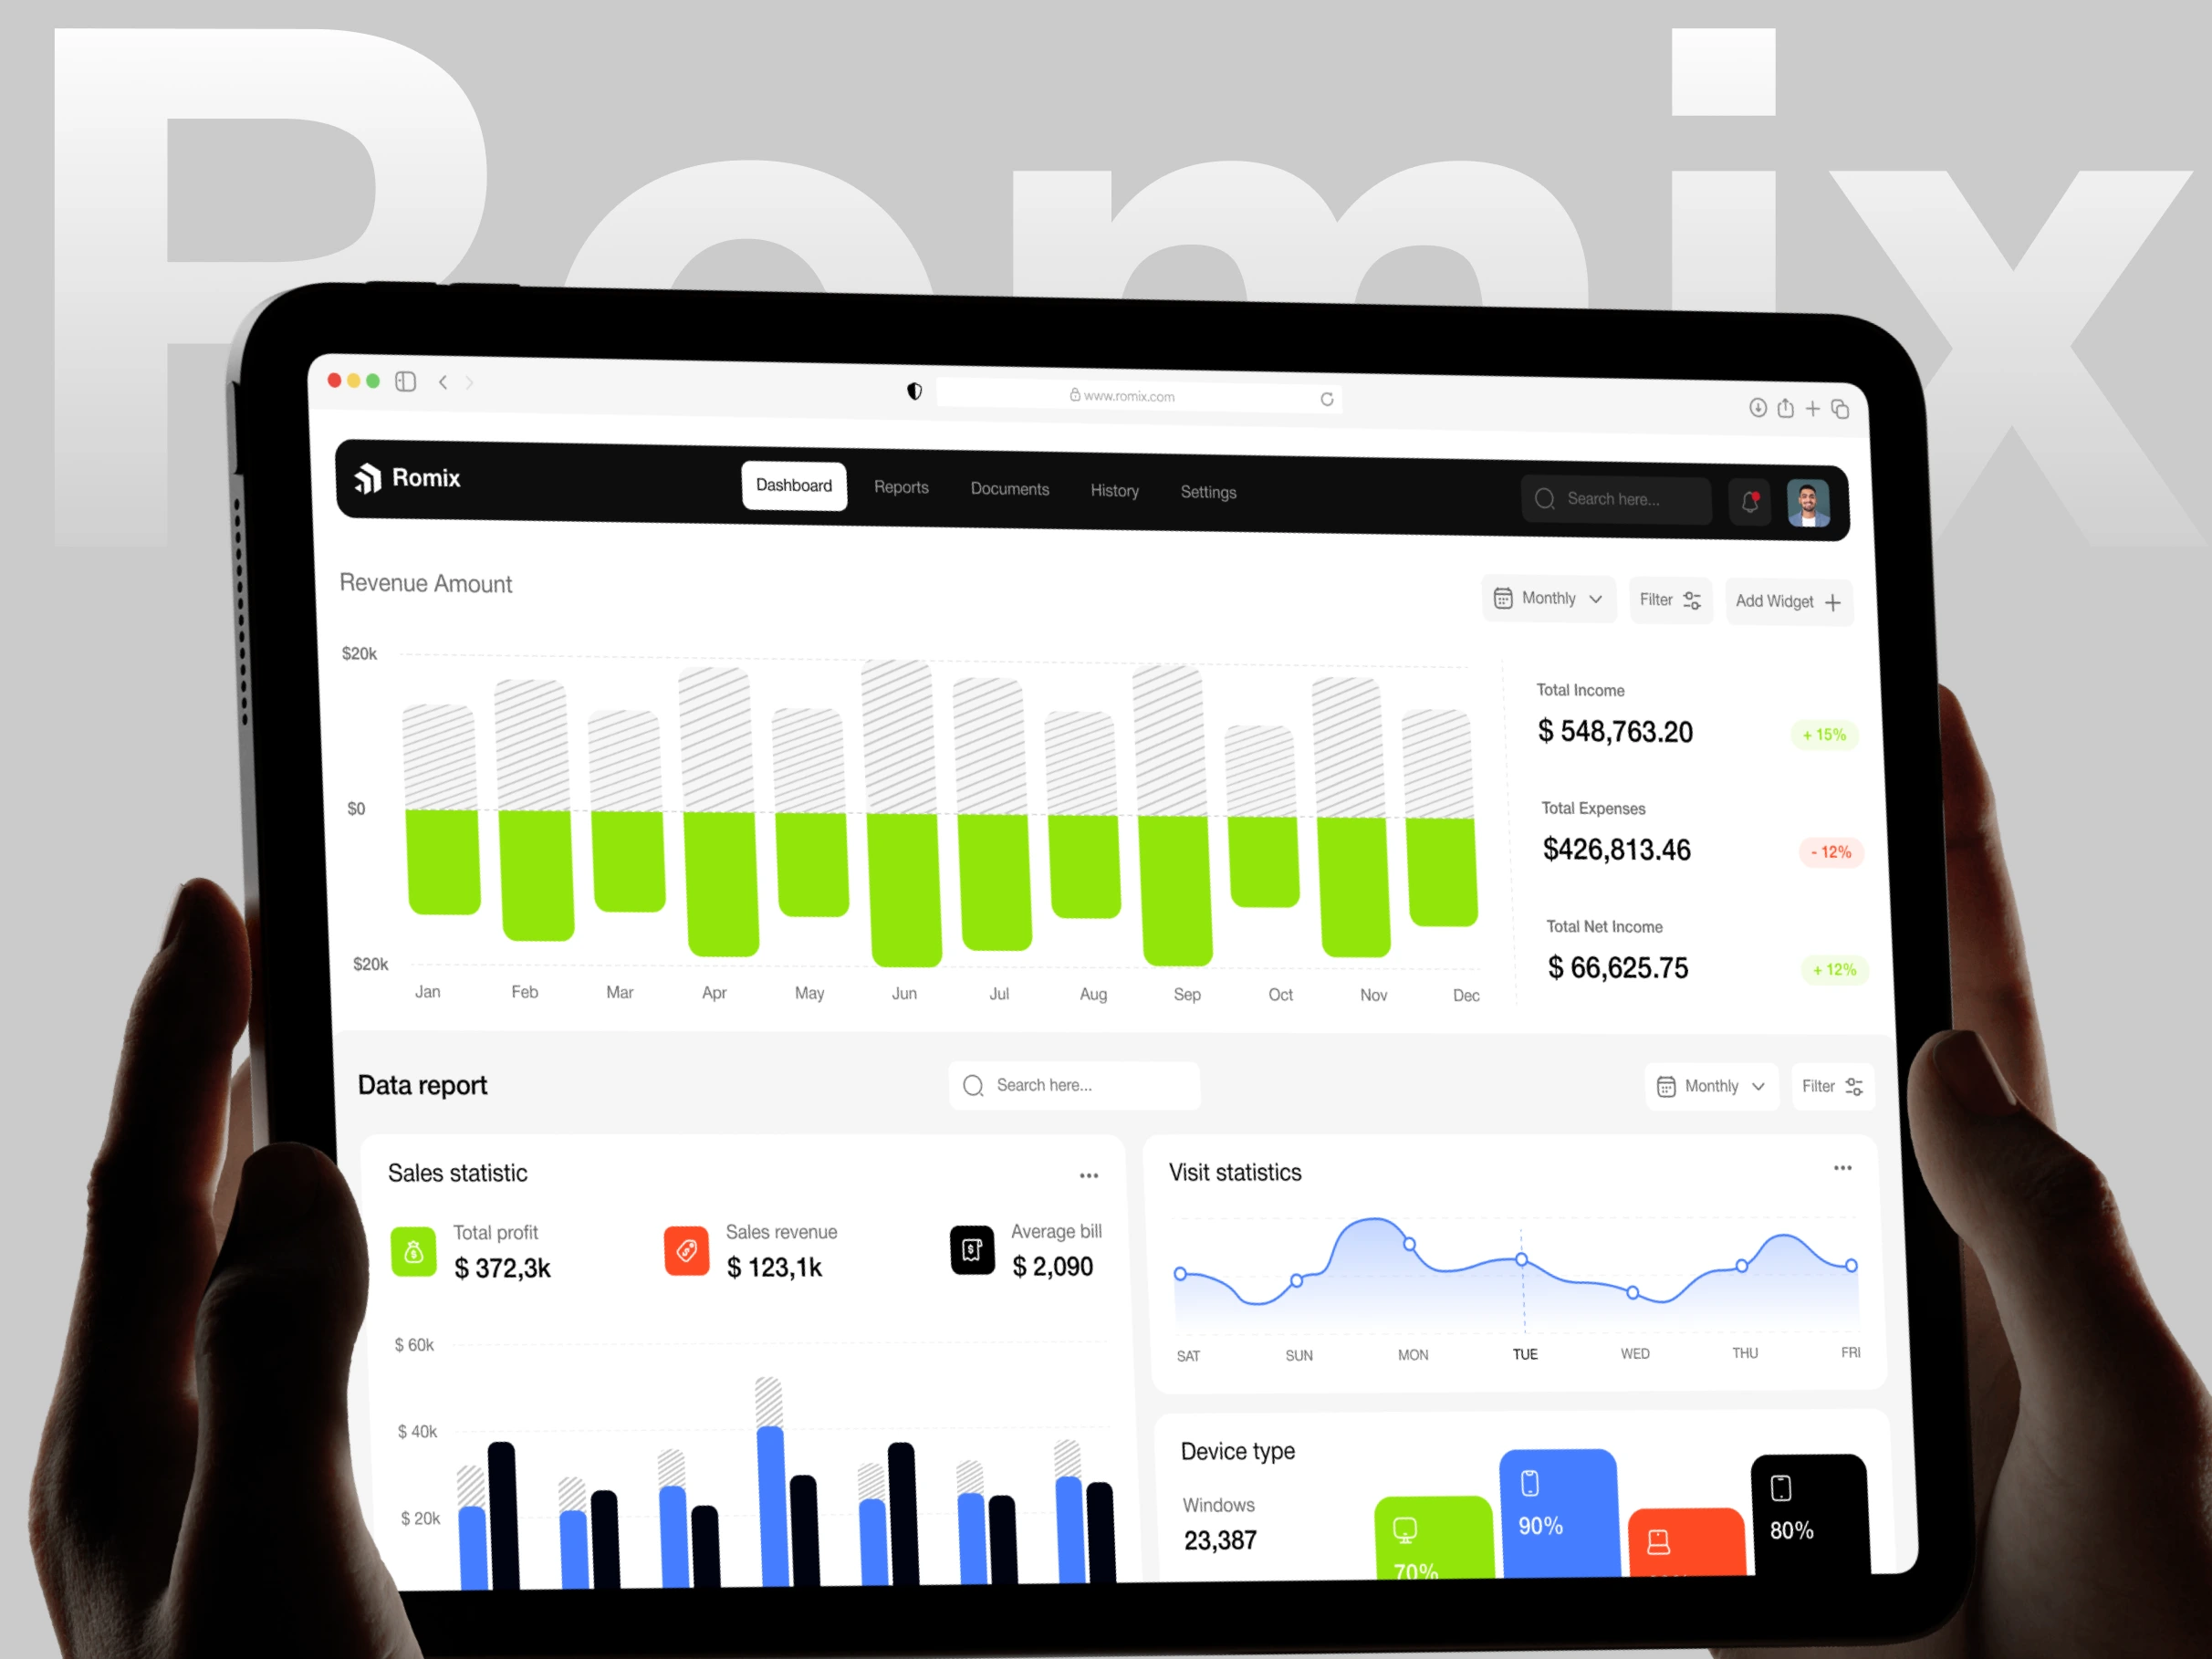
1. Overview: Romix is a sleek, intuitive dashboard UI concept designed to simplify complex business data into clear, actionable insights. The platform helps users monitor KPIs, track performance, and make informed decisions—all in one place.
2. Key Features:
📈 Customizable KPI Widgets – Tailor dashboards to focus on relevant business metrics
📊 Interactive Data Visualizations – Line charts, bar graphs, and heatmaps
🗂️ Report Center – Downloadable reports with filters by department, timeline, or goal
🚀 Performance Overview – Real-time updates and growth indicators
📆 Task & Goal Tracking – Visual progress tracking for business objectives
3. Design Highlights:
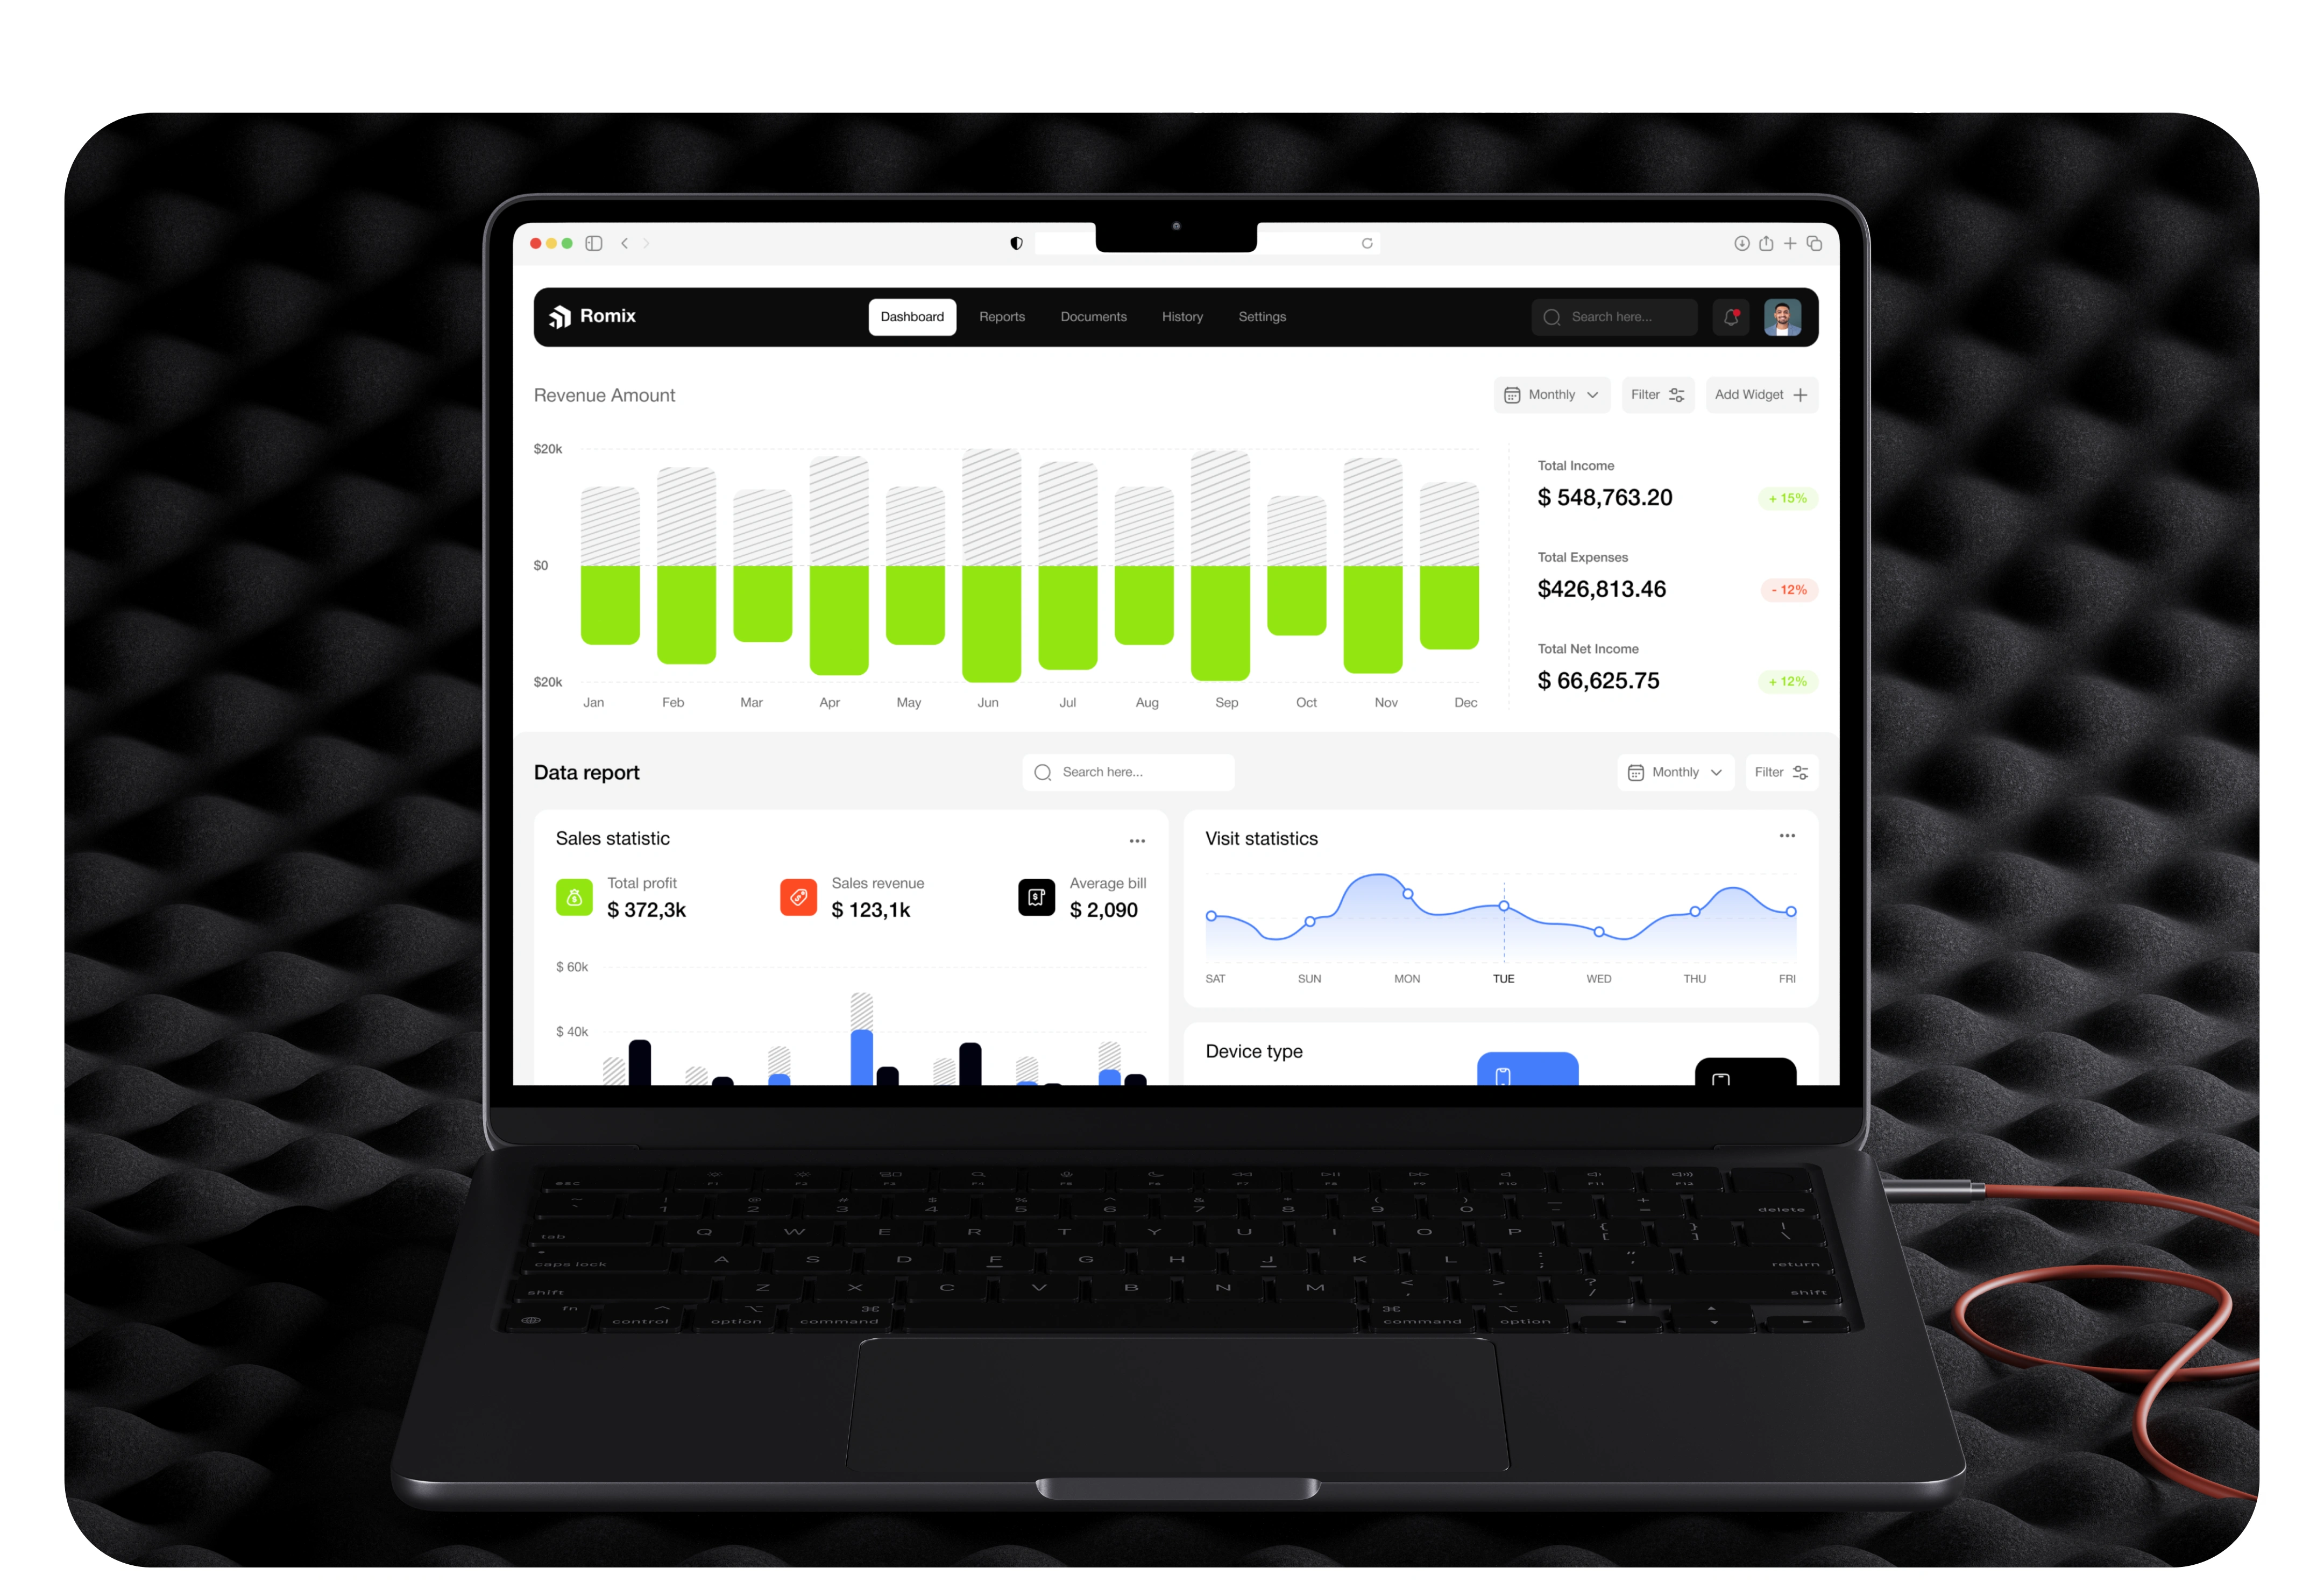
Clean, grid-based layout with smart data grouping
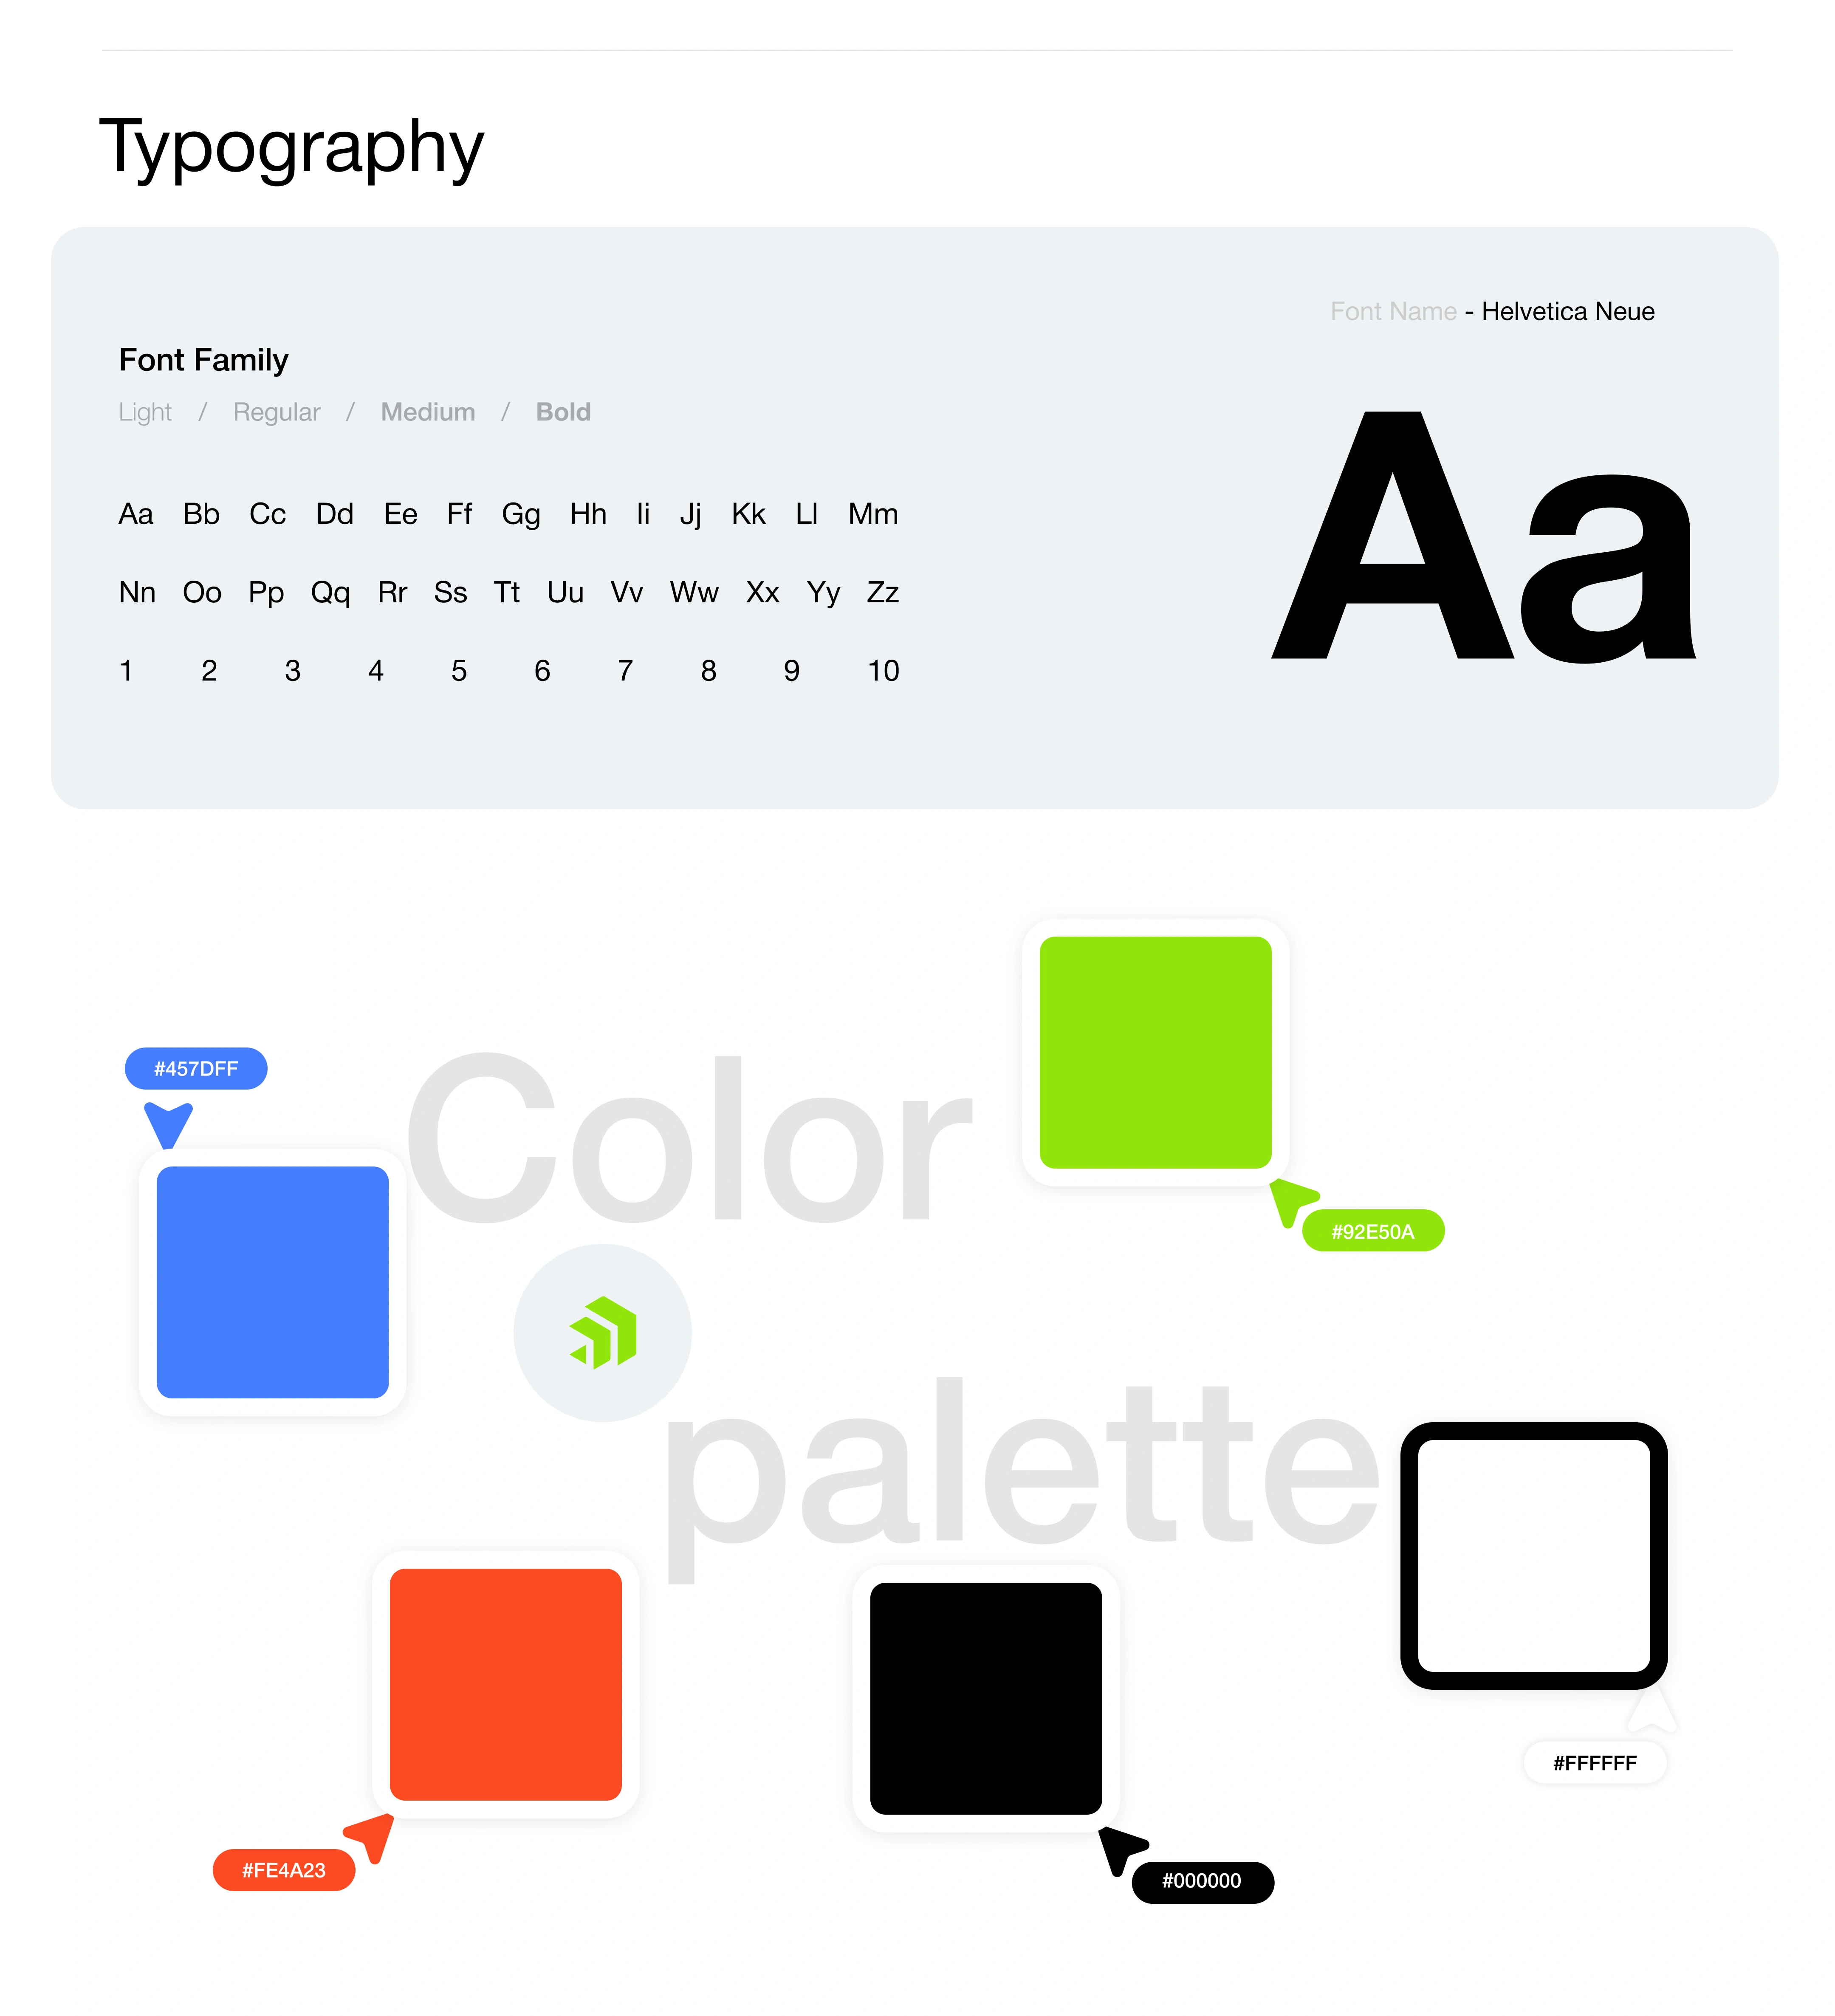
Professional color scheme with highlights for key metrics
Consistent iconography and modular card components
Emphasis on clarity, accessibility, and fast navigation
4. Tools Used: Figma / Adobe XD / Sketch (choose your tool)
5. Purpose: To deliver a professional analytics experience that transforms raw business data into visually clear and easy-to-understand insights for teams and decision-makers.
Like this project
Posted Oct 21, 2025
📊 Romix – A sleek, intuitive dashboard UI that simplifies business data with real-time insights, KPI tracking, and interactive visual analytics.
Likes
1
Views
4