Shipping Logistics Dashboard Design
Cansaas Agency
Overview
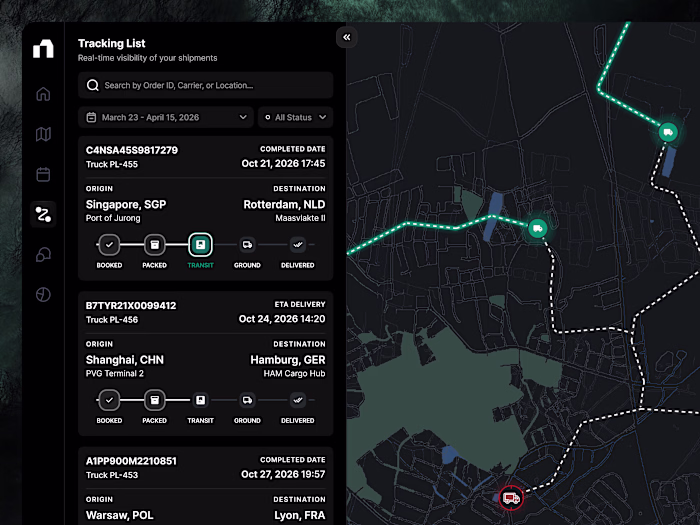
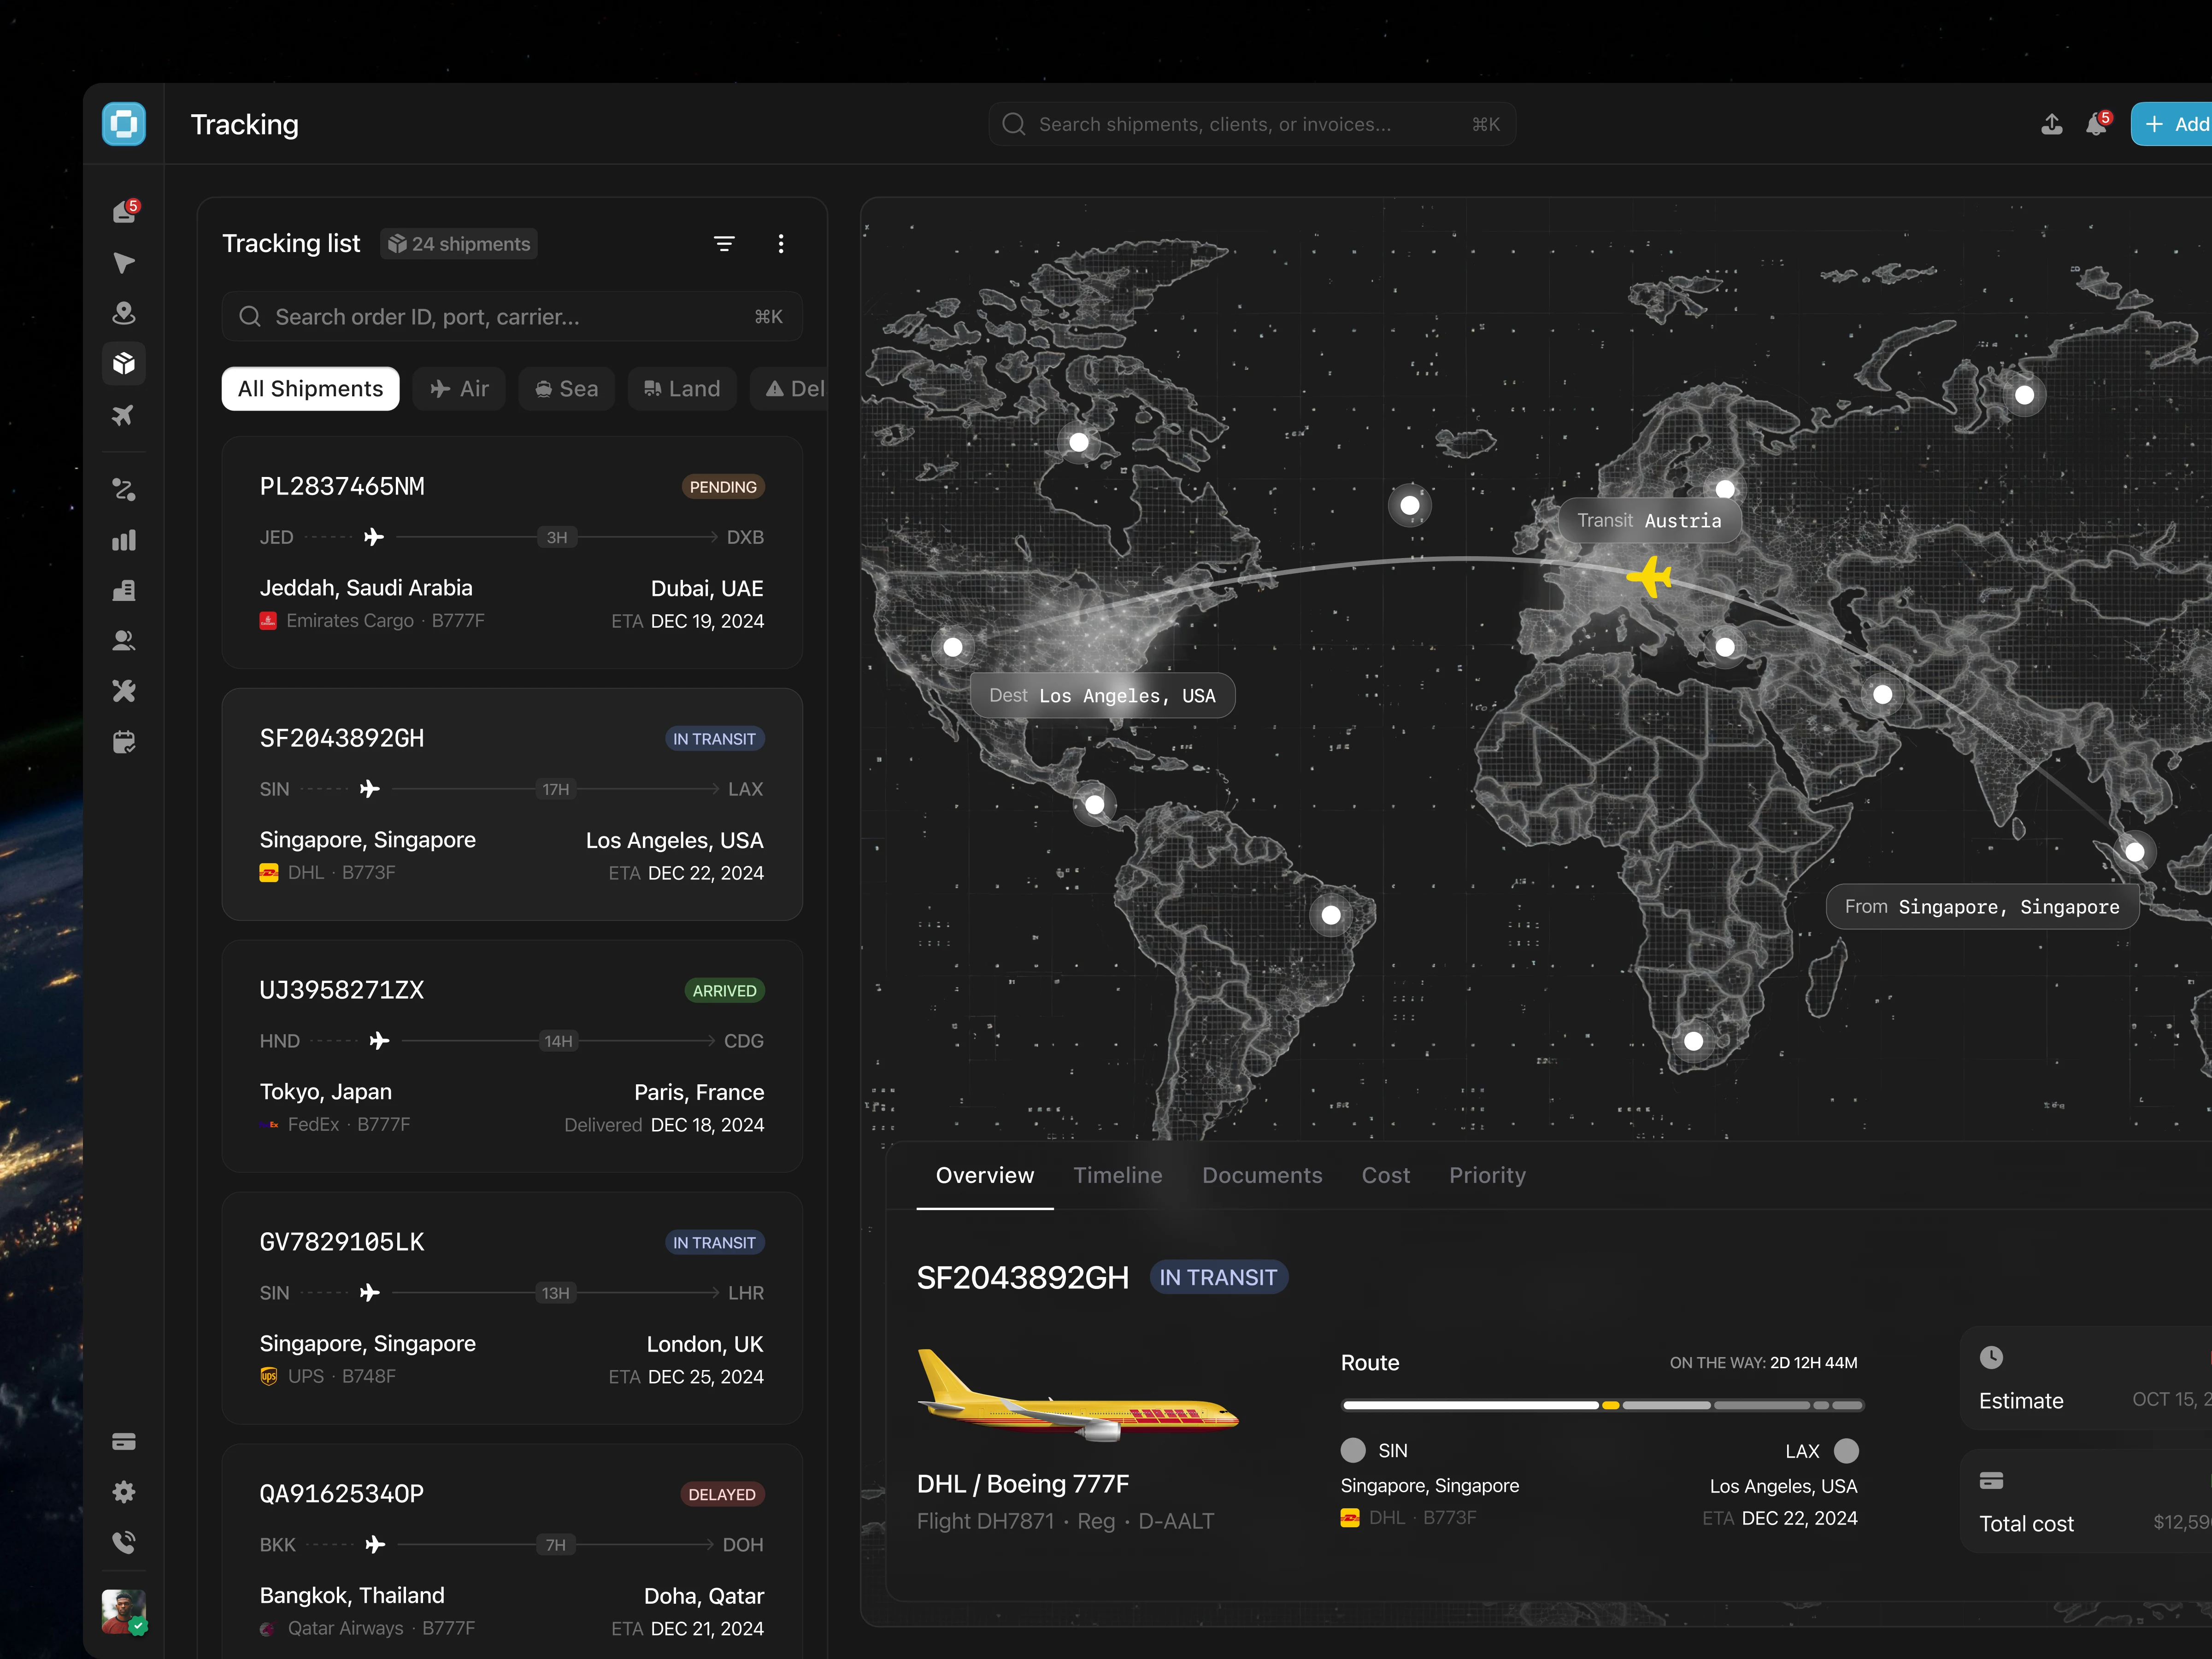
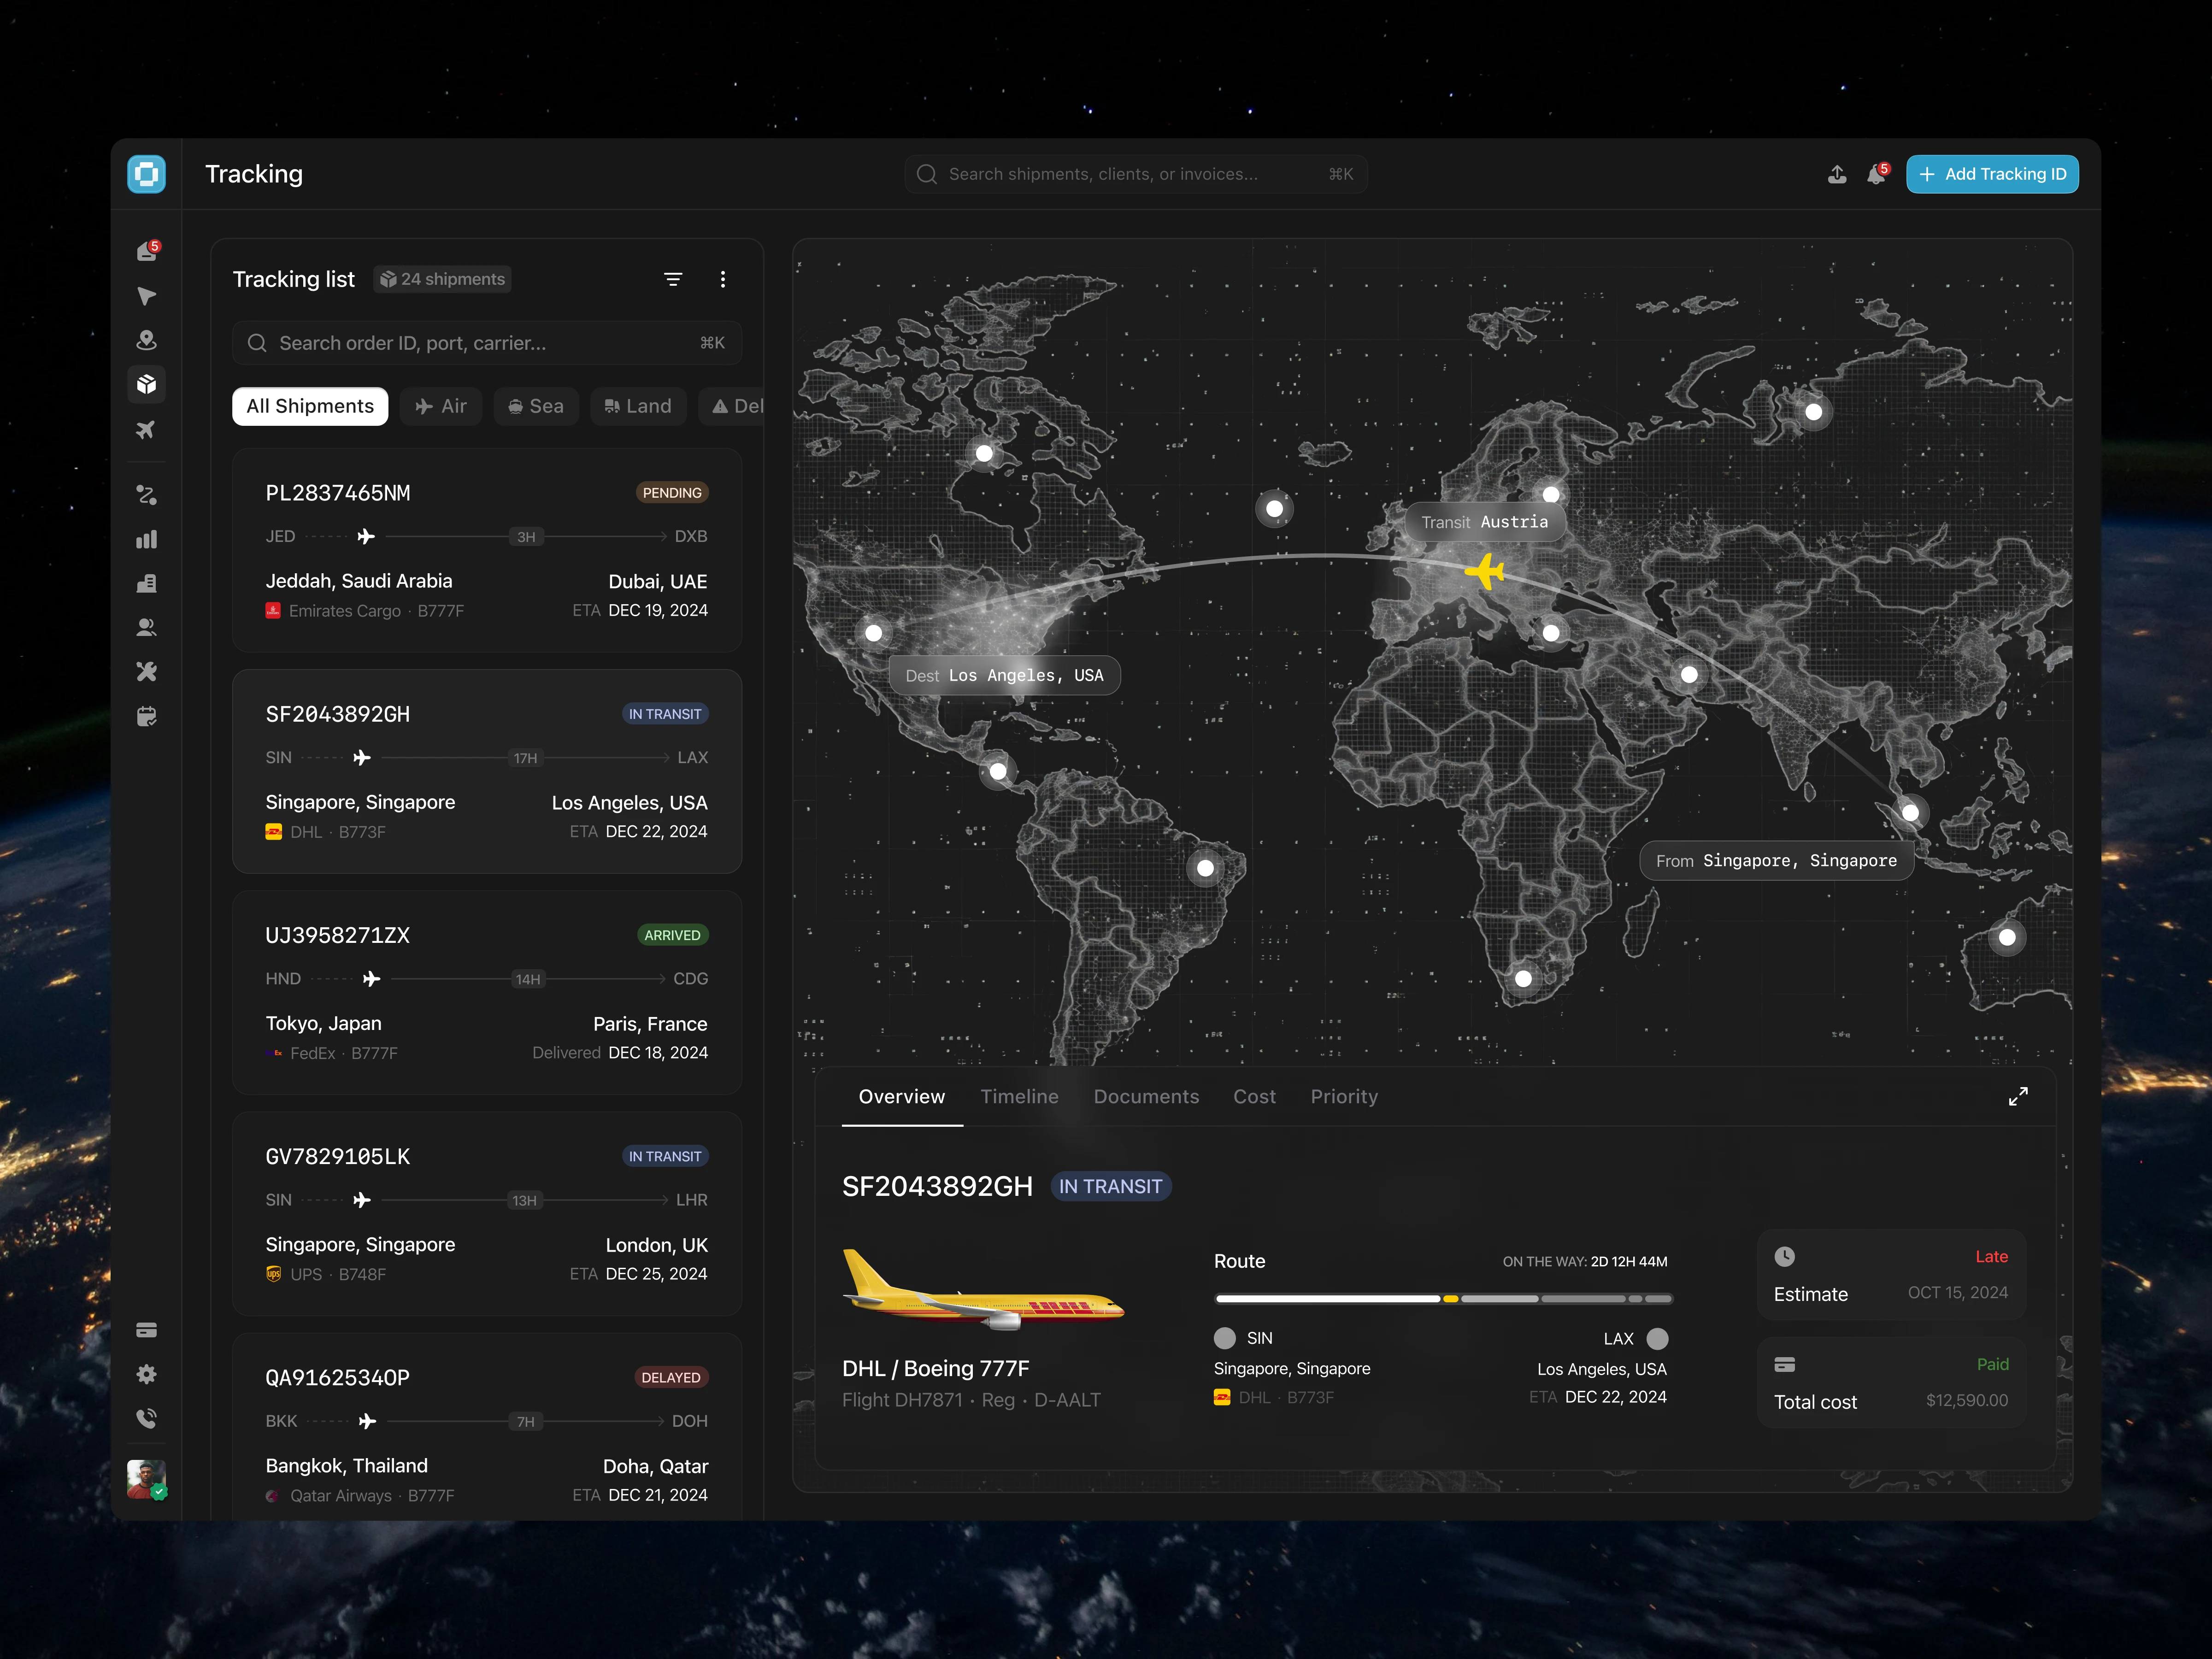
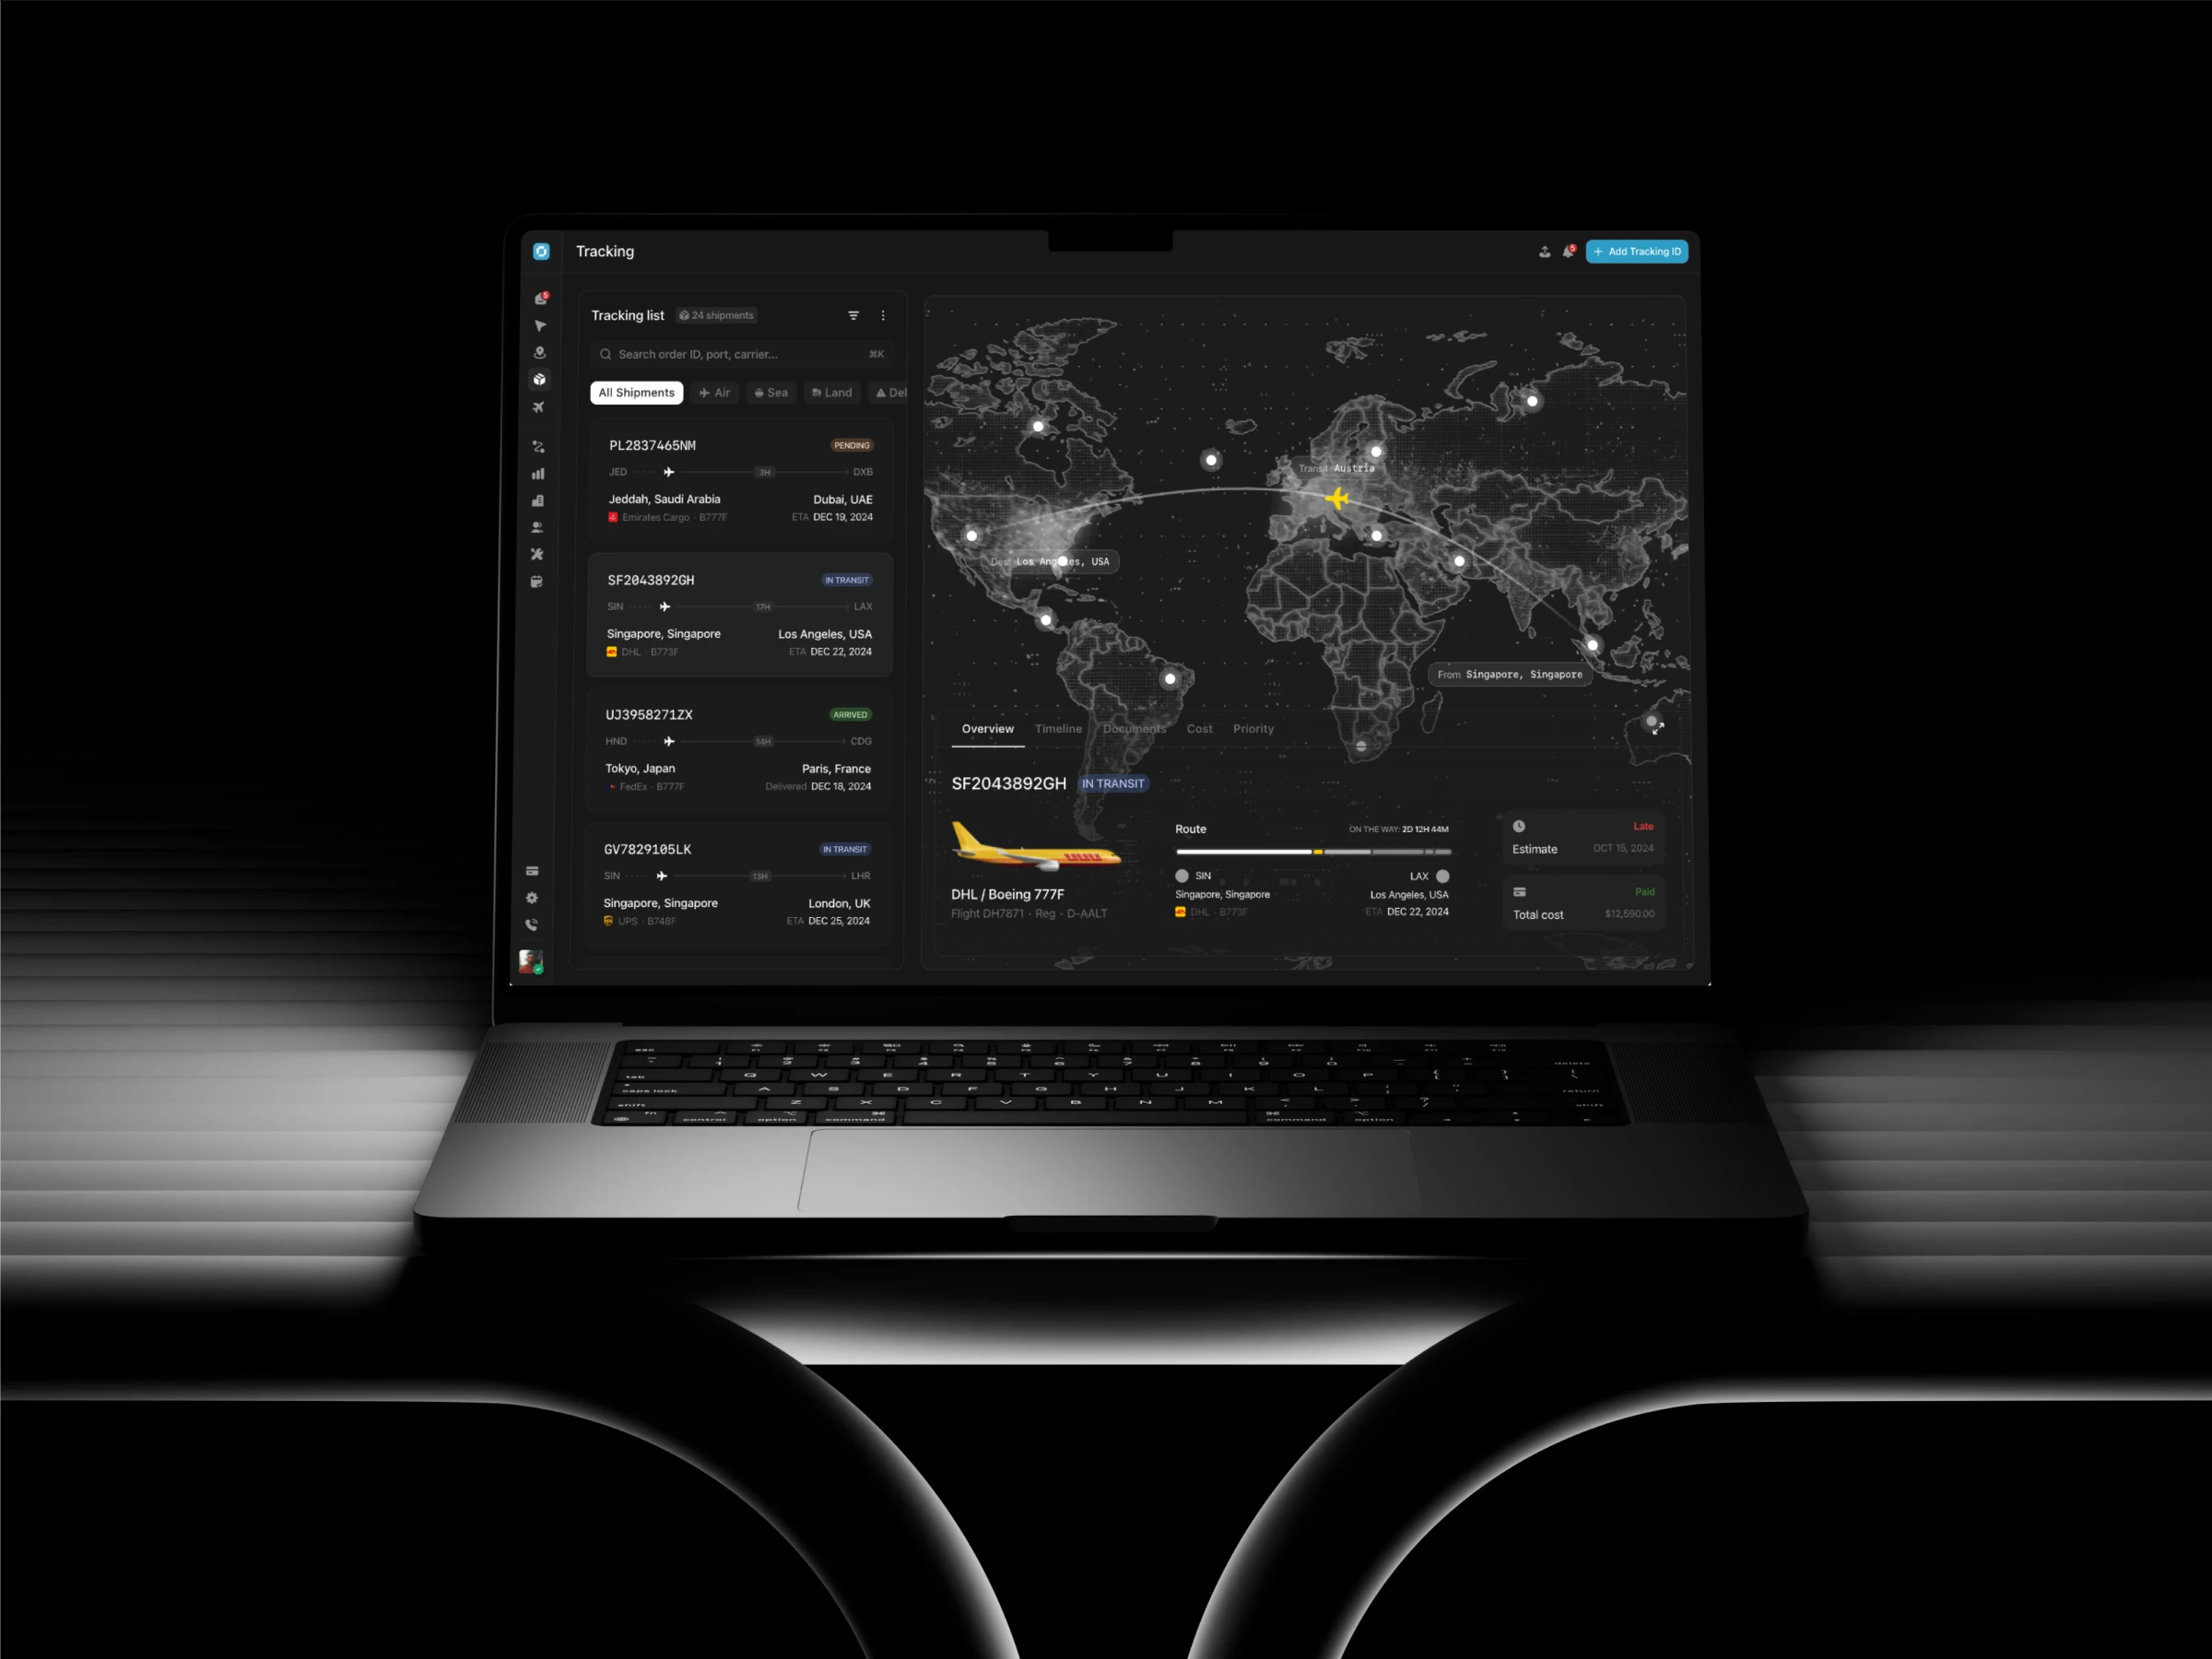
This Shipping Logistics Dashboard was designed to simplify complex logistics operations through a more visual, structured, and immersive monitoring experience. The interface combines real-time shipment tracking, global route visualization, cargo status management, and operational analytics into a single centralized dashboard. Using a dark-mode aesthetic with high-contrast highlights, the design creates a premium and highly focused environment for logistics teams handling large-scale international shipments.
The Challenge
Logistics platforms often contain dense operational data spread across multiple systems, making shipment monitoring feel fragmented and difficult to navigate. Users need to quickly understand shipment status, delivery timelines, transit progress, and transportation routes without being overwhelmed by excessive information. The challenge was creating a dashboard capable of displaying high-volume logistics data while maintaining clarity, usability, and visual hierarchy.
Design Approach
The dashboard focuses heavily on spatial awareness and operational visibility. A large interactive world map becomes the visual center of the experience, helping users instantly understand shipment movement and transit locations globally. Supporting panels were designed with modular card layouts, allowing shipment details, ETAs, transport methods, and tracking statuses to remain easy to scan and compare.
The dark UI helps reduce visual noise while emphasizing critical logistics indicators such as active routes, shipment states, delays, and destination points. Subtle glow effects, layered transparency, and structured spacing were used to create depth without sacrificing readability.
User Experience & Interaction
To improve usability, the dashboard separates information into clear operational zones. The shipment list enables fast filtering by transport type, while the tracking overview provides immediate access to route progress, delivery estimates, and cost summaries. Status badges and timeline indicators make shipment conditions recognizable at a glance, helping logistics teams make faster operational decisions.
The combination of map visualization, route progression, and structured analytics transforms complex shipping workflows into a more intuitive and manageable experience.
Like this project
Posted May 8, 2026
Designed a logistics dashboard for real-time shipment tracking and analytics.