Beautiful Plots for Your Data
Ayodele Ayeni
Briefly describe the project you worked on. What did you create, who did you create it for, and how did you approach this project?
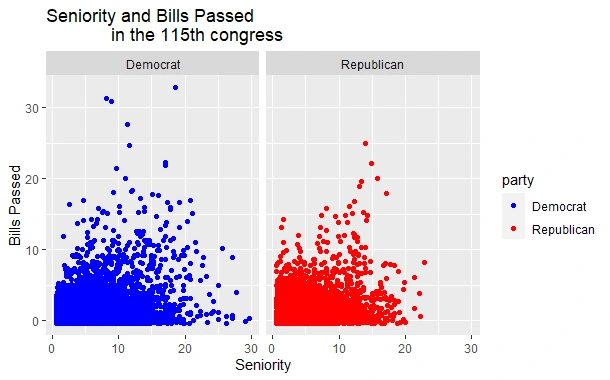
Sample scatterplot showing distribution of Democrats to Republicans
Like this project
Posted Aug 2, 2022
I'll create stunning visualizations for your data. This includes those for qualitative/qualitative data, as well any custom visualizations that suit your needs.
Likes
0
Views
25