Social Network Analysis

KUMAR RAHUL

#install.packages("igraph")
library(igraph)
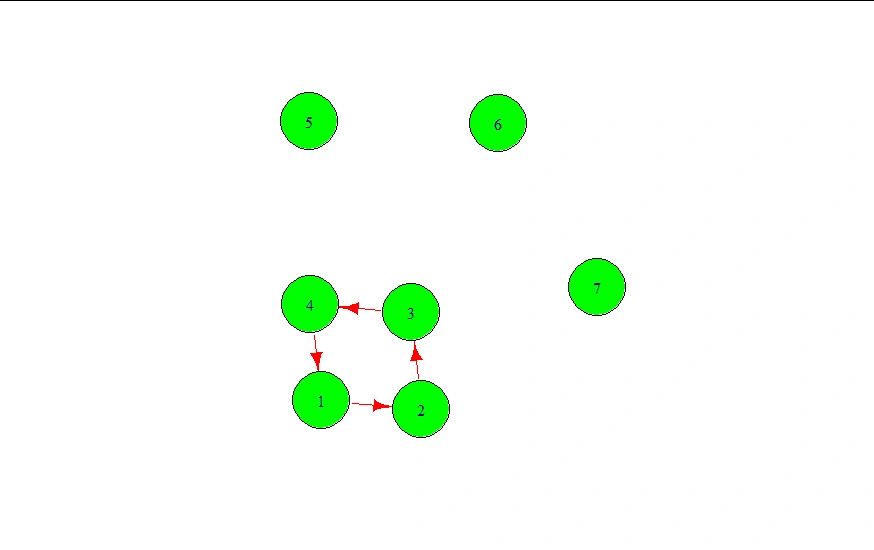
g <- graph(c(1,2,2,3,3,4,4,1),
directed = T,
n=7)#n is the number of nodes
plot(g,vertex.size=40,
vertex.color='green',
edge.color='red')
Directed=T
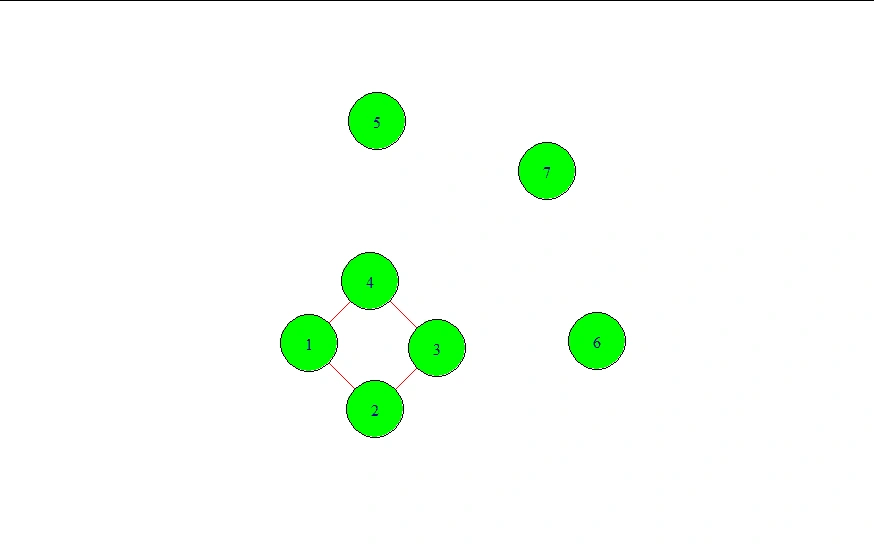
Directed =F
g[]
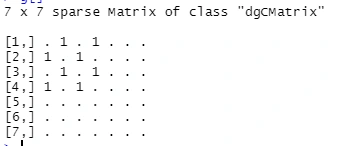
node 1 is related to 2 and 4 , similarly for other nodes the matrix can be seen as above
Now, let us consider an example of Instagram following among some individuals
g2 <- graph(c("Amy", "Ram", "Ram", "Li", "Li", "Amy",
"Amy", "Li", "Kate", "Li"),
directed=T)
plot(g2,vertex.size=40,
vertex.color='green',
edge.color='red')
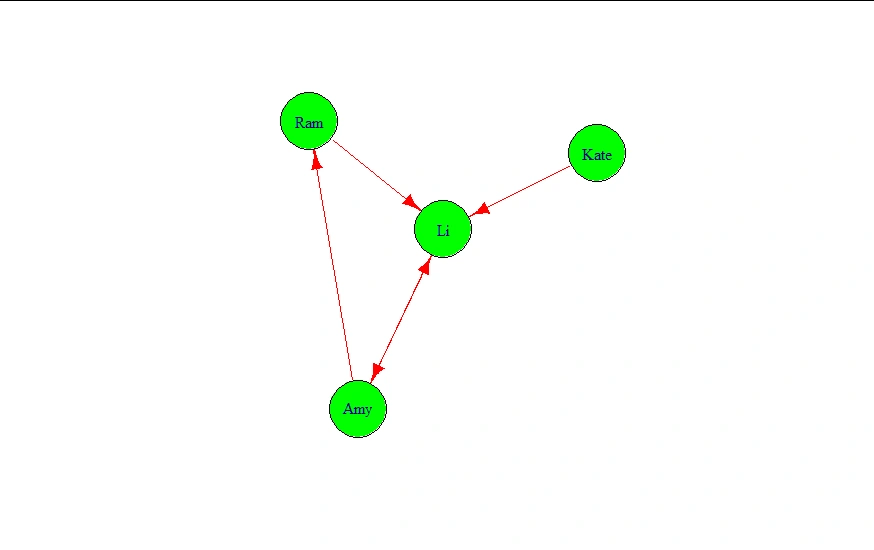
Let's see who follows whom on Instagram and who follows back
g2
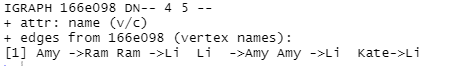
D means directed graph and N is for names
NETWORK MEASURES
degrees
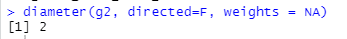
Diameter is 2 for this case
edge_density(g2, loops = F)
ecount(g2)/(vcount(g2)*(vcount(g2)-1))
#0.4166667
reciprocity(g2)#calculates % of ties in directed graphs,proportion of mutual connections
#0.4
closeness(g2,mode='all',weights=NA)#closeness centrality measures how many steps is required to access every other vertex
#from a given vertex
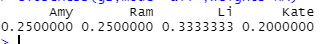
Closeness, Highest for Li since Li is the closest to all of them
betweenness(g2,directed=T,weights=NA)# vertex or edge betweeness is the number of shortest paths going through a vertex or an edge
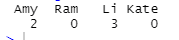
Li is highest and Lowest for Ram & Kate
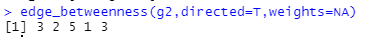
edge_betweenness(g2,directed=T,weights=NA)
#Load Data
data<-read.csv(file.choose(),header=T)
#Create Dataframe
y<-data.frame(data$first,data$second)
#Create Network
net<- graph.data.frame(y,directed=T)
V(net)#Vertices
E(net)#Edges
V(net)$label<-V(net)$name
V(net)$degree<- degree(net)
#Histogram of node degree
hist(V(net)$degree,
col='green',
ylab='Frequency',
xlab='Degree of vertices',
main='Histogram of Node degree')
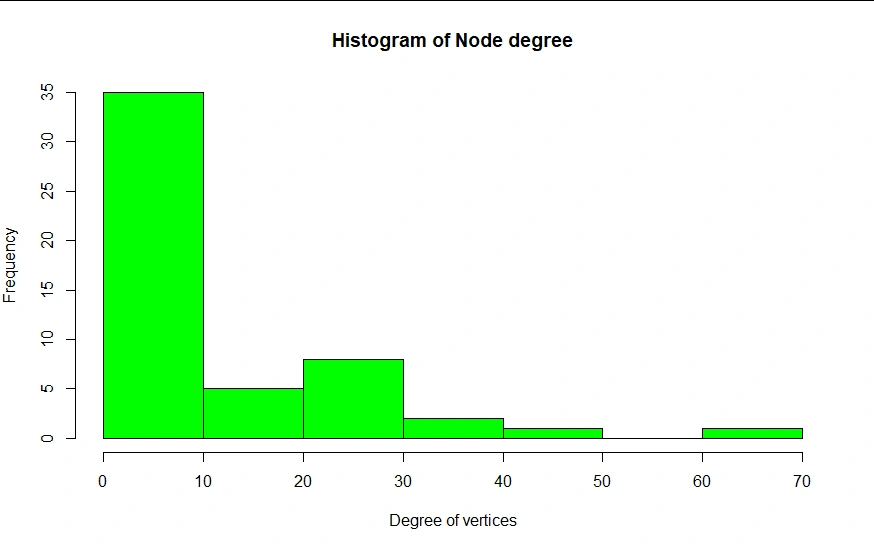
#Inference many nodes with few connections(0-10) and less nodes with high connections(60-70)
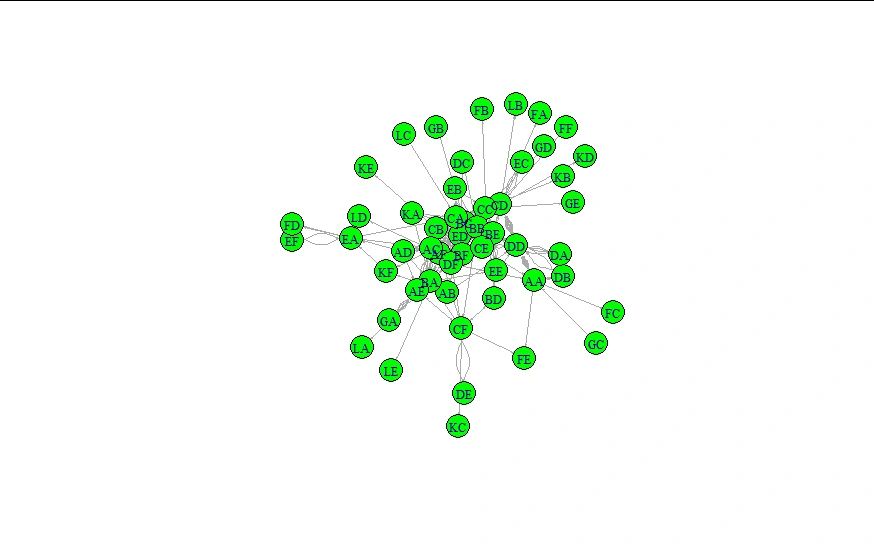
#Network Diagram
set.seed(222)
plot(net,vertex.color='green',
vertext.size=2,
vertex.label.cex=0.8,
edge.arrow.size=0.1)
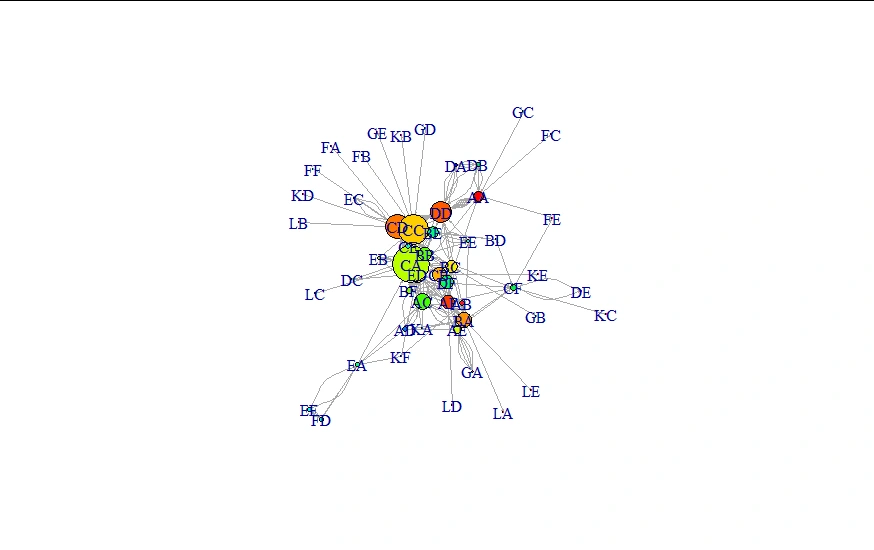
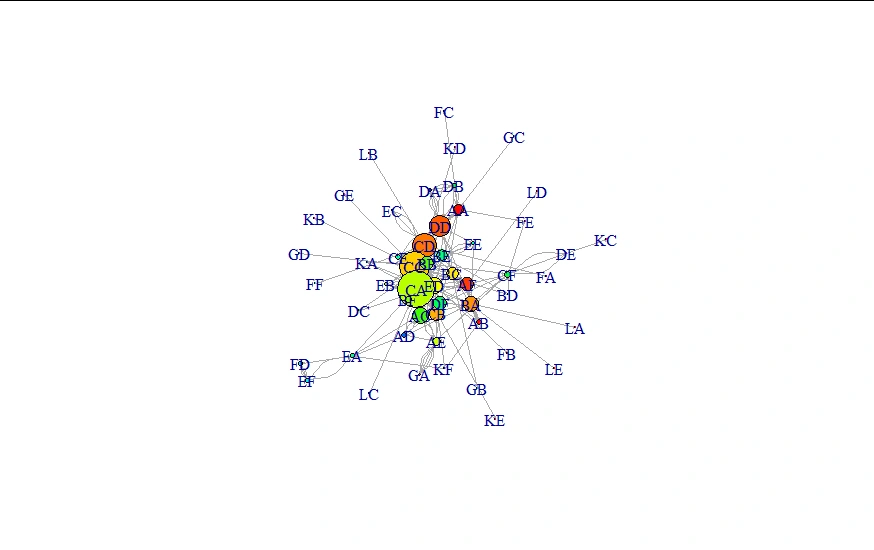
plot(net,
vertex.color=rainbow(52),
vertex.size=V(net)$degree*0.4,
edge.arrow.size=0.1,
layout=layout.fruchterman.reingold)
layout=layout.fruchterman.reingold)
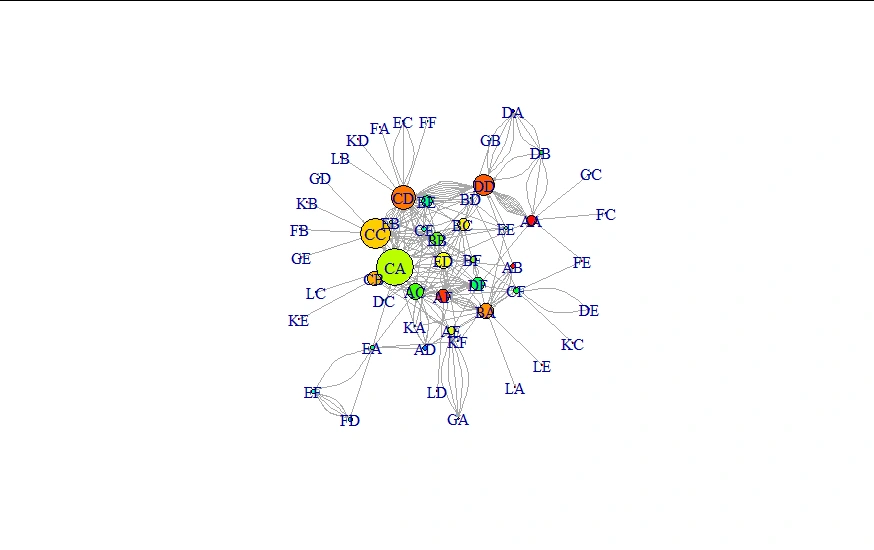
plot(net,
vertex.color=rainbow(52),
vertex.size=V(net)$degree*0.4,
edge.arrow.size=0.1,
layout=layout.graphopt)
layout=layout.graphopt
plot(net,
vertex.color=rainbow(52),
vertex.size=V(net)$degree*0.4,
edge.arrow.size=0.1,
layout=layout.kamada.kawai)
layout=layout.kamada.kawai
#Hubs(number of outgoing) and Authorities(number of incoming to hubs)
hs<-hub_score(net)$vector
as<-authority.score(net)$vector
par(mfrow=c(1,2))
set.seed(123)
plot(net,
vertex.size=hs*30,
mains='Hubs',
vertex.color=rainbow(52),
edge.arrow.size=0.1,
layout=layout.kamada.kawai)
plot(net,
vertex.size=as*30,
mains='Authorities',
vertex.color=rainbow(52),
edge.arrow.size=0.1,
layout=layout.kamada.kawai)
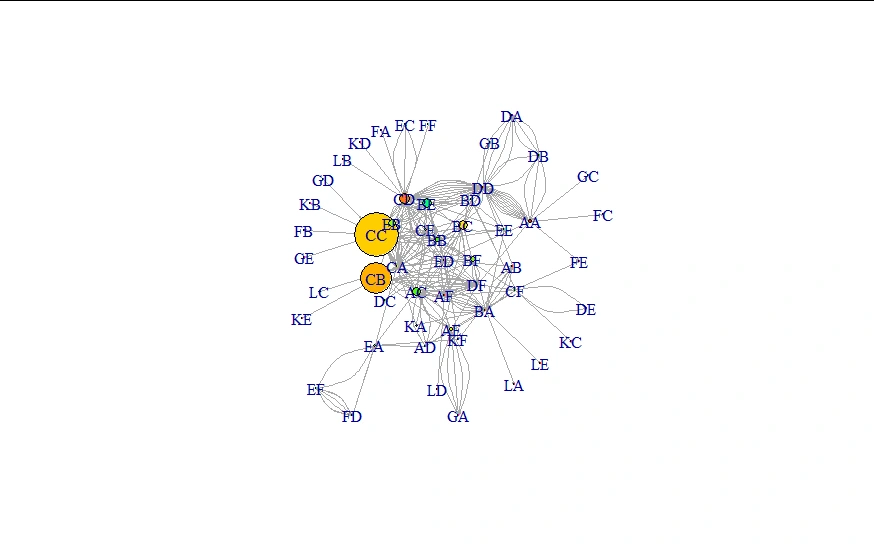
HUBS
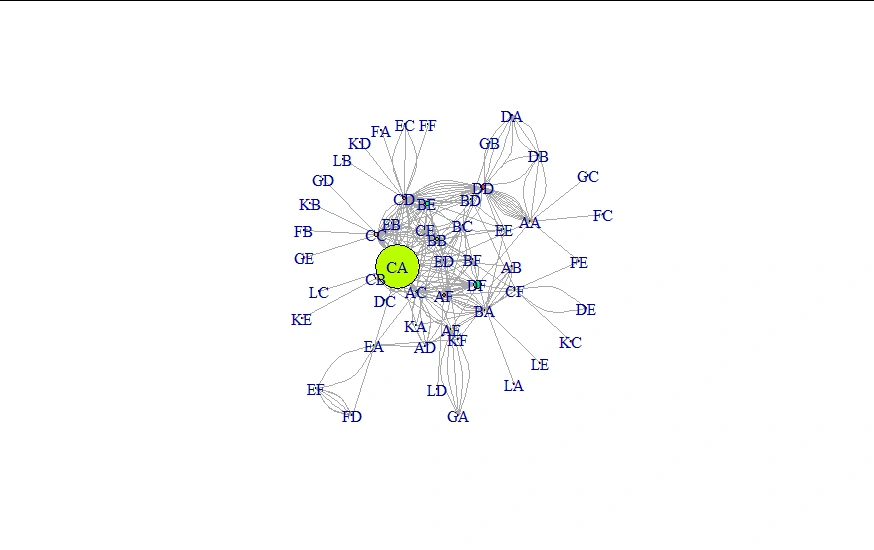
Authorities
#Community Detection
net<-graph.data.frame(y,directed=F)
cnet<-cluster_edge_betweenness(net)
plot(cnet,
net,
vertex.size=10,
vertex.label.cex=0.8)
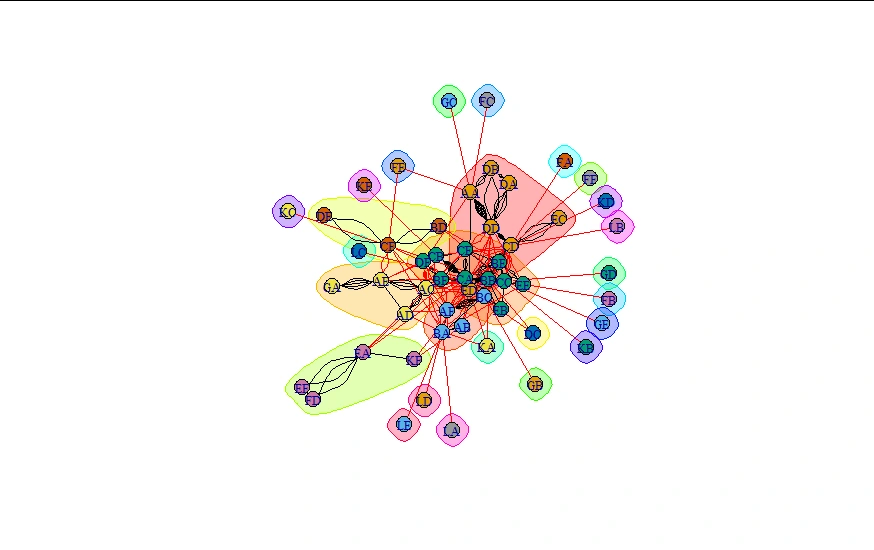
Community Detection
Like this project
Posted Feb 17, 2022
Social Network analysis using R
Likes
0
Views
3