Data Analysis and Visualization with Python
Abdulrahman Elsmmany
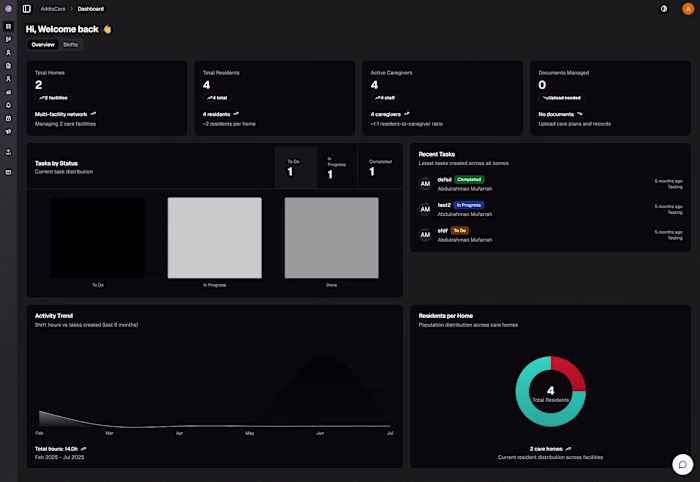
I successfully executed a data analysis and visualization project where I worked with diverse datasets. Utilizing Python, specifically leveraging libraries such as Pandas, NumPy, and JSON, I filtered and processed the data. The results were presented in a clear and insightful manner through visualization techniques, enhancing data comprehension.
Key Highlights:
Data Processing:
Data Visualization:
Multi-format Output:
Outcome:
The project resulted in a refined dataset, effectively filtered and processed, accompanied by compelling visualizations that facilitated a deeper understanding of the underlying patterns and trends.
Technologies Used:
Python
Pandas
NumPy
JSON
CSV
Matplotlib
Advantages:
Improved data comprehension through effective filtering and processing.
Clear insights presented through visually appealing charts and graphs.
Unique Approach:
What makes this project stand out is the meticulous use of Python libraries for data manipulation, ensuring a precise and insightful analysis, coupled with engaging visualizations that enhance the interpretability of the data.
Like this project
Posted Feb 4, 2024
I filtered and processed diverse datasets using Python (Pandas, NumPy) and created clear visualizations (Matplotlib) for key insights.