Decoding Shopper Habits: A Strategic Approach to Retail Success
Fridolin Paiki
Client
Online Retail Store - Customers are spread all over the world.
Industry
Retail | Small Business | Online Store
Challenges
In the business world, increasing revenue is achieved through various means. One of the way is by understanding customer needs and their purchase behaviour
Solutions
Data Preparation: Data were extracted and put through several cleaning and transformation processes. The purpose of this is to remove unnecessary data, such as data with null values or data that doesn't conform to certain formats/requirements. During the data transformation, I also generated several data and split data into parts, which could be used later to categorize the information from the data. Data pre-processing is an essential step in the data analysis pipeline. It entails cleaning and transforming raw data into a format suitable for analysis.
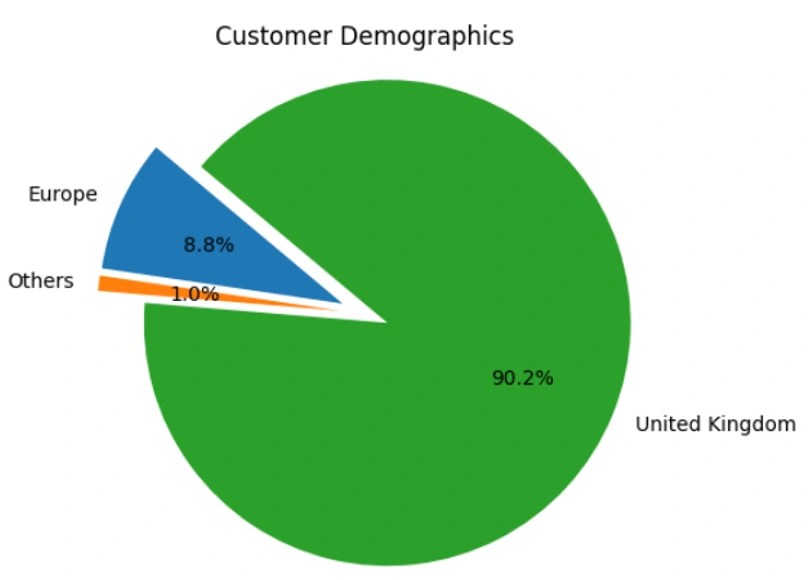
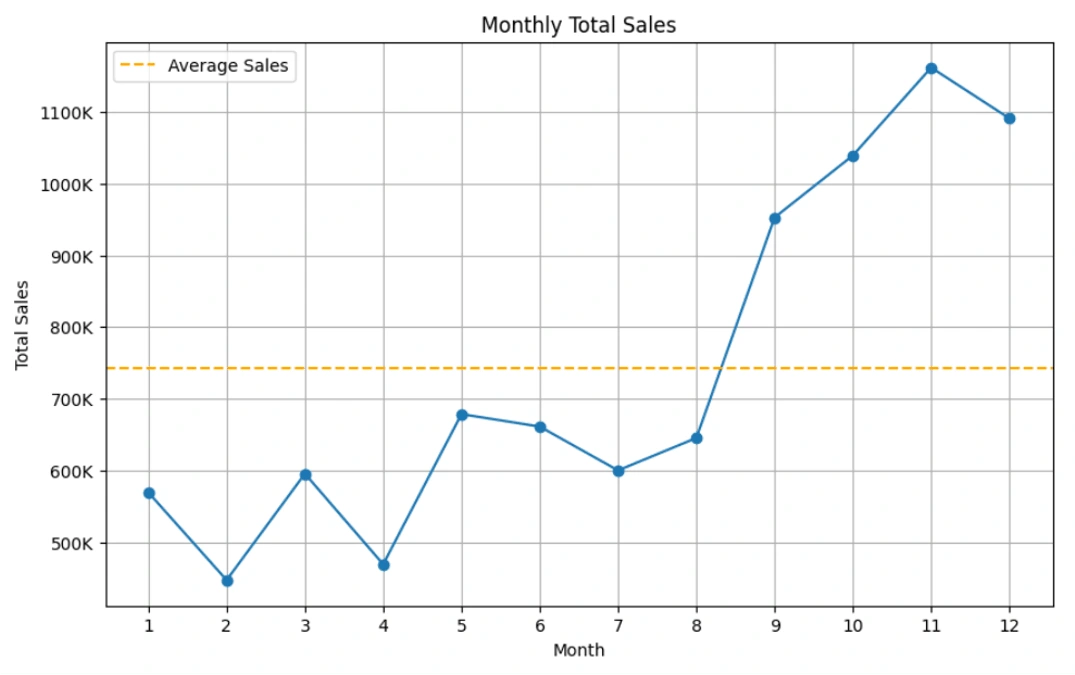
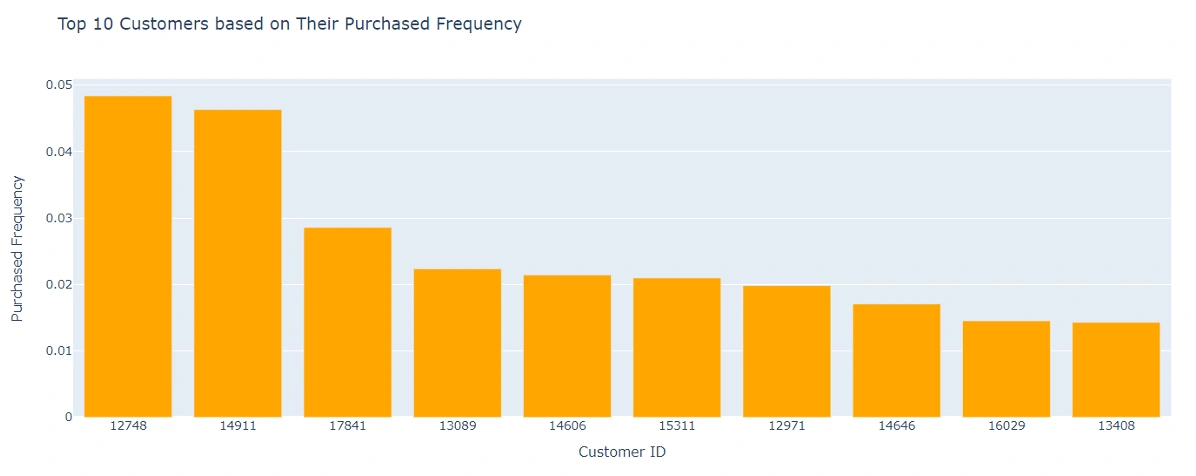
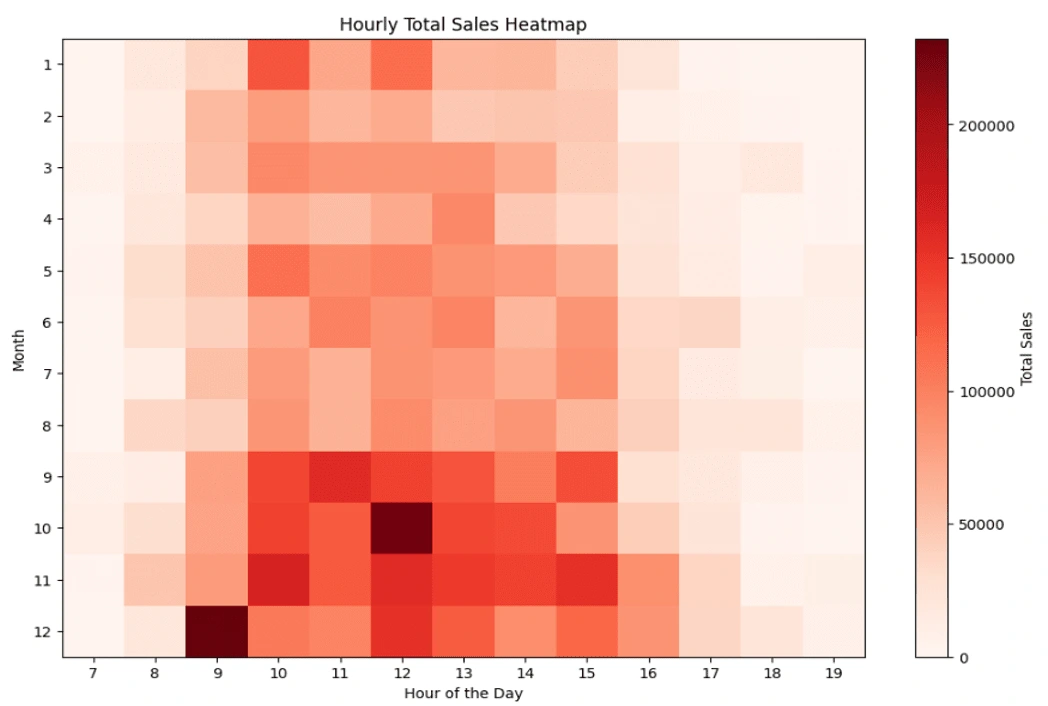
Exploratory Data Analysis: Understanding all kinds of information that can be generated from this data, such that has a meaningful impact on the business. Since this is a transaction record of a business, the most important part of a business is sales, it's about how much profit can be generated and how can we use this information to increase sales in the future. Therefore, I use this to get as much information as possible regarding the sales information, such as countries that have more sales, time of day that has more sales, type of customer to target, which product has the greater sales at a certain time, etc.
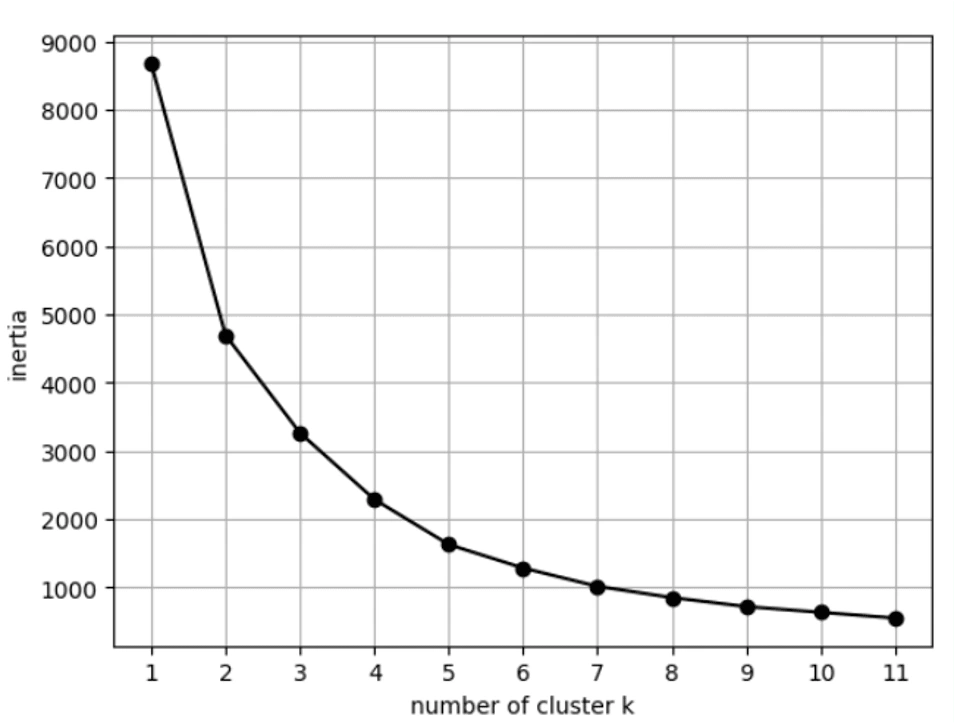
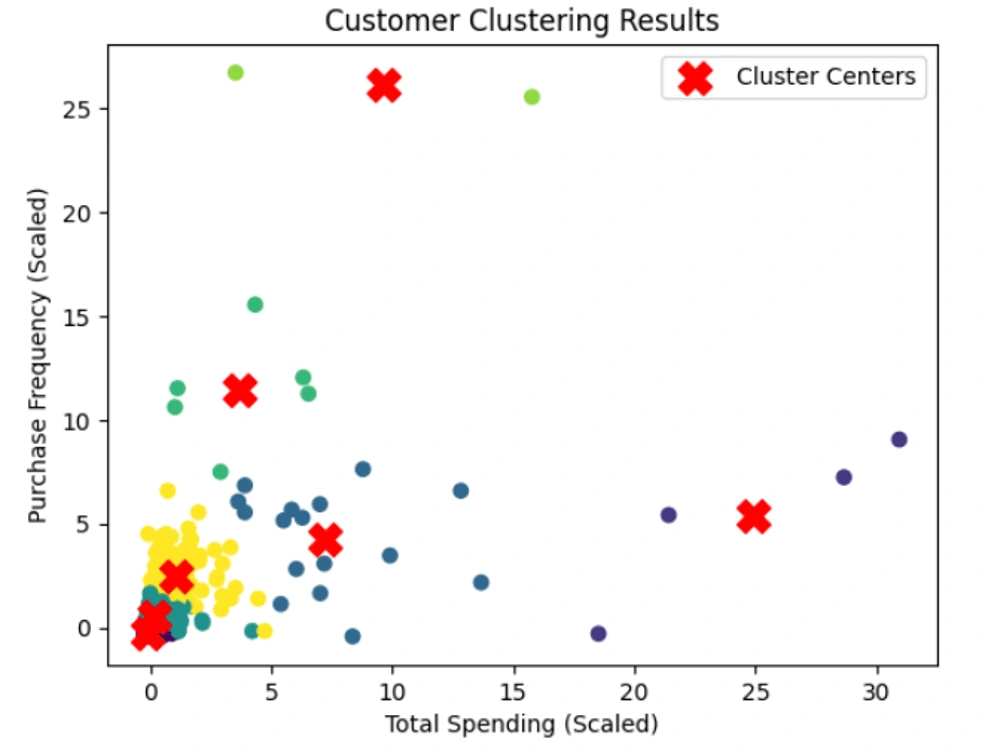
K-Means Clustering: As we attempt to find the number of suitable clusters among customers based on purchase frequency and total spending, we run the K-means method and identify 7 clusters over more than 4300 customers. The visualization of the results is presented above. It’s important to note that during the execution of the K-means algorithm, we standardize the data point to prevent model bias. To represent the result of customer clustering using K-means, we utilize a scatter plot.
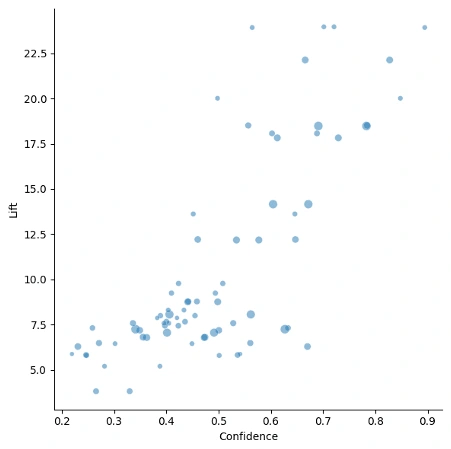
Market-Basket Analysis: To find out the customer purchase behavior, we used Apriori algorithm to find the relationship between purchased items. In this case, we use support, confidence, and lift as parts of the metrics with a minimum support of 0.02. In most cases, 0.05 is usually used as the minimum support. We chose 0.02 due to the difference between the number of transactions in each country. In this case, most of the transactions came from UK followed by Germany, France, EIRE, and Spain. This different number of transactions per country resulted in a low value of support per itemset and thus we need to lower the value of minimum support. The minimum threshold of 0.7 is chosen for both confidence and lift.
Outcome
K-Means Clustering: The information about the clusters of customers help the business to collect an appropriate number of customer feedback by implement a more on-point customer engagement.
Logistic Regression: They build a preventative strategy that can be used to reduce the number of cancellations and improve better sales.
Market-Basket Analysis: Based on the data in the dataset, the algorithm produces 76 association rules whose confidence and lift are bigger than 0.7. From the data, we found that there are 24 association rules (31.58%) that have values of lift more than 10.0. This can also be seen in the graph toward the upper right corner of the chart. These are the product associations that are mostly purchased together by customers in a transaction. This data shows which products that can be cross-selled in the store.
Further Improvements
Further analysis can be done to understand purchase behavior in each country separately. Implementing dashboard that can provide daily, weekly or monthly monitoring could also be helpful to identify the success of the implementation strategy as mentioned above in the outcomes.
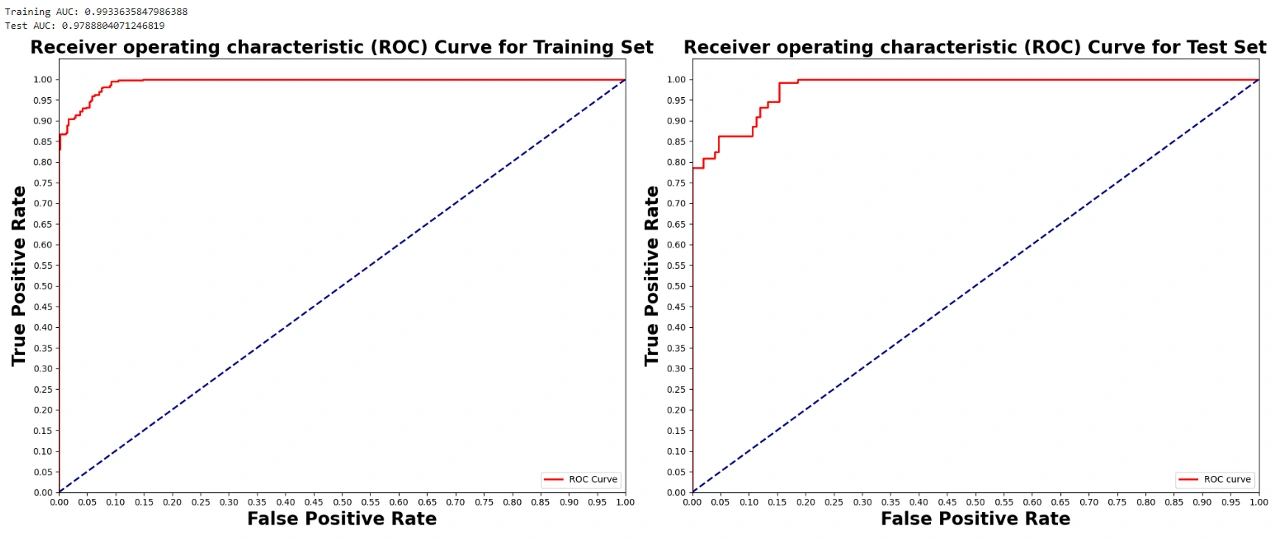
ROC Curve
Like this project
Posted Apr 4, 2024
Contribute to ffpaiki/ML-online-retail-2023 development by creating an account on GitHub.
Likes
0
Views
32