Your Performance Stats — Card

Mahin Rahman

Your Performance Stats — Card Breakdown
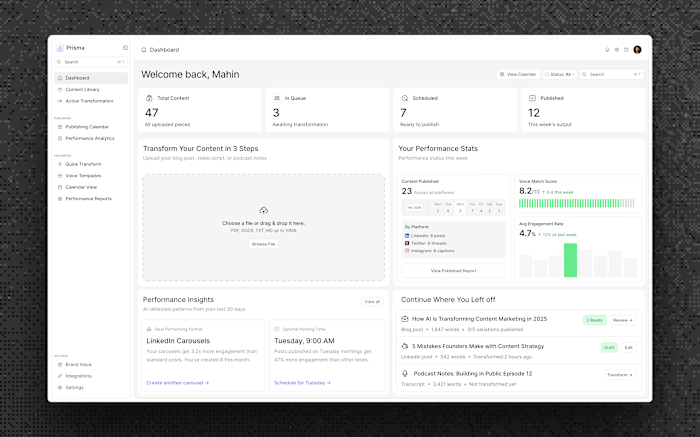
Designed this card to answer 3 questions users check daily:
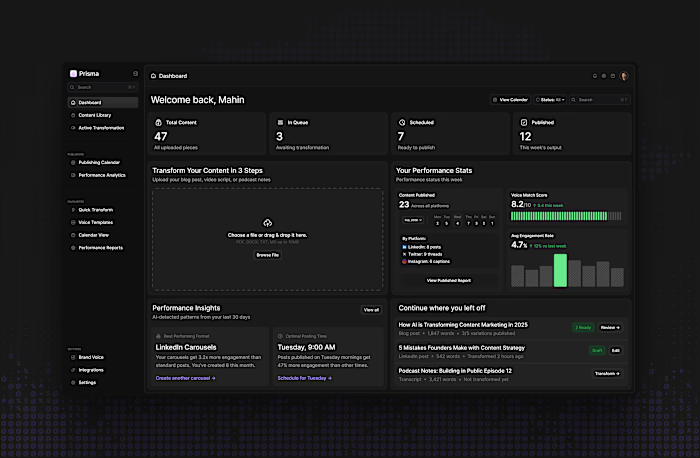
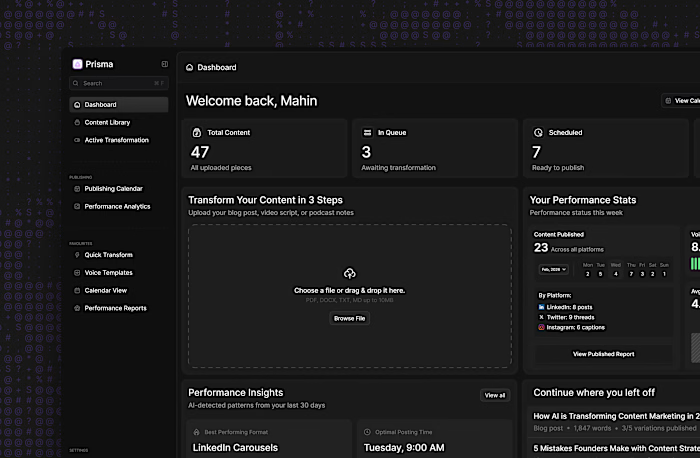
Content Published (23): Weekly breakdown by platform (LinkedIn: 8, Twitter: 9, Instagram: 6) with day-by-day activity chart
Voice Match Score (8.2/10): Is the AI actually sounding like me? Progress bar shows improvement over time
Avg Engagement Rate (4.7%): Is it working? Bar chart shows weekly trends with 12% increase vs last week
No vanity metrics. Just the data that tells you if your content strategy is working.
Light mode. Clean hierarchy. Actionable insights.
Like this project
Posted Feb 18, 2026
Your Performance Stats — Card Breakdown Designed this card to answer 3 questions users check daily: Content Published (23): Weekly breakdown by platform (Lin...
Likes
0
Views
8
Tags