
Self-initiated, AI-assisted portfolio demonstration. The organisation and figures are fictional. This is not paid client work.
The brief
Turn a small operations snapshot into a consistent, editable business presentation. The audience needs to see what is open, where the workload sits and what needs attention.
The output
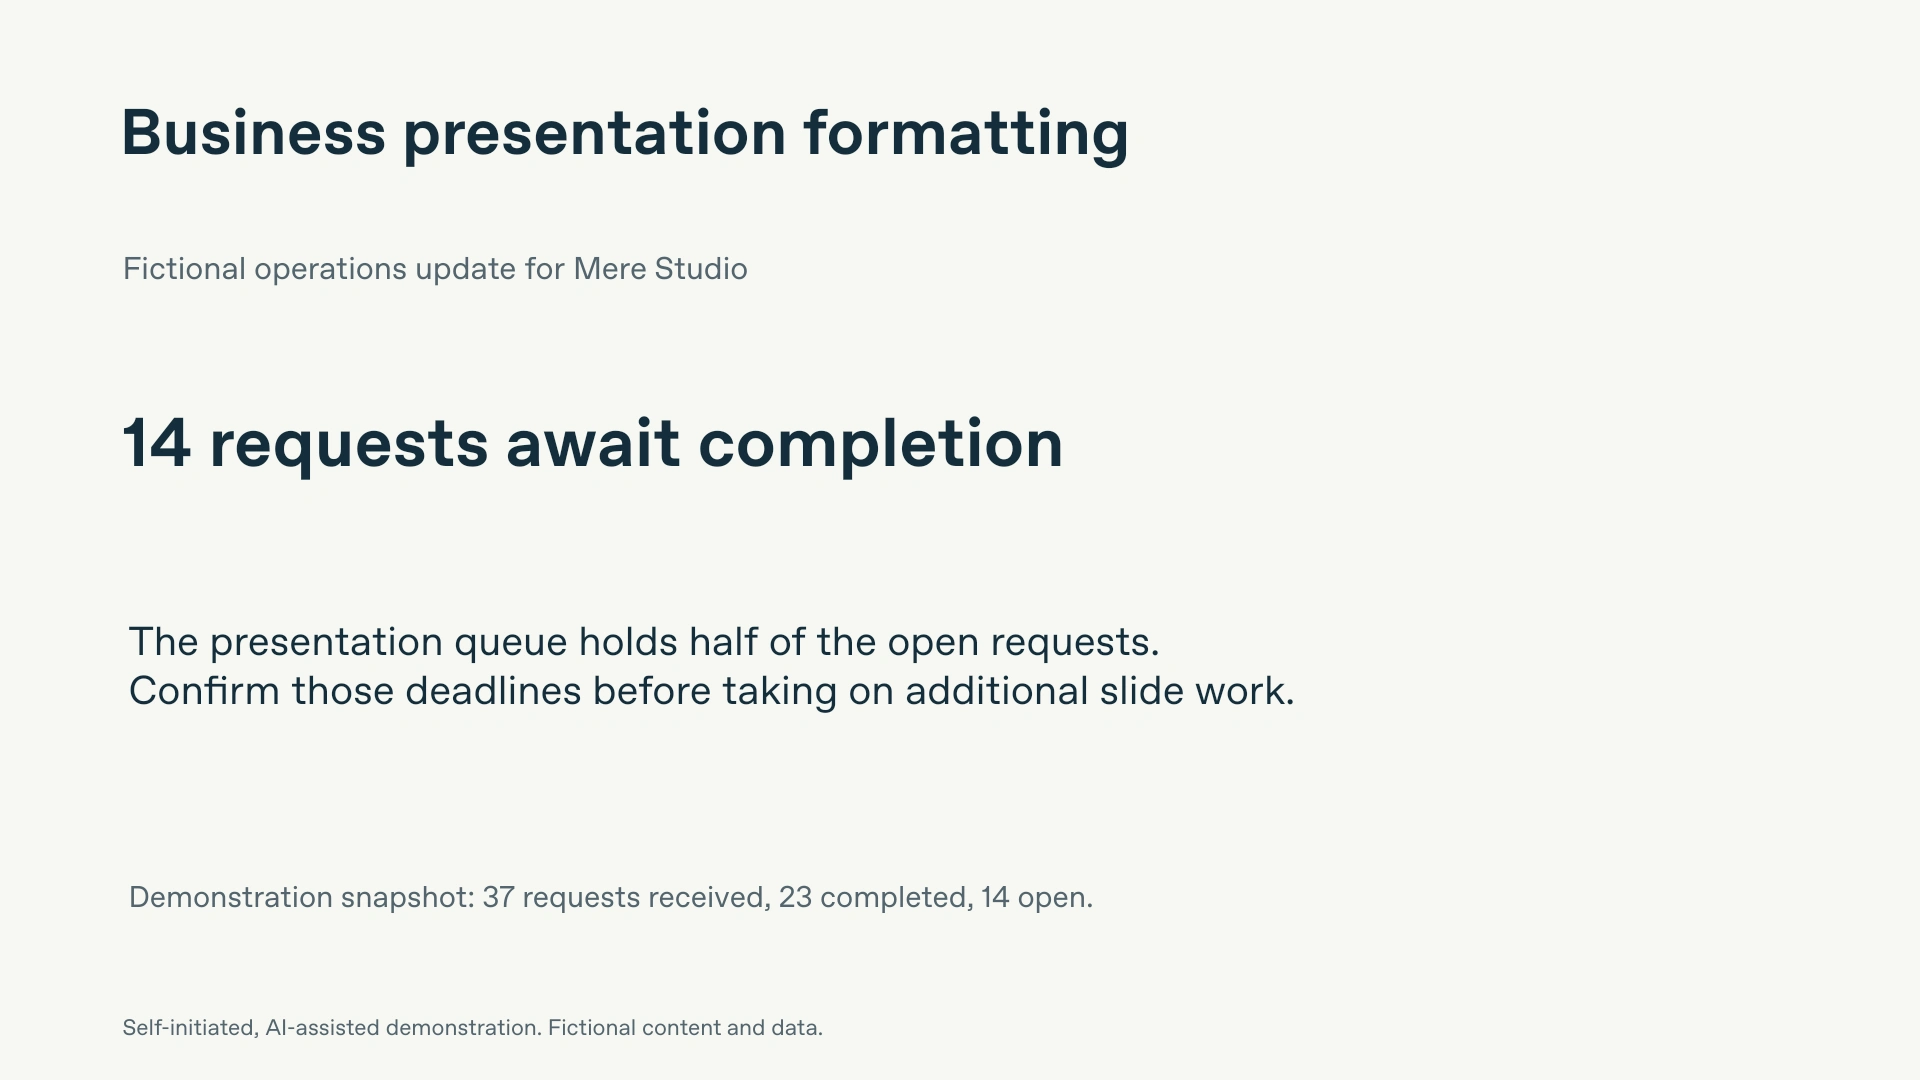
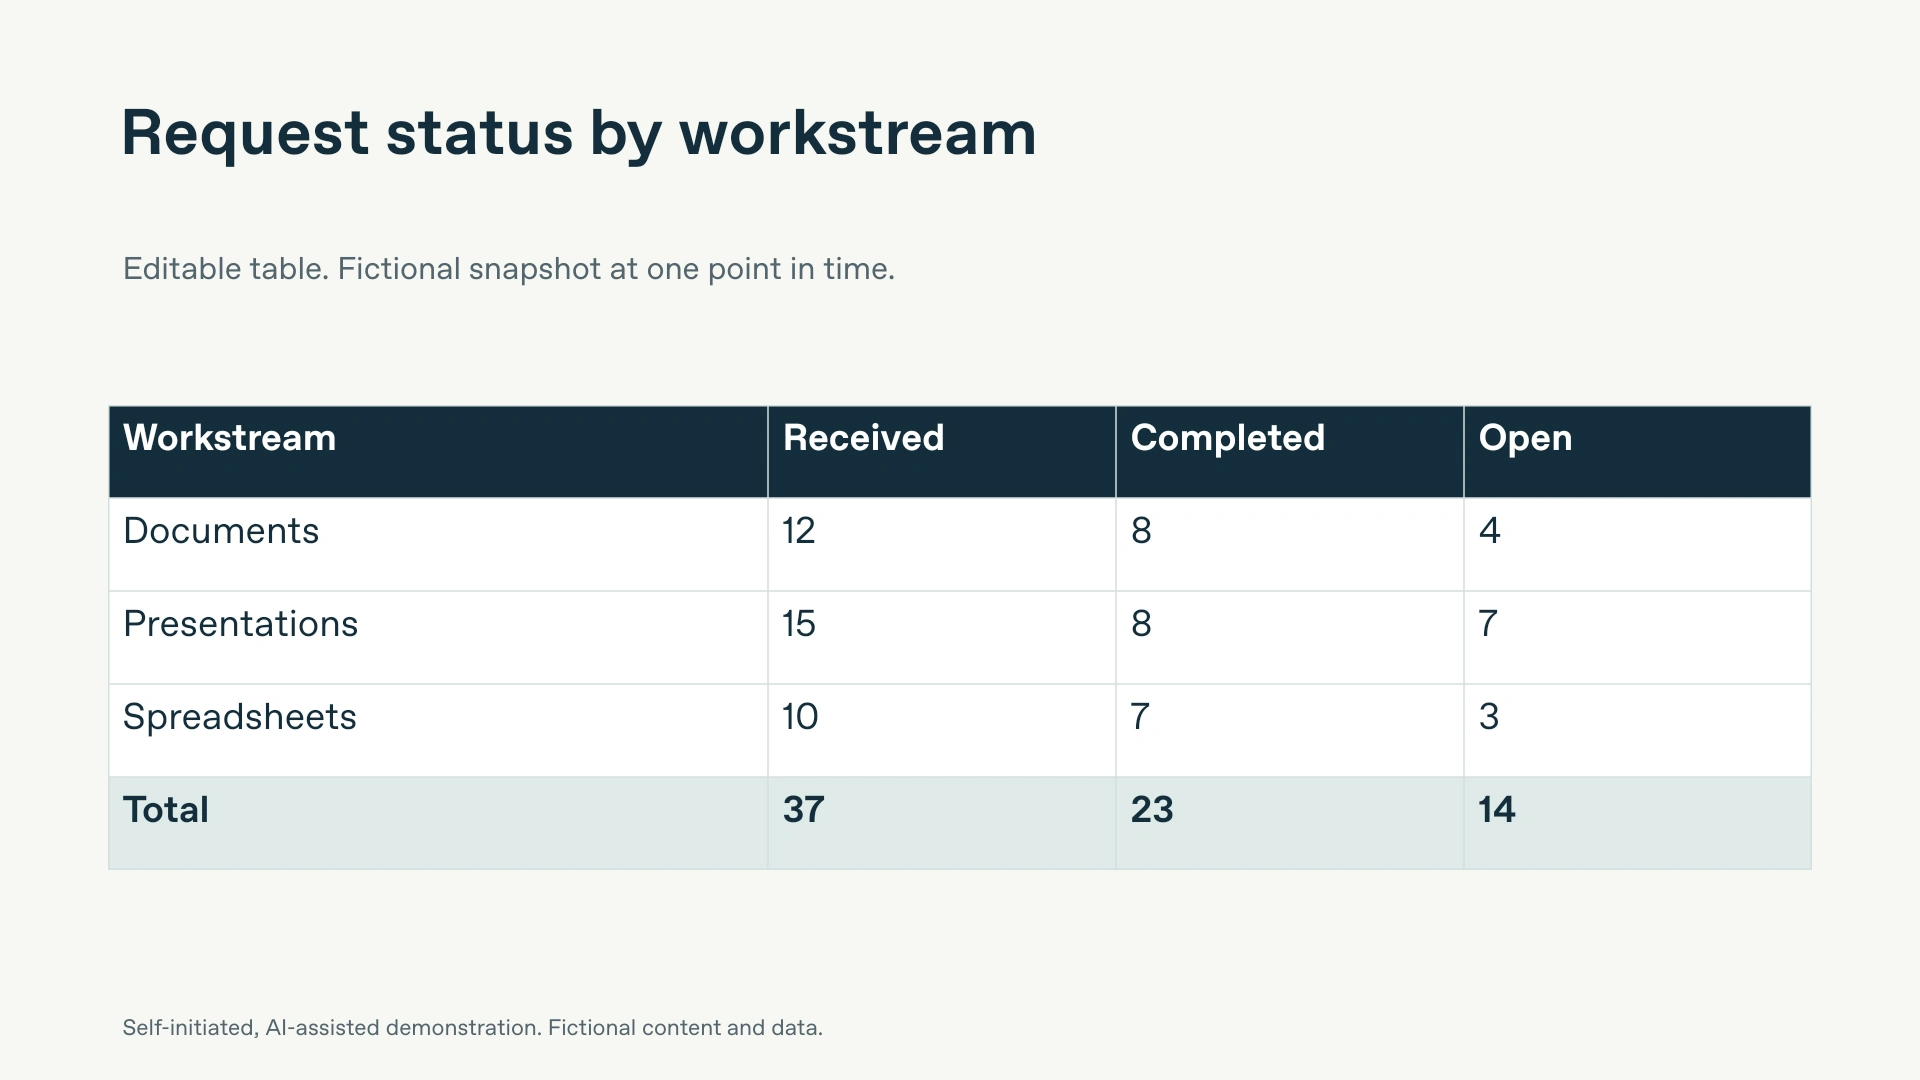
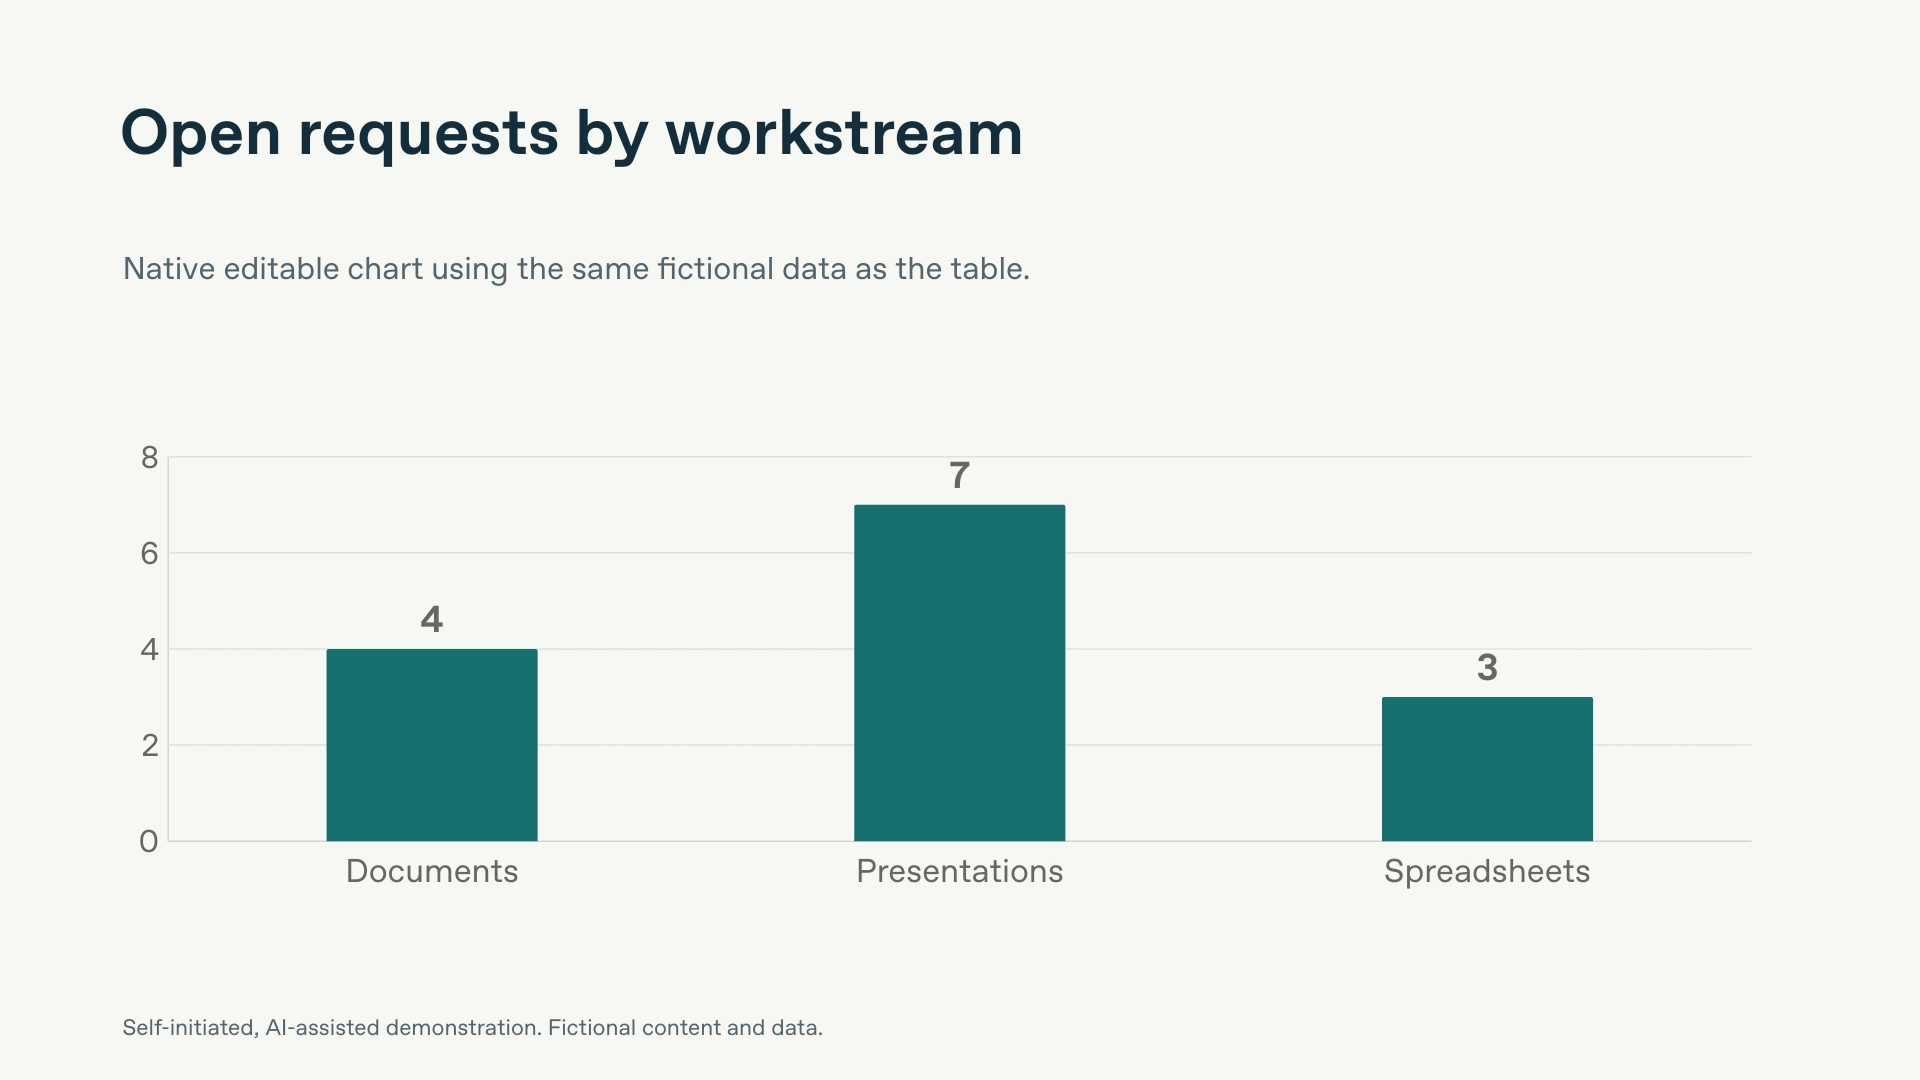
A concise summary slide, a native editable table and a native editable chart. The table contains 37 requests received, 23 completed and 14 open. The chart uses the same open counts: documents 4, presentations 7 and spreadsheets 3. Consistent typography, spacing and colour keep the slides aligned.
What this demonstrates
Clear hierarchy, readable slide layouts, accurate transfer of supplied numbers and editable data objects. The slide images below show the actual generated output. The editable PowerPoint sample is available on request.
Checks
The table totals and chart data were checked, every slide was rendered and inspected, and the PowerPoint package passed structural and editability checks. This sample has not been opened in desktop Microsoft PowerPoint or converted in Google Slides.
For client projects
I agree the source files, slide count, template requirements, output format and revision scope before starting. Any font substitutions or compatibility limits are flagged. This demonstration uses an original layout, rather than a client template.
0 likes · 0 views · Nov 15, 2026
A fictional business update with consistent formatting, a native editable table and chart, and checked totals.